
Real-time crypto pattern scanner & alerts. Detect pattern formations on 1K pairs across exchanges in under 20s. No API keys. Free trial. Not financial advice.
Joined December 2025
- Tweets 1,664
- Following 9
- Followers 151
- Likes 40
1,614 Photos and videos


Pinned Tweet

22 Dec 2025
Reality check: ChartScout detects chart patterns - it does not predict outcomes. Patterns are probabilistic and can fail or invalidate at any time.
ChartScout helps you spot forming setups earlier; execution, context, and risk management are still on you.
Your responsibility:
- Use patterns as ONE part of your strategy
- Combine with other analysis (volume, support/resistance, news)
- Manage risk (stop losses, position sizing)
- Make your own trading decisions
ChartScout monitors public market data only and does not execute trades.
chartscout.io/
4
4,977
⚪ Symmetrical Triangle approaching apex
$ERA | 1h | @binance
Maturity: 85%
Symmetrical triangles reflect market indecision and compression.
#CryptoTrading #ChartWatch
1
4
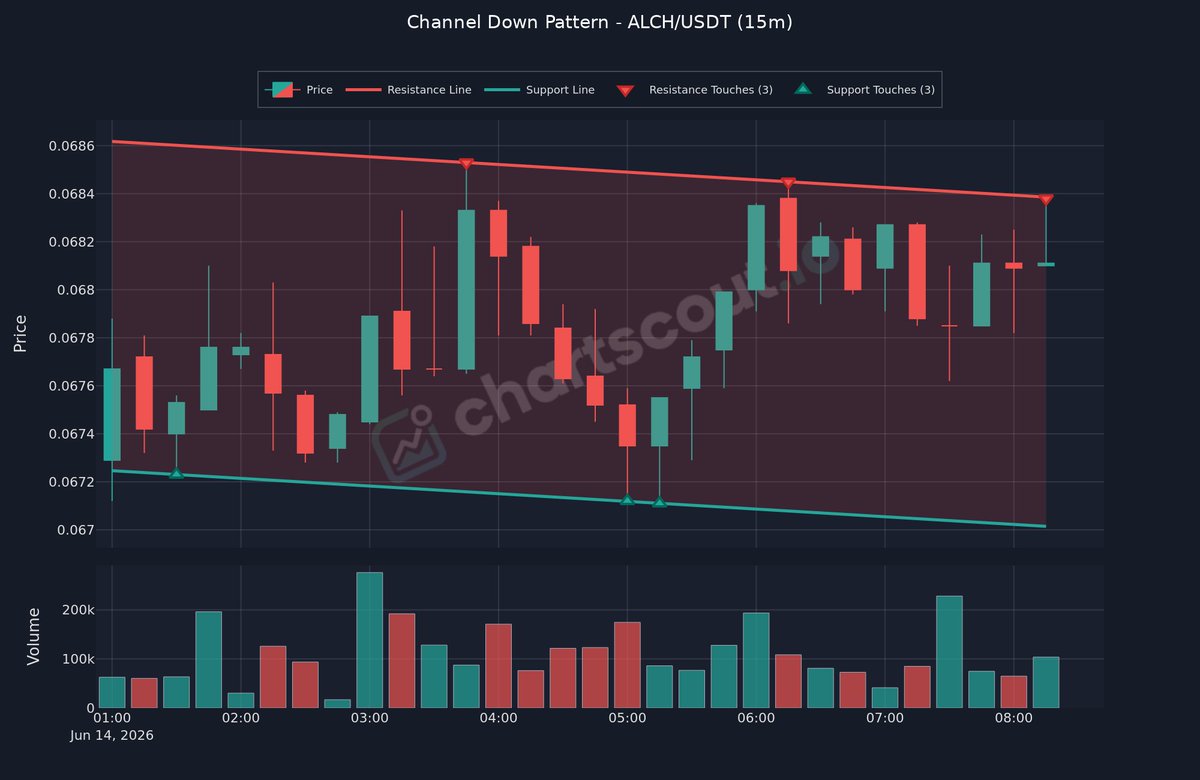
🔴 Descending channel pattern detected on chart
$ALCH | 15m | @binance
Upper boundary acts as resistance, lower boundary as support.
#ChartPatterns #BearishSetup
2
17
🟢 TD Setup complete, selling momentum may be exhausting
$ETH | 5m | @Bybit_Official
Volatility often changes around completed TD Sequential counts.
#CryptoTrading #Ethereum
1
2
36
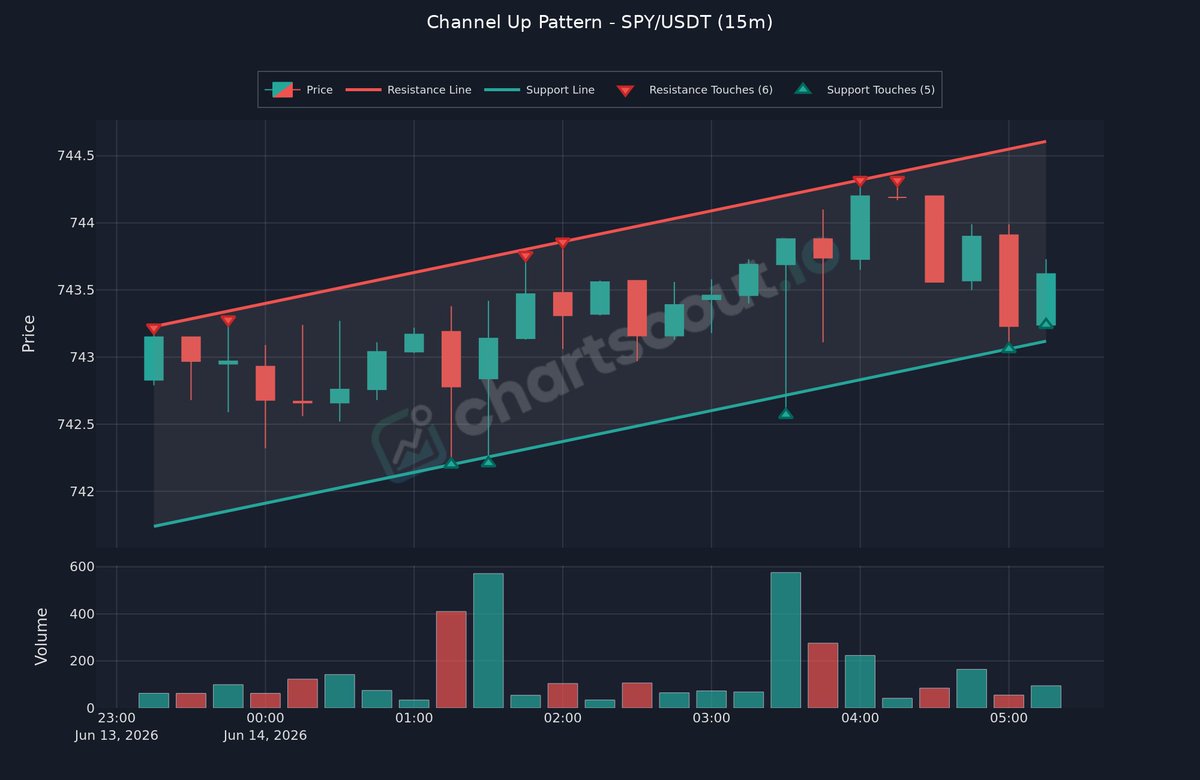
🟢 Price moving within rising parallel channel
$SPY | 15m | @binance
A break below the channel may indicate trend change.
#CryptoTrading #Bullish
2
62
🟢 Double Bottom (W-pattern) identified on chart
$ILV | 4h | @binance
Volume often increases on the second bottom.
#TechnicalAnalysis #BullishSetup
1
1
3
33
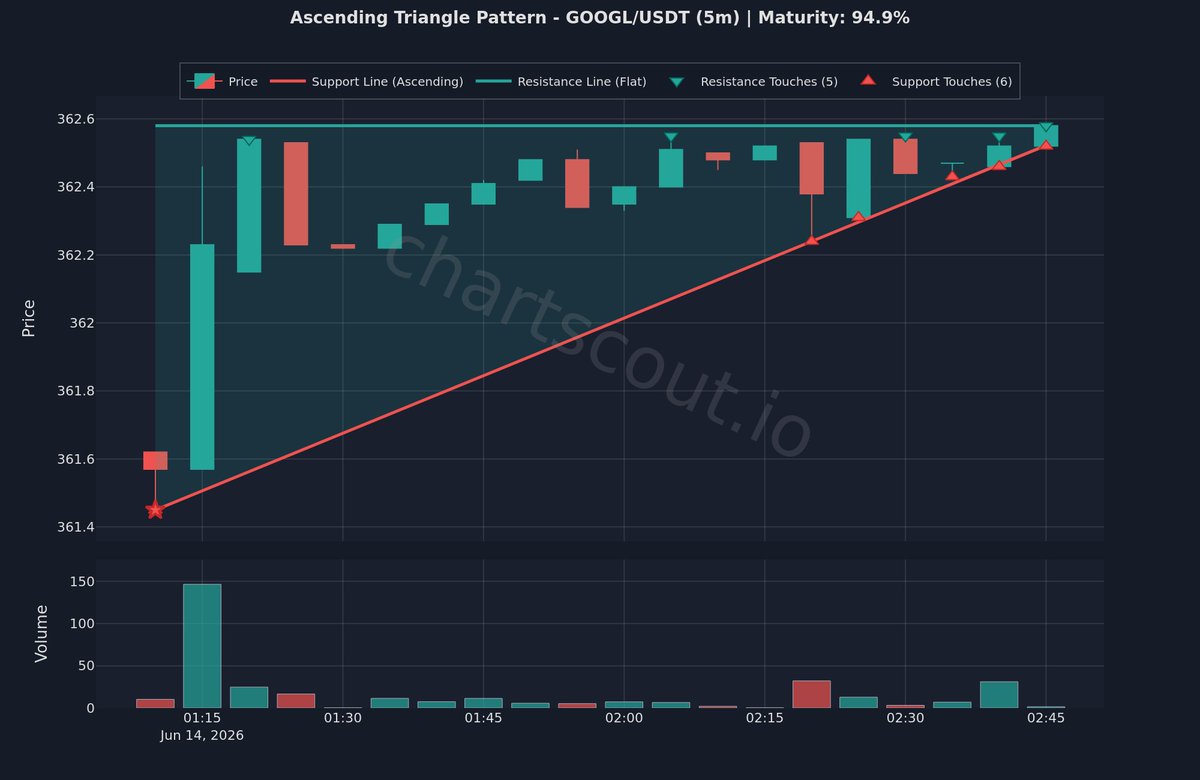
🟢 Flat resistance with rising support, ascending triangle
$GOOGL | 5m | @binance
Maturity: 95%
The pattern shows consistent buying at progressively higher levels.
#ChartPatterns #Bullish
2
30
🔴 Bear Flag continuation pattern detected
$EDGE | 30m | @binance
Consolidation shows lower highs within the flag structure.
#TechnicalAnalysis #ShortSetup
3
56
🔴 Pennant forming after sharp decline, volatility compressing
$STO | 5m | @binance
Converging support and resistance lines show decreasing volatility.
#TechnicalAnalysis #ShortSetup
2
111
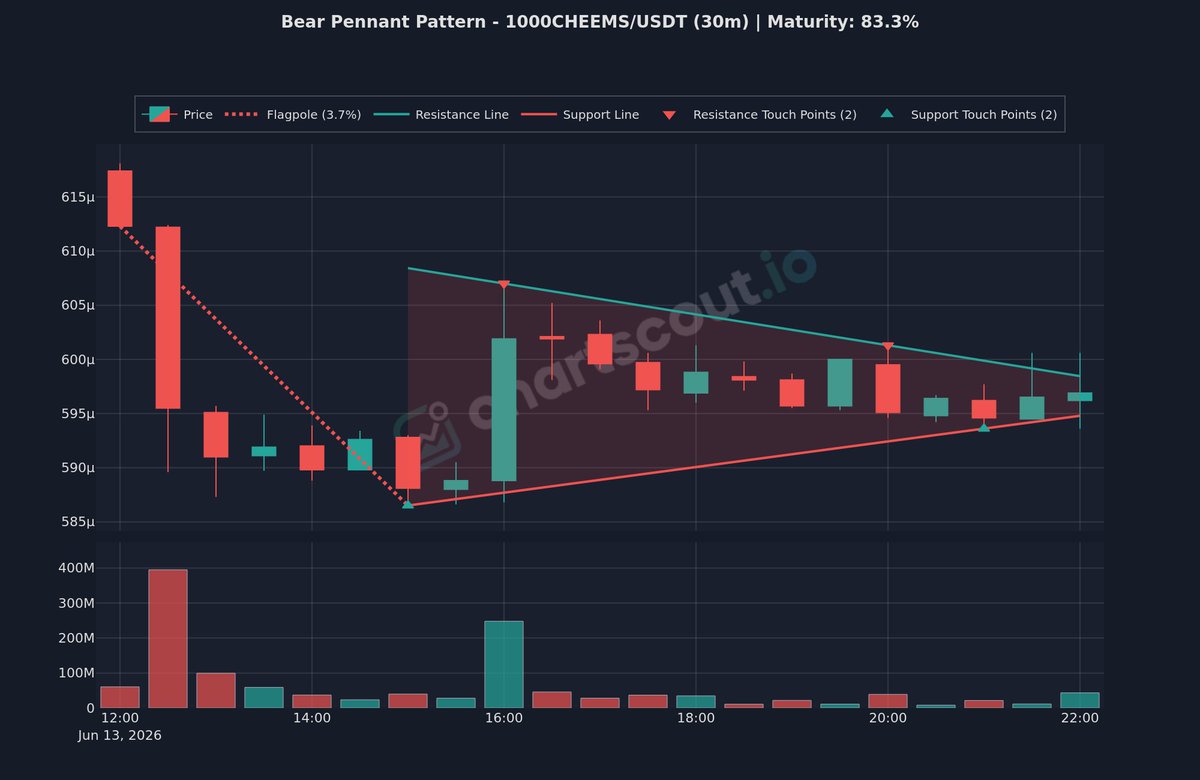
🔴 Bearish Pennant continuation pattern detected
$1000CHEEMS | 30m | @binance
Sharp decline followed by converging trendlines (pennant).
#ChartPatterns #Bearish
2
11
🔴 Lower highs pressing against horizontal support
$ENA | 5m | @binance
Maturity: 81%
Flat support with a series of lower highs forming declining resistance.
#ChartPatterns #Bearish
3
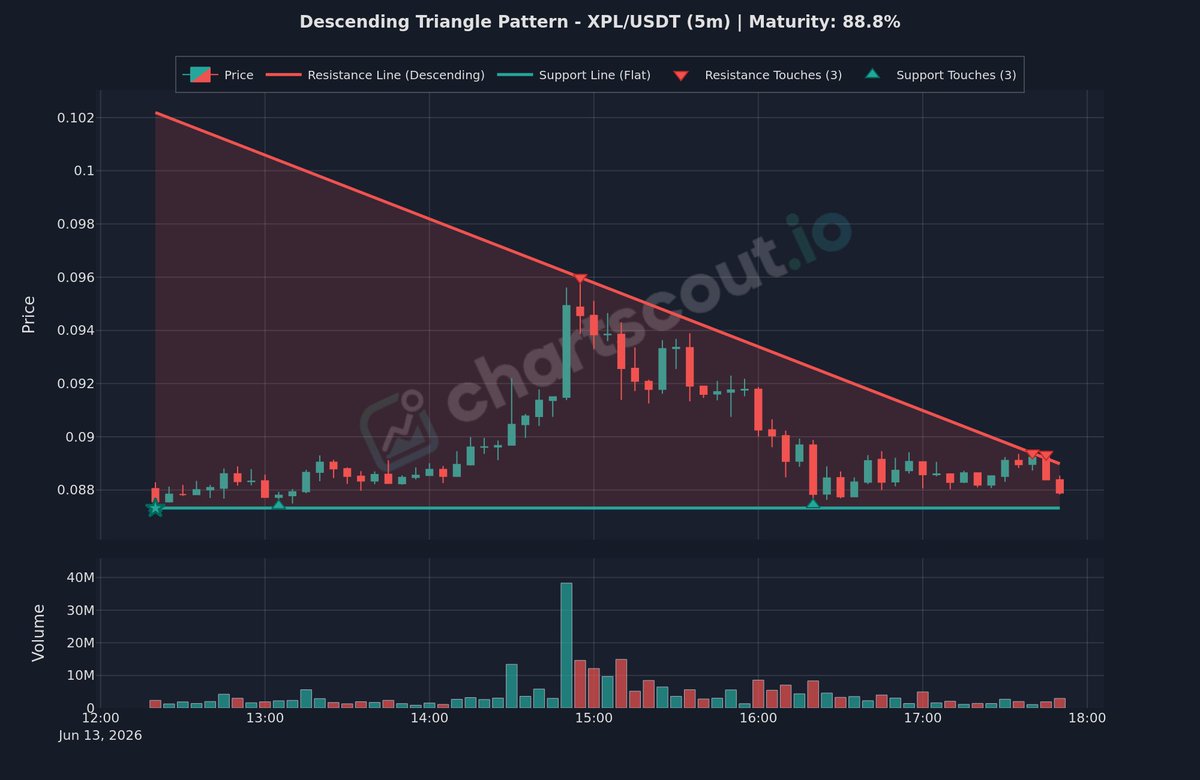
183
🔴 Flat support with declining resistance, descending triangle
$XPL | 5m | @binance
Maturity: 89%
Volume typically contracts as price approaches the apex.
#ChartPatterns #BearishSetup
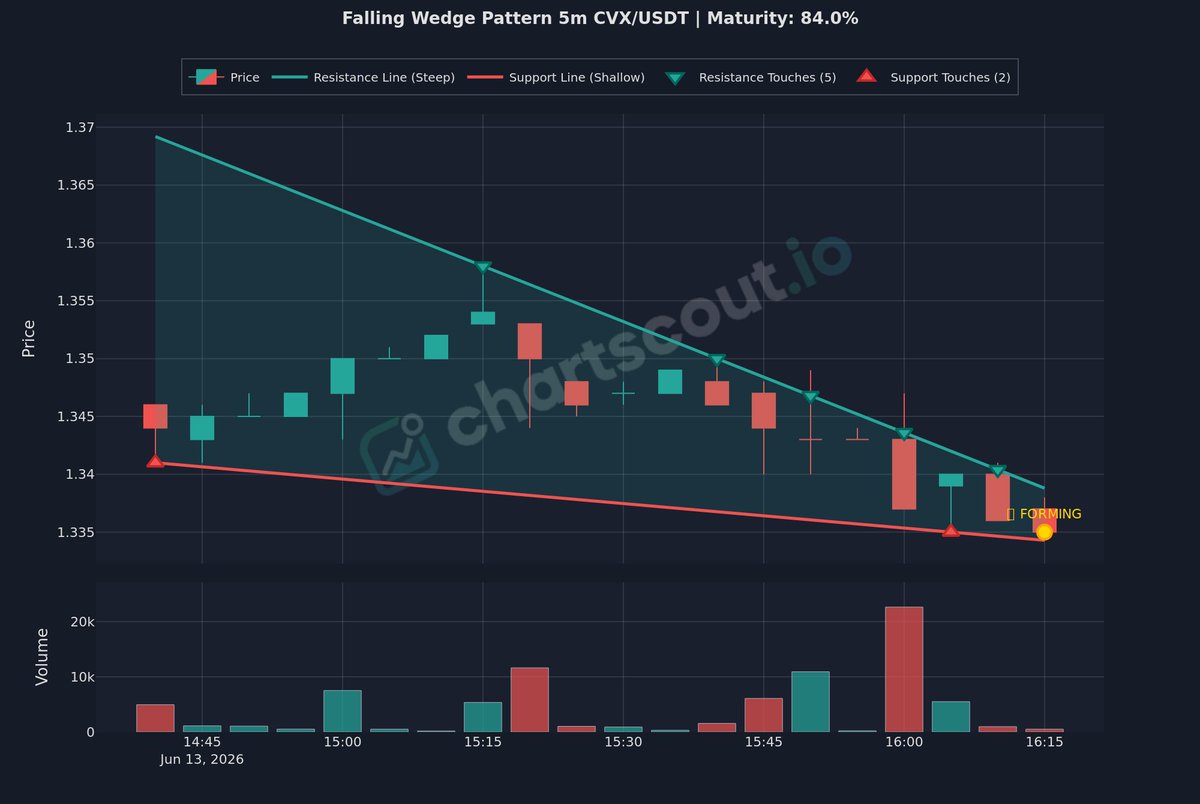
2
126
🟢 Falling Wedge detected, converging trendlines
$CVX | 5m | @binance
Maturity: 84%
The narrowing range indicates decreasing selling pressure.
#Trading #LongSetup
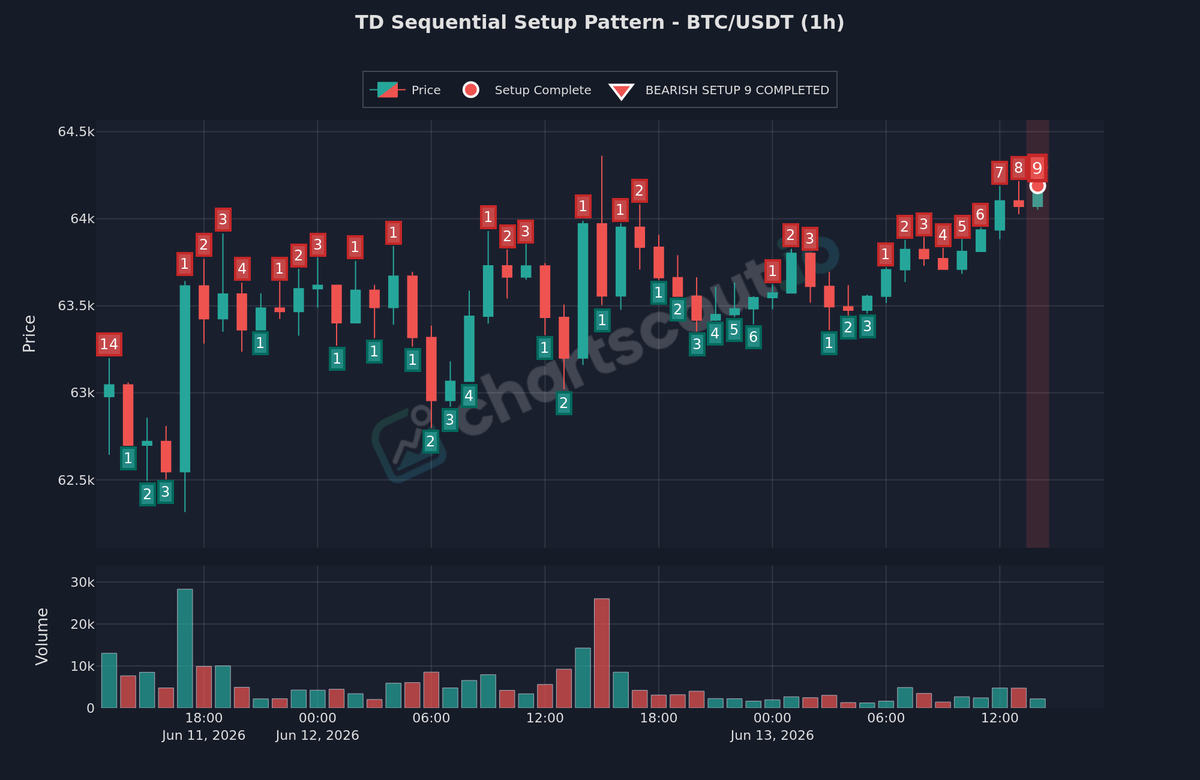
2
19
🔴 Bearish TD Sequential Setup completed on chart
$BTC | 1h | @binance
Volatility often changes around completed TD Sequential counts.
#ChartPatterns #Bitcoin
2
33
🟢 Falling Wedge pattern detected on chart
$HUMA | 15m | @binance
Maturity: 86%
Falling wedges are typically bullish reversal or continuation patterns.
#ChartPatterns #BullishSetup
2
34
🟢 Bull Flag detected, orderly pullback within uptrend
$NEAR | 15m | @HyperliquidX
Strong impulse move (flagpole) followed by a tight consolidation (flag).
#TechnicalAnalysis #Bullish

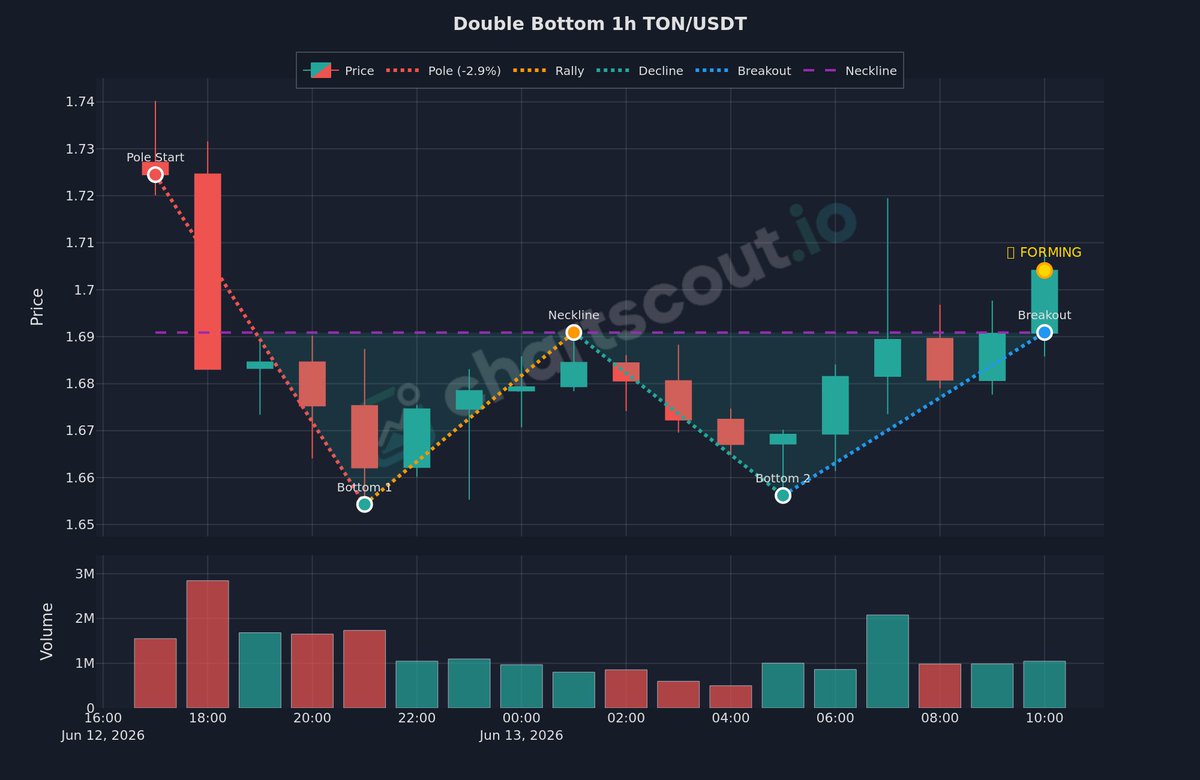
1
3
51
🟢 Double Bottom (W-pattern) identified on chart
$TON | 1h | @binance
The neckline (resistance between troughs) is the key level.
#Trading #LongSetup
4
57
🔴 Channel Down structure detected on chart
$ACX | 15m | @binance
A break below the channel may indicate trend acceleration.
#ChartPatterns #ShortSetup

2
29