
I'm Ayomide O, and I'm a recent graduate with a Bachelor's Degree in Accounting. I'm seeking a full-time opportunity where I can employ my Data Analysis Skill.
Joined May 2024
- Tweets 172
- Following 40
- Followers 19
- Likes 171
26 Photos and videos


Pinned Tweet

27 Dec 2025
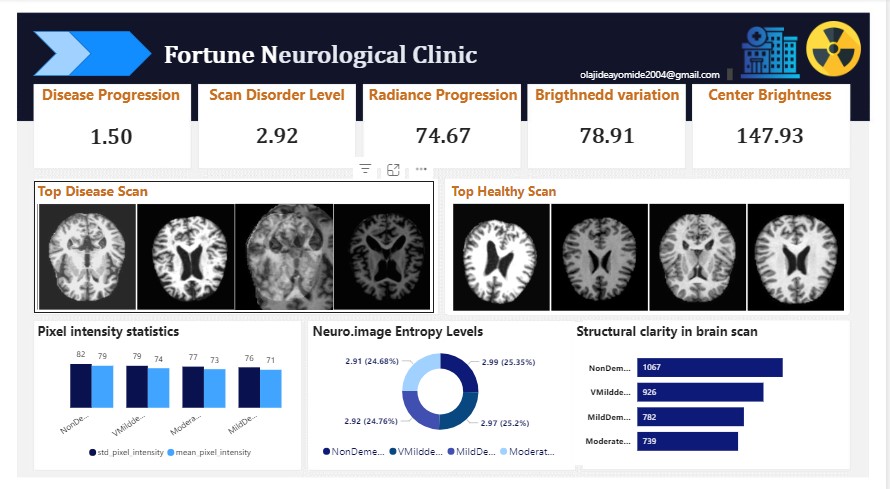
This report presents an analytical overview of neurological imaging and statistical data obtained from the Fortune Neurological ClinicDashboard The purpose of this report is to interpret the data in a structured manner, highlight clinical implications, and provide recommendations
5
162
Apr 3
2
1
5
1,062
Apr 2
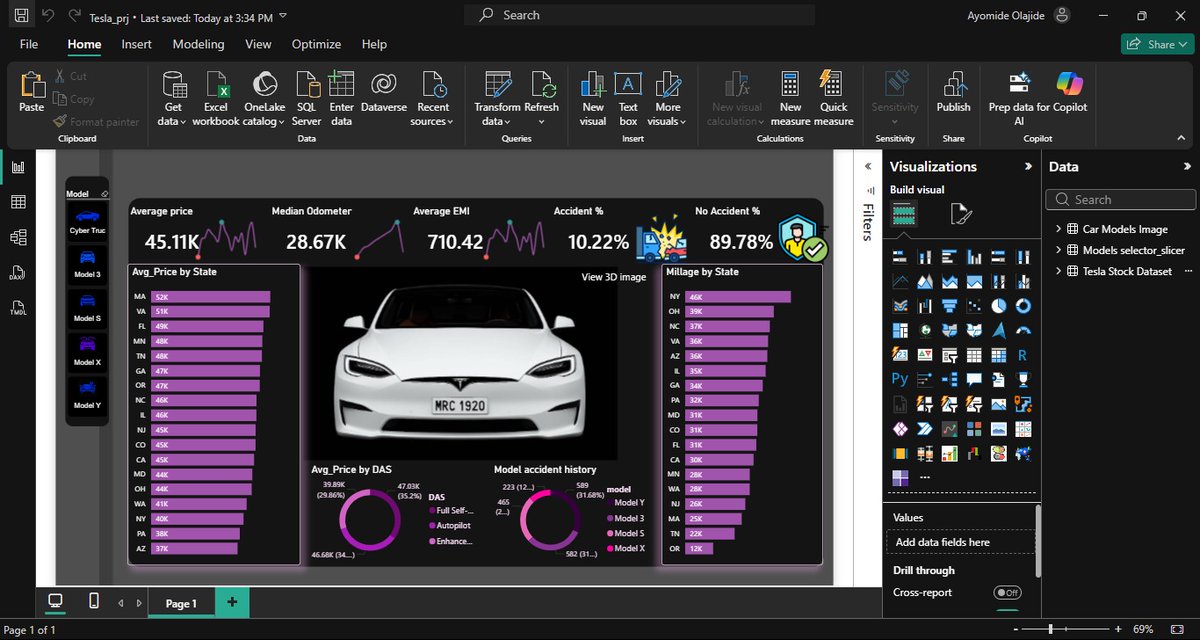
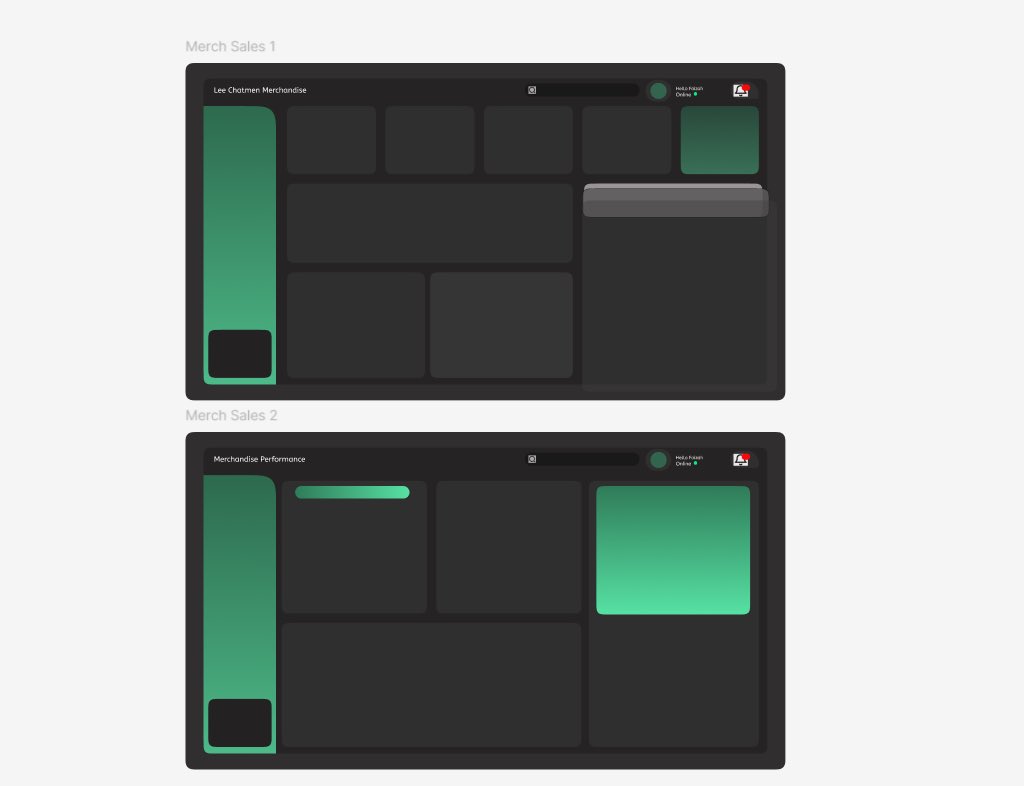
Cooking something delicious 👩🍳🥣
Stay tuned 😉😎
#datafam #powerbi #dataanalytics #datanerd #webscrapping #DataDriven #datavisualisation #DAX
1
2
28
Mar 16
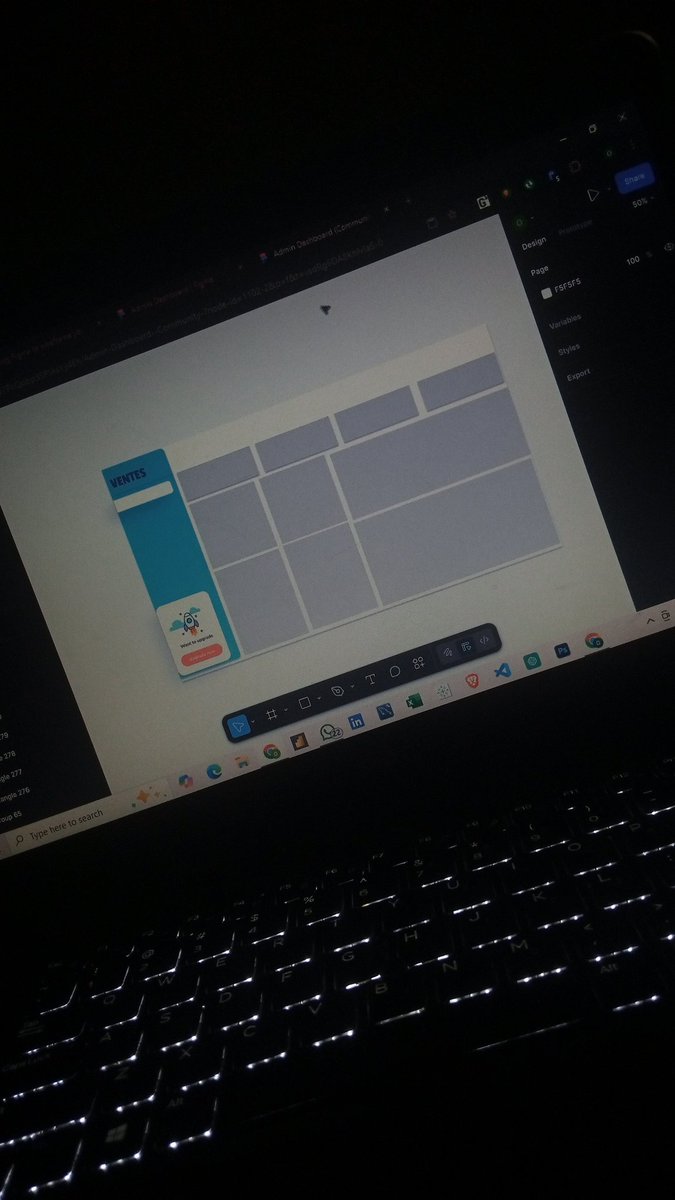
I will like to analys this type of data using python

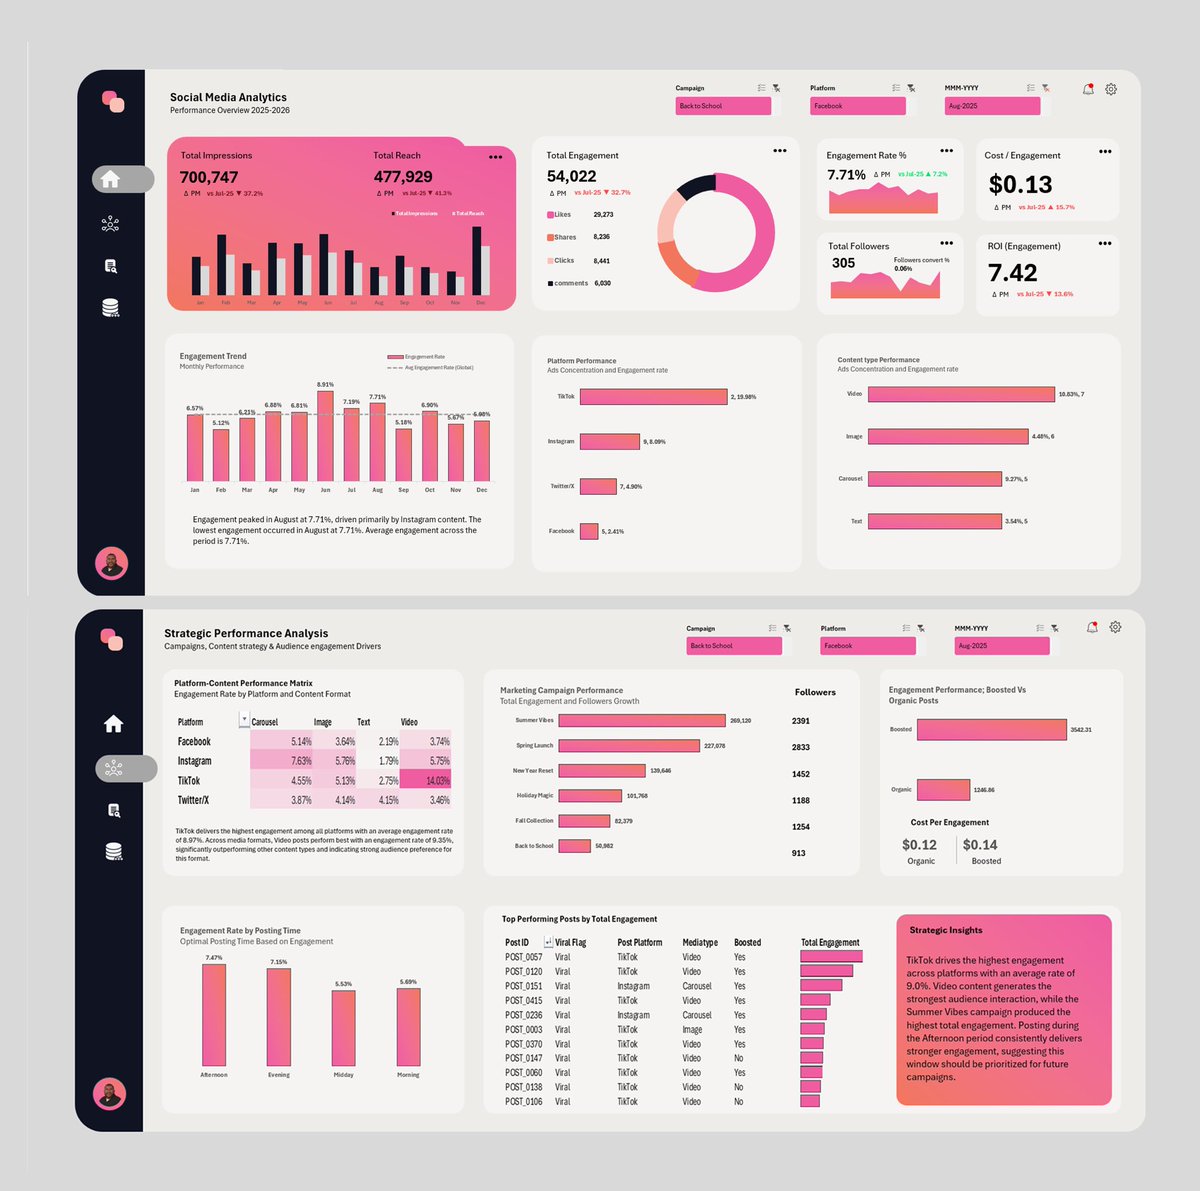
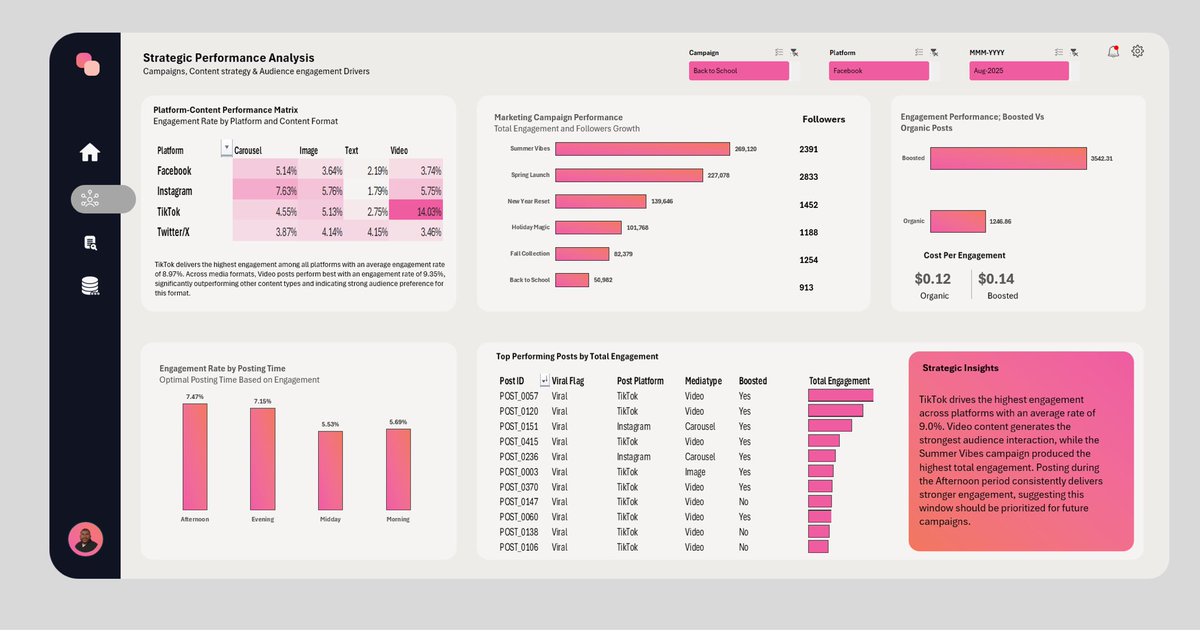
𝟴𝟳𝟬,𝟬𝟬𝟬 𝗲𝗻𝗴𝗮𝗴𝗲𝗺𝗲𝗻𝘁𝘀.
But only 0.11% of viewers became followers.
That’s what I found when analyzing a year of a client’s social media data.
They had posted 450 times and generated 13.2 million impressions.
On the surface, everything looked great.
But when I broke the data down, most of the performance came from just a few patterns.
𝗣𝗹𝗮𝘁𝗳𝗼𝗿𝗺
→ TikTok engagement rate: 8.97%
→ Facebook engagement rate: 3.46%
Yet they were posting equally on both.
𝗙𝗼𝗿𝗺𝗮𝘁
→ Video posts averaged 9.35% engagement
→ Text posts averaged 2.85%
But both were treated the same in the content calendar.
𝗧𝗶𝗺𝗶𝗻𝗴
→ Afternoon posts averaged 7.47% engagement
→ Midday posts averaged 5.53%
Posting times were mostly random.
Same team. Same budget.
Very different results depending on where, what, and when they posted.
But the biggest signal was still that 0.11% follower conversion rate.
People were engaging with the content.
They just weren’t staying.
So the recommendations were straightforward:
→ Focus more effort on TikTok
→ Make video the default format
→ Prioritize afternoon posting
→ Boost posts that are already performing
Small changes. Much better return.
This is the guided project for Cohort 8 of Data with Danny — built entirely in @msexcel . No BI tools. Just clean data and the right questions.
#DataAnalytics #SocialMediaAnalytics #Excel #DataWithDanny #Datafam

21
Ayo Mi De retweeted

This month, may your hard work stop being invisible. May interviews turn into offers, pitches turn into offers, and late nights turn into opportunities. May God bless the work of your hands and reward the discipline people don’t see.
Happy new month.

Feb 1

This month, may your hard work stop being invisible. May interviews turn into offers, pitches turn into offers, and late nights turn into opportunities. May God bless the work of your hands and reward the discipline people don’t see.
Happy new month.

4
4
38
1,623
Ayo Mi De retweeted

Jan 23
Many tech schools teach Data Analysts, the tools and focus heavily on design, and yes, good design matters. But from experience, reports break down when teams ignore some of the real operational practices listed below:
• Clear ownership: who’s accountable when numbers change,
• Validation checks: reconciling reports back to source data,
• Data lineage: tracing where each metric comes from,
• Access control: managing who can view or edit,
• Scalabilty: planning for growth in users and data,
• User alignment: building what people actually need,
• Source control: managing changes safely
• Stakeholder priority shifts: handling evolving business questions and many more.
These are the practices that keep dashboards trusted in real organisations.
3
12
104
4,883
Ayo Mi De retweeted
Beautifully done..
Jan 23

2
2
21
818
Ayo Mi De retweeted

Instead of an MSc in Nigeria, If you can afford CIPM, CIPS, go for it. Supply chain will rush you like honey
66
344
3,105
493,374
Ayo Mi De retweeted

Jan 20
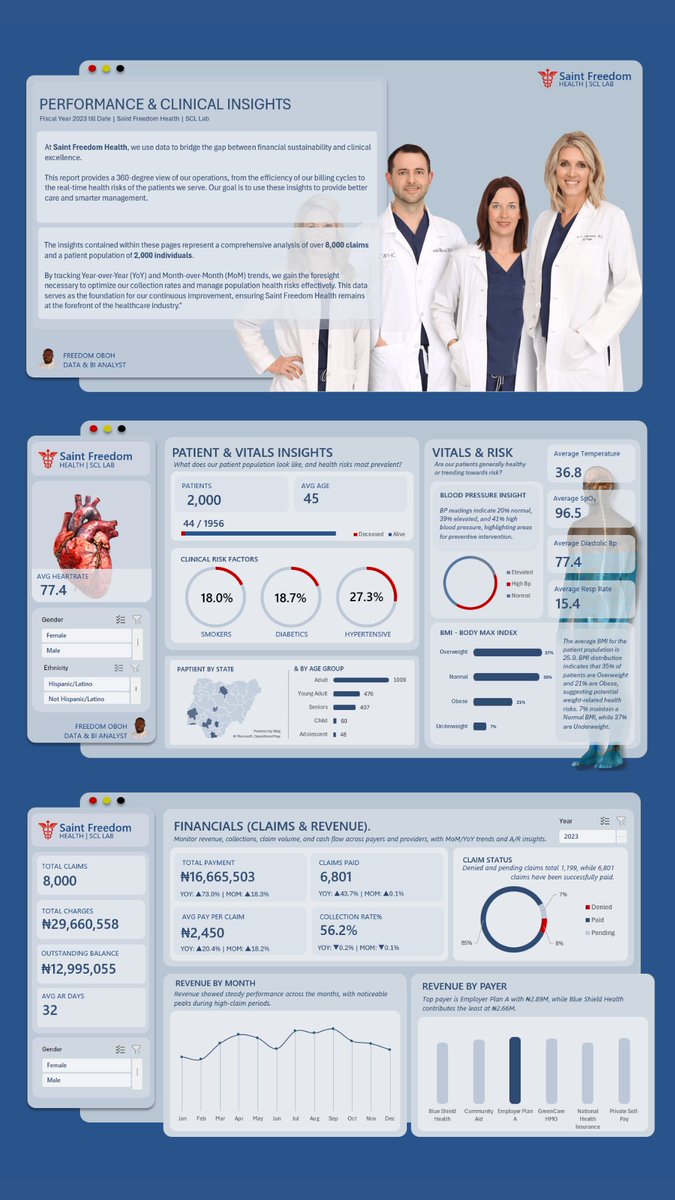
Every Monday morning at Saint Freedom Health, the same conversation happened, but in two different languages.
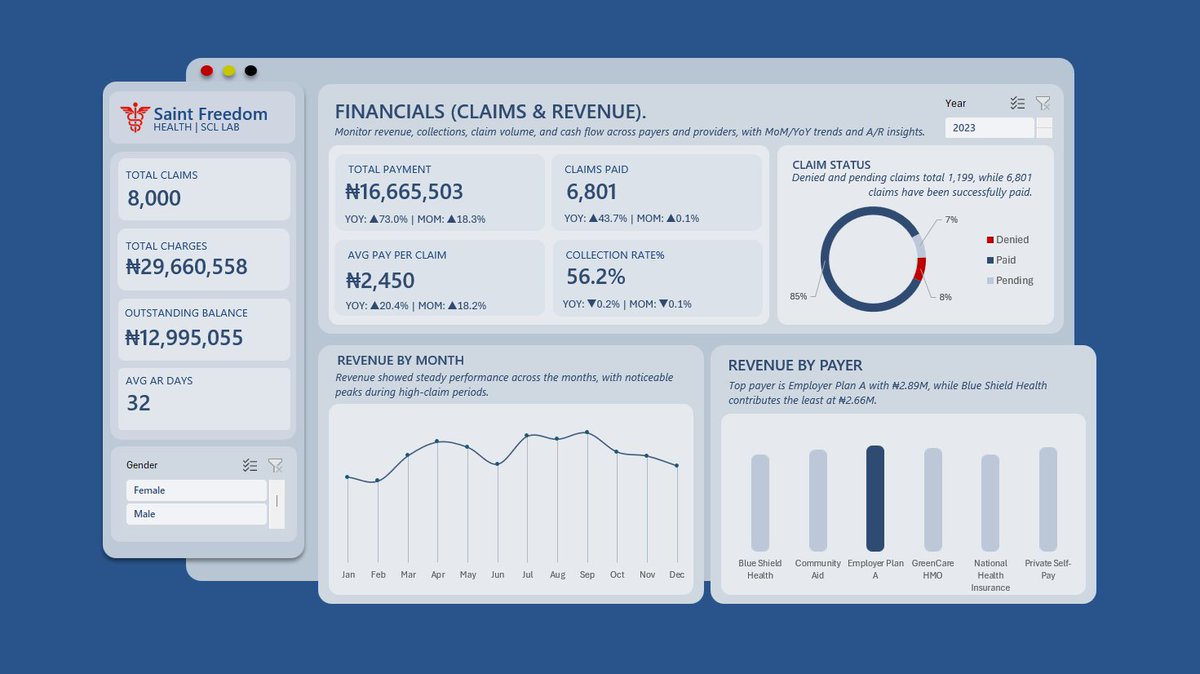
Kunle from Finance would walk into the boardroom, staring at his spreadsheets. All he saw was the ₦12.9M outstanding balance and a collection rate that was sitting at 56.2%. To him, the hospital was a "leaky bucket" of revenue. "We need to tighten the belt," he’d say. "The numbers aren't adding up."
On the other side of the table sat Folashade, the Medical Director. She wasn't looking at the naira; she was looking at the people. She was worried about why 27.3% of their patients were hypertensive and why clinical risk factors were trending upward. To her, "tightening the belt" meant compromising on the care that kept those 2,000 patients alive.
The problem? Kunle didn't see the patients, and Folashade didn't see the payroll. They were two captains steering the same ship in different directions.
That’s where the data comes in.
I built this two-page dashboard to be the bridge between Kunle’s ledger and Folashade’s stethoscope.
Page 1 (The Pulse of the Patient): Gives Folashade a 360-degree view of population health, from BMI distributions to real-time vitals trends.
Page 2(The Pulse of the Business): Gives Kunle the clarity he needs on claims, revenue by payer, and AR days. No more guessing where the money is stuck.
When we put these two pages together, the conversation changed.
Kunle realized that healthy, well-managed patients lead to better insurance claims. Folashade realized that a financially stable hospital is the only way to afford the best equipment.
At Saint Freedom Health, we’ve stopped speaking two different languages. We’ve started speaking the language of Data.
Because at the end of the day, you can’t have clinical excellence without financial sustainability, and you can’t have either without a clear view of the truth.
To my Health Professionals & Data Community:
I’m curious to hear your thoughts.
Does this capture the reality of the "Finance vs. Clinical" tension in healthcare?
How did I do with the metrics? Do these KPIs give you enough direction to make a decision?
I’d love your feedback in the comments! 👇
Tool: @msexcel
#DataAnalytics #HealthIT #HealthcareManagement #BusinessIntelligence #DataStorytelling #Excel

53
65
311
22,054
Jan 19
As a tech professional, one mistake to avoid is overlearning. Taking in too much information at once can lead to confusion, mental overload, and reduced ability to apply what you’ve learned effectively.
1
11
Jan 17
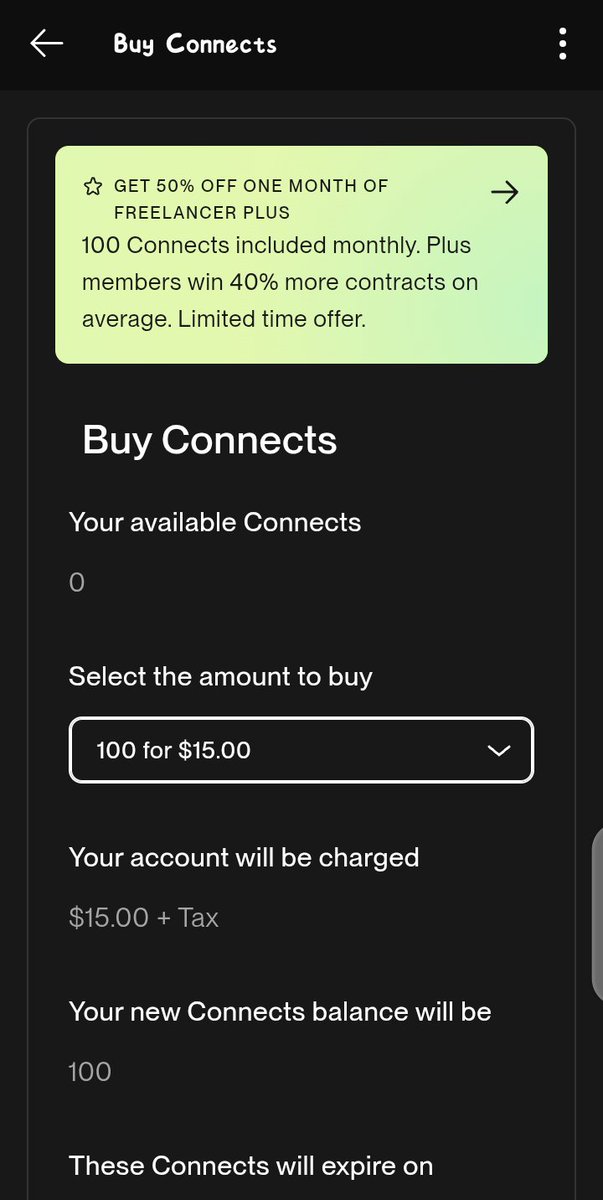
I was there when he had nothing
This is the time now 😺
Invest in me with connect 😀 lol
#bbvipks4 #upwork #DataAnalytics #powebi #davido #iam_daniell
3
411
Ayo Mi De retweeted

Jan 14
JOB ALERTS ARE BACK!!🚨
I used to do this regularly, until life got busy🫠
Anyways, tomorrow I’ll be posting 15 job openings across Engineering, Design, Analytics, Product & Content Writing🚀
📍: EMEA
✈️ : Visa sponsorship available
Turn on post notifications!🔔

26
68
927
45,804
Ayo Mi De retweeted

Jan 13
🚨EXPOSED: 1000 AI Excel Templates.
Worth $2.7K per build — now FREE for the first 9000.
🔴 Inside the file:😃👇
→ AI copywriters
→ Marketing Social Media Reports
→ Business Finance Accounting
→ Project Management
→ HR & Payroll Employee Tracking
→ Data Analysis Dashboards
→ Inventory Stock Management
→ Budgeting Personal Finance
→ Sales Tracking CRM Sheets
→ Academic Research Templates
→ Productivity To‑Do Lists
→ Performance Tracking
→ Financial Modeling
→ Time Management
→ Customer Feedback
→ Expense Tracking Tax Preparation
→ Logistics Management
→ Event Planning Guest Lists
→ Education Student Gradebooks
Fill it up & GET:
- Comment "File"
- Like & Retweet
- Follow me @CodebyNihan get DM Fast.
370
203
435
22,191
Ayo Mi De retweeted

Learn a tech skill this year
Learn a tech skill this year
Learn a tech skill this year
Learn a tech skill this year
Learn a tech skill this year
Start small
Start slow
But make sure you start.
94
103
792
635,766
Jan 7
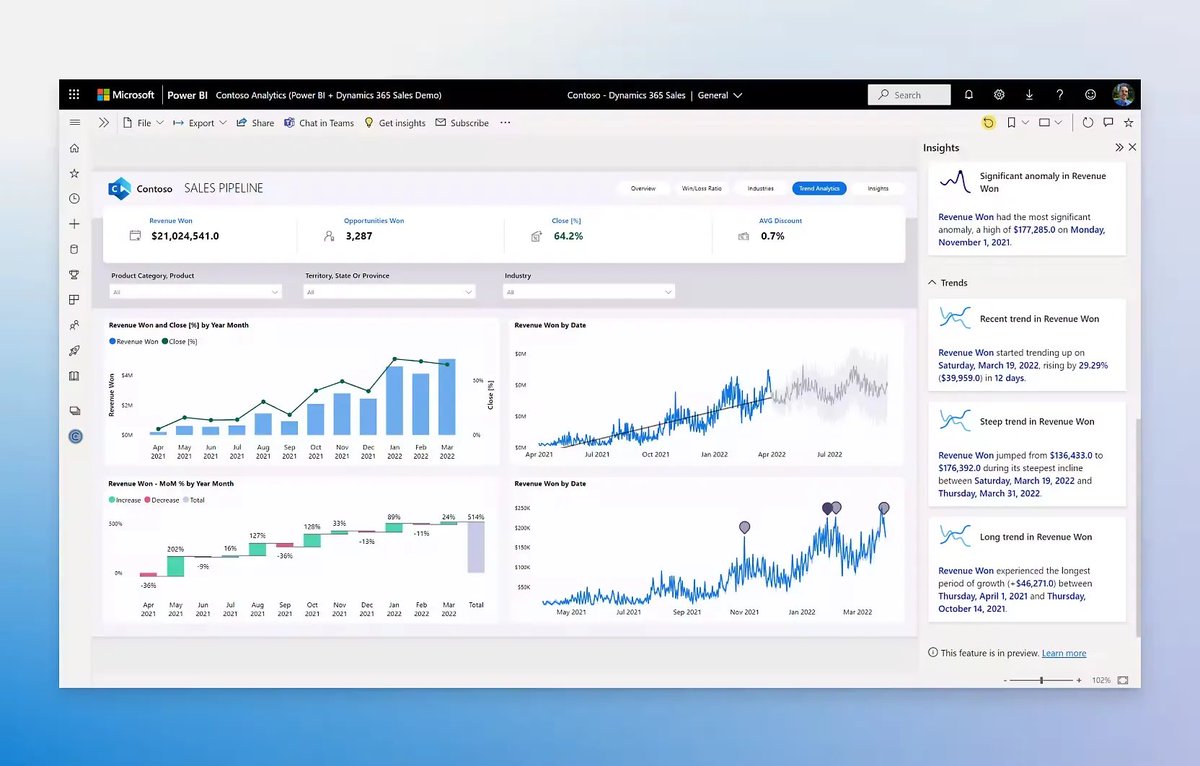
For a while, I struggled to use Map charts and some key visuals in Power BI.
Every time I tried, a tenant permission request kept blocking access right when I needed those visuals most.
2
1
24
Jan 7
After digging deeper into Power BI Service tenant settings, I finally identified the restriction, updated the configuration, and fixed it.
Now map visuals work seamlessly, and my reports are more complete, accurate, and impactful.
1
1
15
Jan 7
A reminder that in data analytics, challenges aren’t just about formulas or visuals — sometimes it’s about understanding the platform behind the tool.
Problem solved. On to better insights. 📊✅
13
Ayo Mi De retweeted

Run 100B parameter AI models on your basic laptop.
No more expensive cloud GPUs.
No more massive power bills.
Here’s the new play 👇
→ 82% lower energy consumption
→ Run 100B models on CPU
→ 6x faster inference speeds
→ Total data privacy locally
→ 90% lower hardware costs
Automate your business operations.
Download the update and start saving now.
Want the full guide? DM me.
5
2
7
2,111
Jan 6
I’m a Data & Business Analyst with an Accounting background, trained to bridge the gap between raw data and business decision-making.
With hands-on skills in SQL, Power BI, Python, and Excel, I help businesses
2
1
35
Jan 6
SQL (Data querying, joins, data cleaning, analysis)
Power BI (Interactive dashboards, DAX basics, reporting)
Python (Data analysis, automation, pandas, numpy)
Microsoft Excel (Advanced formulas, pivot tables, data modeling)Business & Financial Analysis
Accounting&financial data
1
38