
Joined January 2022
- Tweets 2,681
- Following 181
- Followers 1,476
- Likes 5,743
1,562 Photos and videos
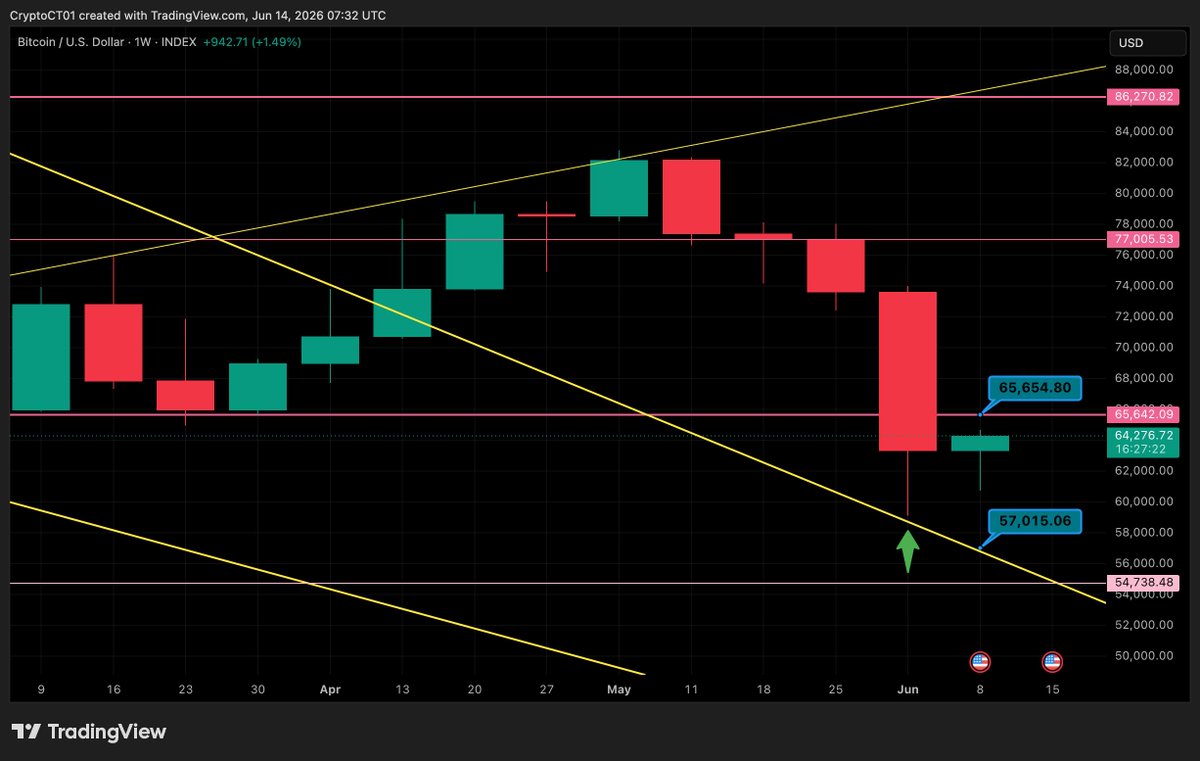


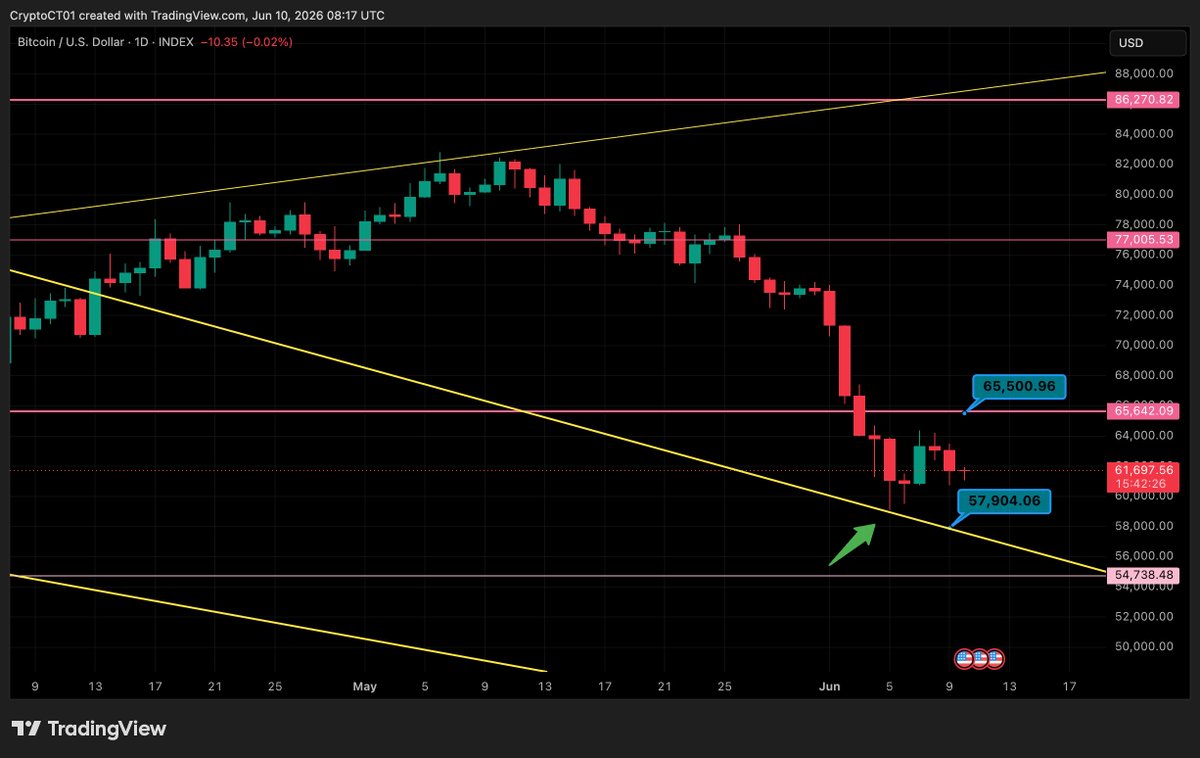


As we approach the weekly candle close later today, it’s a good time to provide an update on Bitcoin’s current position from a weekly candle perspective. 📈 After testing the key support level of $59,000, BTC has managed to hold above this level and rise towards the resistance level, which is currently at $65,500. 💪
From what I’m observing, the weekly candle should hopefully close green, giving us momentum in the new week to push and break above resistance. 🌱 If we succeed in breaking resistance, there are targets above in the chart provided. Overall, next week we should hopefully see a push above, but please remember that it may still be extremely volatile, and prices will fluctuate to liquidate traders beforehand. 🌪️
The worst-case scenario is if we fail to break resistance, we could make our way back down towards the support trend line we set previously. 📉 But what do you think? Do you believe we can push and break out of this resistance level and aim higher next week? Let me know your thoughts! 🤔💬 bitcoin:native
Jun 10

In my previous post, we observed that Bitcoin experienced a strong rebound from our support line. Currently, it is facing challenges in breaking and maintaining a position above $64,000. A significant area of concern lies above this level, specifically at $65,500, which serves as major resistance. 📈
If we manage to hold these current levels, there is a possibility of attempting another breakout later this week. However, should we encounter difficulties, there is a risk of retracing back towards the support trend line, which is now approximately $58,000, possibly slightly lower. 📉
I am curious to hear your thoughts on the market’s potential trajectory. How do you foresee the situation unfolding? 🤔 bitcoin:native
1
34

Jun 12
If you have extra unused AI usage (from #ChatGPT, #Claude, #Grok, or your own GPUs), you can rent it out and make money from it. 💰🤖
If you run out of your monthly AI limit and need more, you can buy tokens much cheaper through this system instead of paying full price. 💸🔄
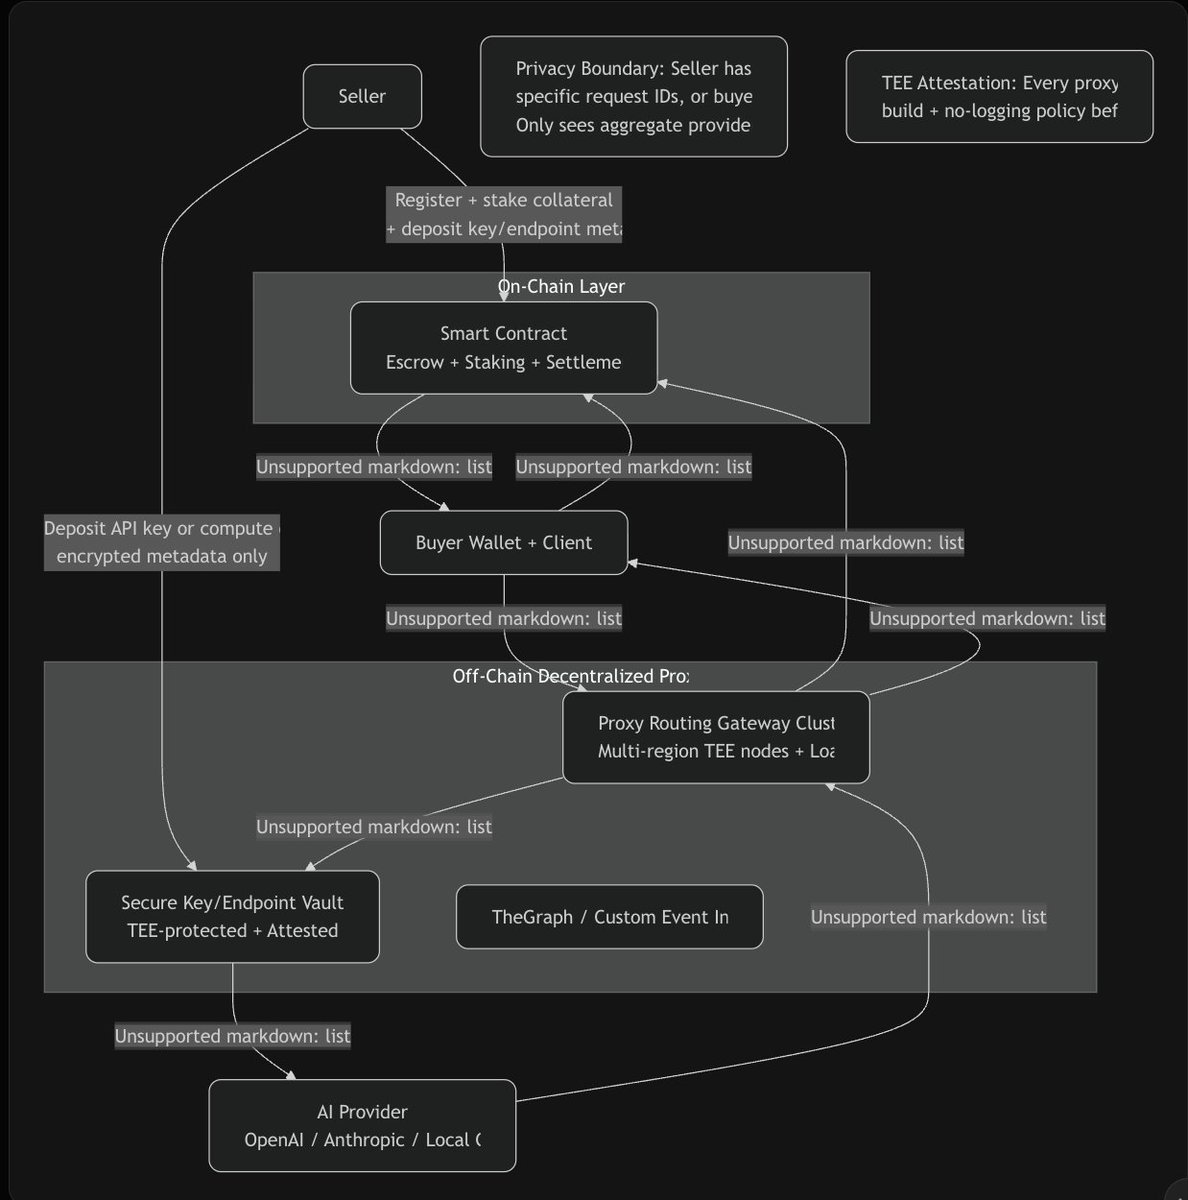
Sellers never see what you’re asking. Everything is private and handled through smart contracts. 🔐🤝
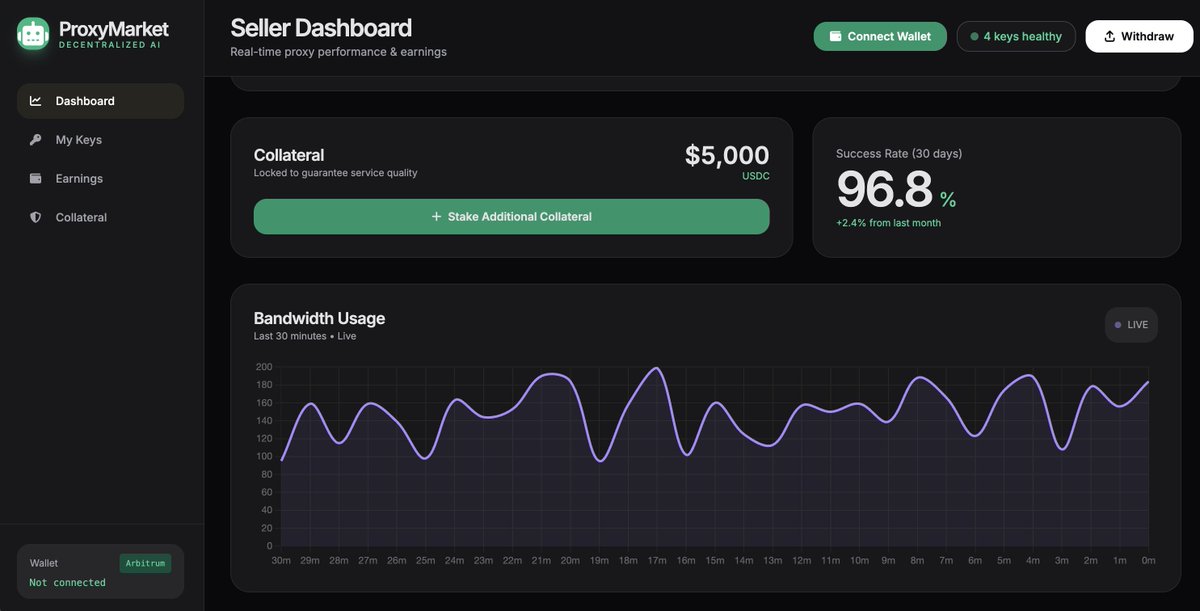
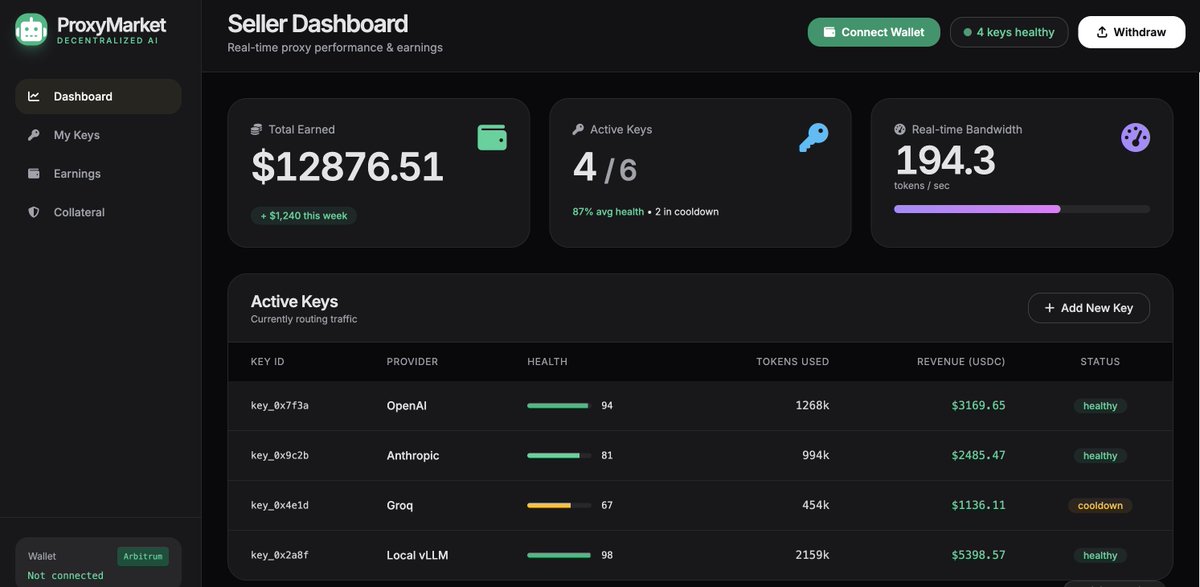
We already built working dashboards and the smart contracts. 📊
Repo: github.com/CryptoCT01/decent…
DMs open. 📩
#DePIN #DecentralizedAI
Jun 12
Tired of getting rate-limited and overpaying for AI inference?
We’re building a Decentralized AI Proxy Marketplace with real privacy, on-chain trust, and significantly lower costs.
Here’s what we’ve already built ↓
1
3
139
Jun 12
1
35
Jun 12
Tired of getting rate-limited and overpaying for AI inference?
We’re building a Decentralized AI Proxy Marketplace with real privacy, on-chain trust, and significantly lower costs.
Here’s what we’ve already built ↓
1
5
242
Jun 12
If you’re building in DePIN, decentralized inference, or AI infrastructure — let’s talk.
DMs open.
#DePIN #DecentralizedAI #AI #Bittensor #Akash
1
3
58
Jun 12
If you’re building in DePIN, decentralized inference, or AI infrastructure — let’s talk.
DMs open.
@bittensor_ @akashnet @ionet @NousResearch @rendernetwork
#DePIN #DecentralizedAI #AI #Bittensor #Akash
4
61
Jun 10
In my previous post, we observed that Bitcoin experienced a strong rebound from our support line. Currently, it is facing challenges in breaking and maintaining a position above $64,000. A significant area of concern lies above this level, specifically at $65,500, which serves as major resistance. 📈
If we manage to hold these current levels, there is a possibility of attempting another breakout later this week. However, should we encounter difficulties, there is a risk of retracing back towards the support trend line, which is now approximately $58,000, possibly slightly lower. 📉
I am curious to hear your thoughts on the market’s potential trajectory. How do you foresee the situation unfolding? 🤔 bitcoin:native
Jun 5
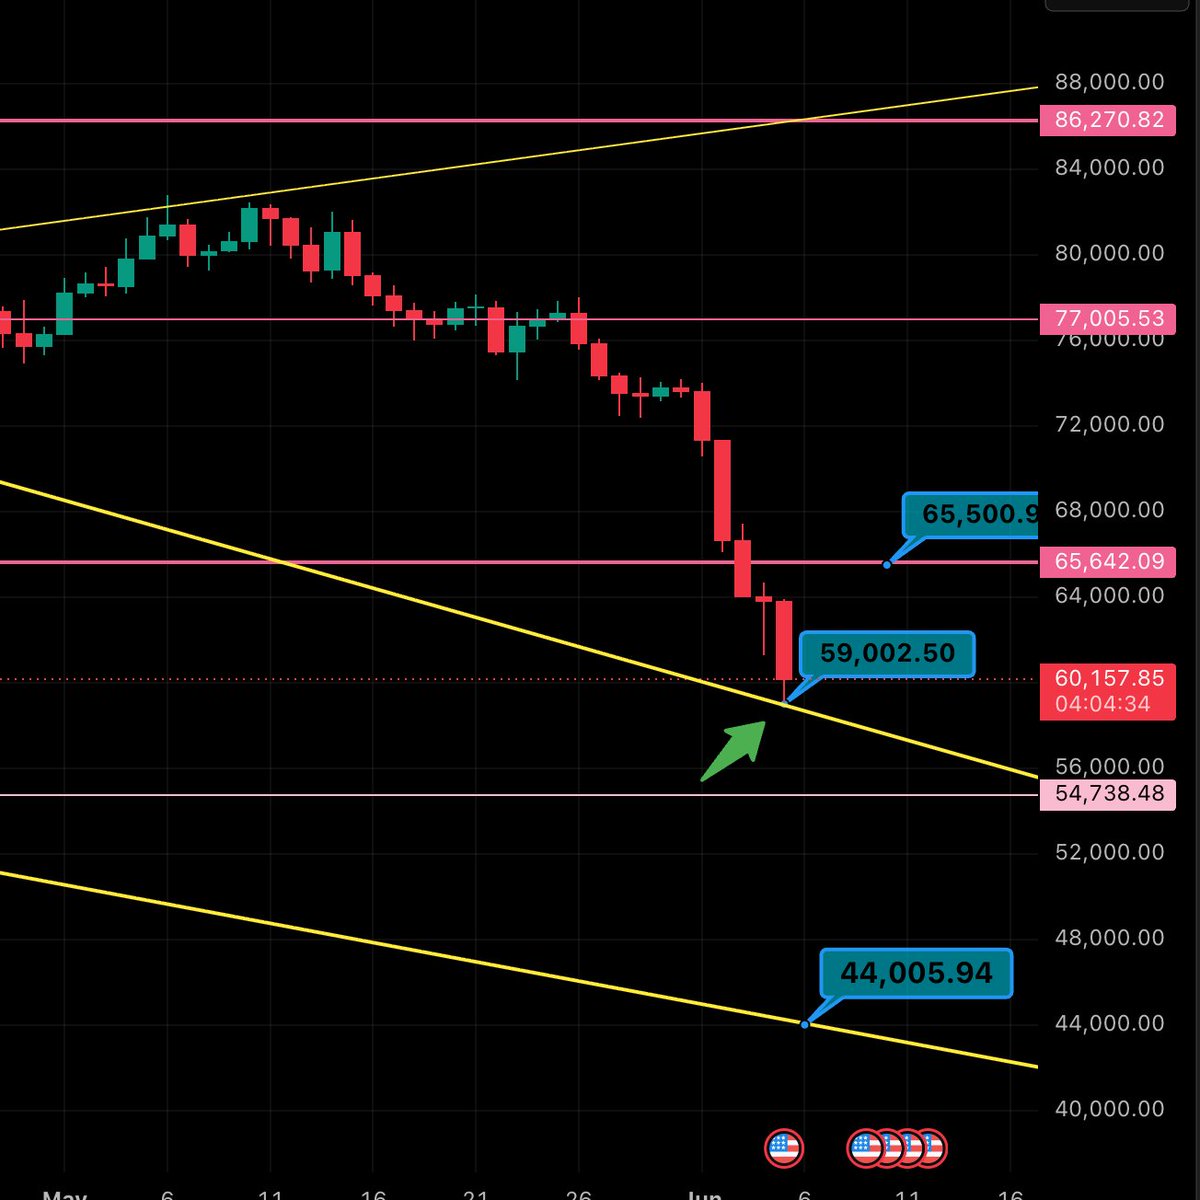
📉 Bitcoin Weekly Candle Watch: Holding $59K or Heading to $54.8K/$44K?"
As we approach the end of the week, I would like to provide an update on my previous post regarding Bitcoin (BTC) from a few days ago. As anticipated, Bitcoin has declined to approximately $59,000. It will be particularly interesting to observe how today’s daily candle closes, as well as the crucial weekly candle close in two days.
Currently, we are trading just above the support trend line, which is positioned at $59,000. If this level is not maintained from both the daily and weekly perspectives, there is a possibility that the price may continue to decrease. I have prepared price targets in anticipation of such a scenario. The first target is around $54,800, and if this level is not held, the next critical point for BTC is $44,000.
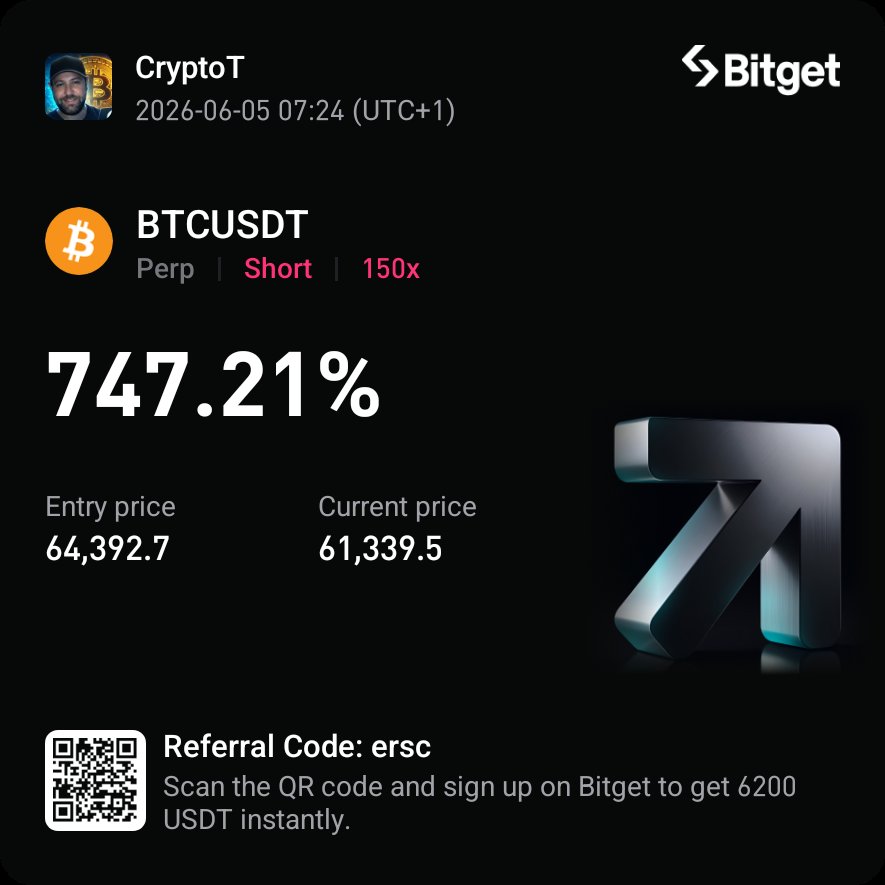
I successfully entered a long position just above the $59,000 mark, which is currently up over 240% and continues to grow. 📈 What are your thoughts? Do you believe we can maintain this key support level and push back towards resistance, or are we more likely to test the lower levels indicated in the chart? I would appreciate your insights. 💬 $BTC
1
1
83
Jun 5
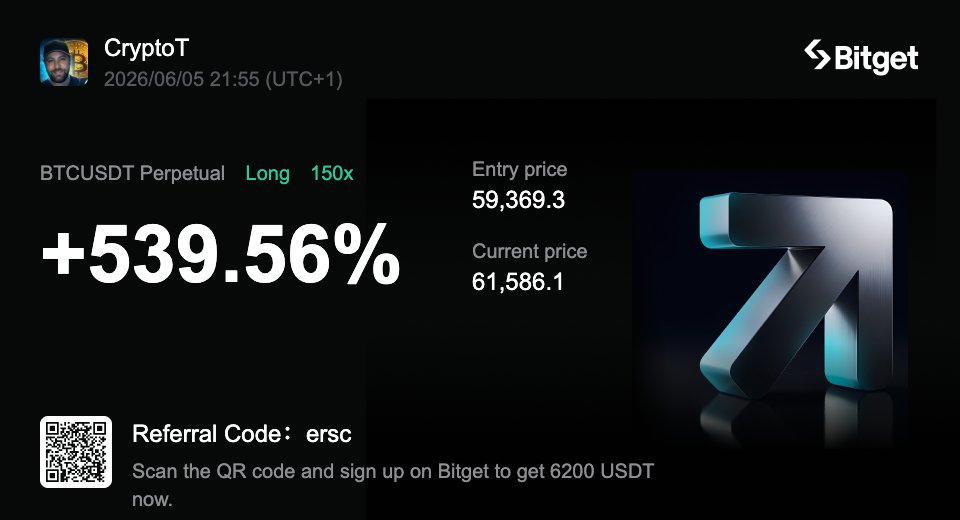
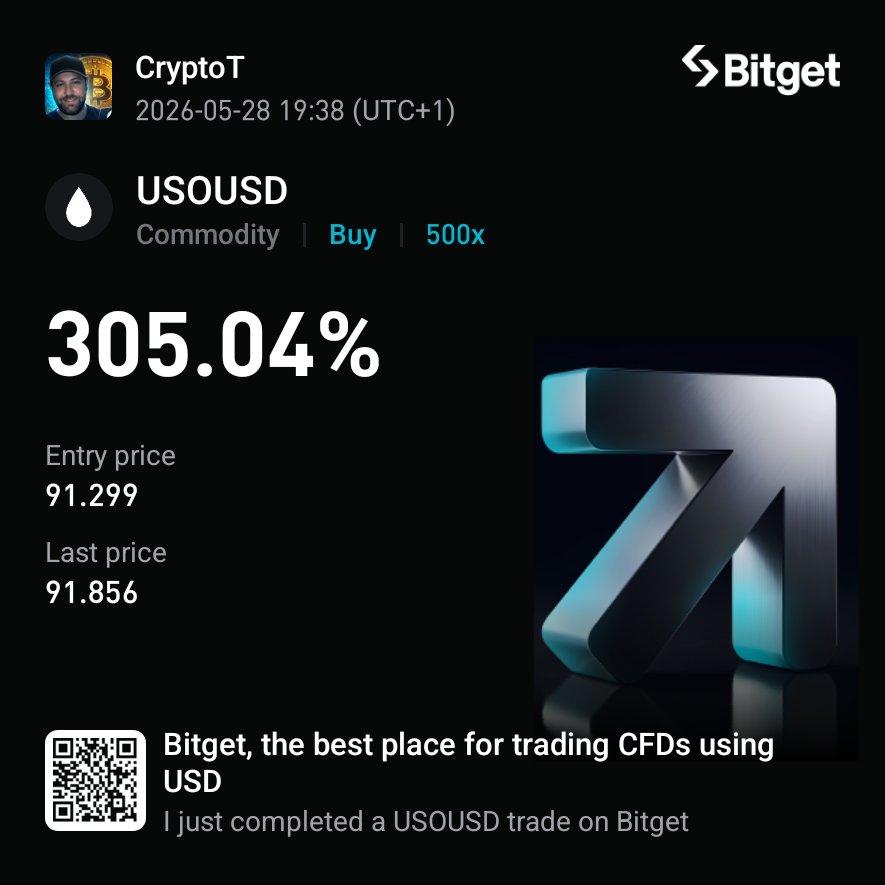
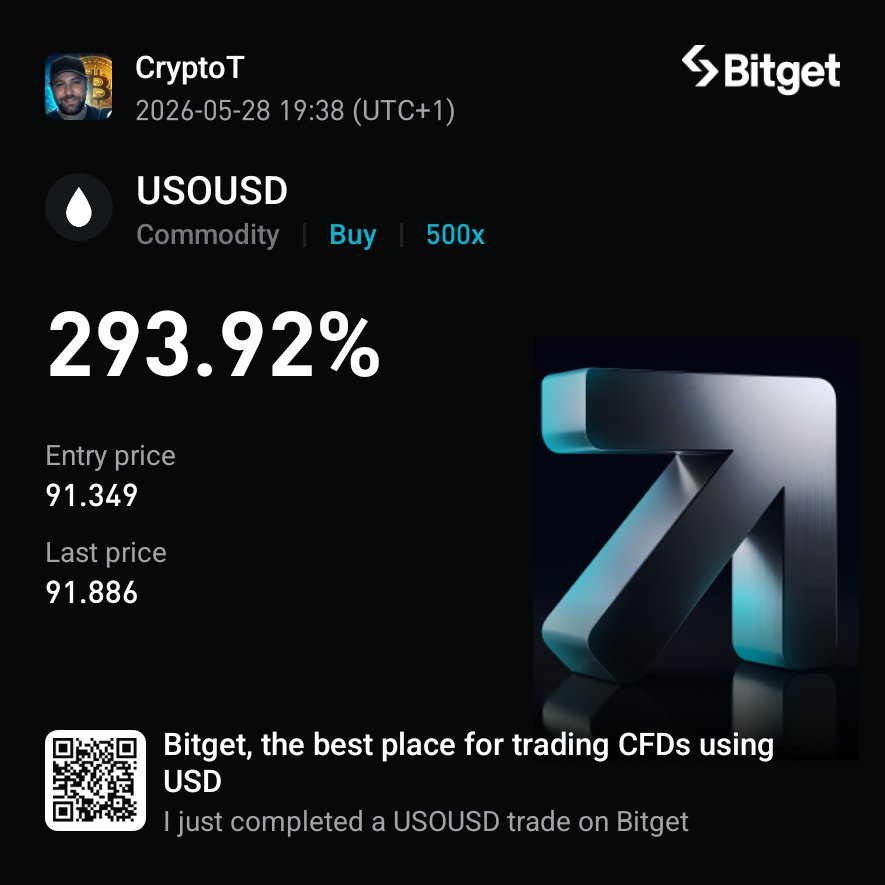
💰 From 0 to 539% in less than an hour 💰
bitcoin:native
join here: partner.bitget.com/bg/NEWAXP
Jun 5
📉 Bitcoin Weekly Candle Watch: Holding $59K or Heading to $54.8K/$44K?"
As we approach the end of the week, I would like to provide an update on my previous post regarding Bitcoin (BTC) from a few days ago. As anticipated, Bitcoin has declined to approximately $59,000. It will be particularly interesting to observe how today’s daily candle closes, as well as the crucial weekly candle close in two days.
Currently, we are trading just above the support trend line, which is positioned at $59,000. If this level is not maintained from both the daily and weekly perspectives, there is a possibility that the price may continue to decrease. I have prepared price targets in anticipation of such a scenario. The first target is around $54,800, and if this level is not held, the next critical point for BTC is $44,000.
I successfully entered a long position just above the $59,000 mark, which is currently up over 240% and continues to grow. 📈 What are your thoughts? Do you believe we can maintain this key support level and push back towards resistance, or are we more likely to test the lower levels indicated in the chart? I would appreciate your insights. 💬 $BTC
1
55
Jun 5
📉 Bitcoin Weekly Candle Watch: Holding $59K or Heading to $54.8K/$44K?"
As we approach the end of the week, I would like to provide an update on my previous post regarding Bitcoin (BTC) from a few days ago. As anticipated, Bitcoin has declined to approximately $59,000. It will be particularly interesting to observe how today’s daily candle closes, as well as the crucial weekly candle close in two days.
Currently, we are trading just above the support trend line, which is positioned at $59,000. If this level is not maintained from both the daily and weekly perspectives, there is a possibility that the price may continue to decrease. I have prepared price targets in anticipation of such a scenario. The first target is around $54,800, and if this level is not held, the next critical point for BTC is $44,000.
I successfully entered a long position just above the $59,000 mark, which is currently up over 240% and continues to grow. 📈 What are your thoughts? Do you believe we can maintain this key support level and push back towards resistance, or are we more likely to test the lower levels indicated in the chart? I would appreciate your insights. 💬 $BTC
Jun 3
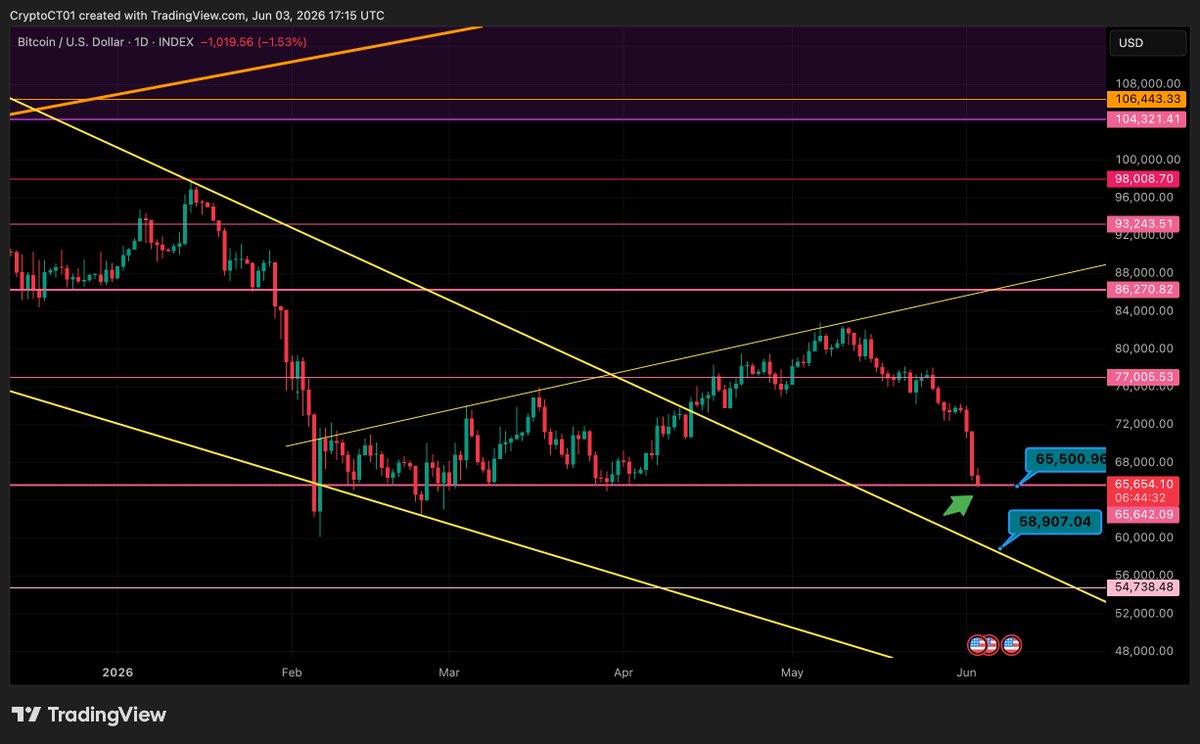
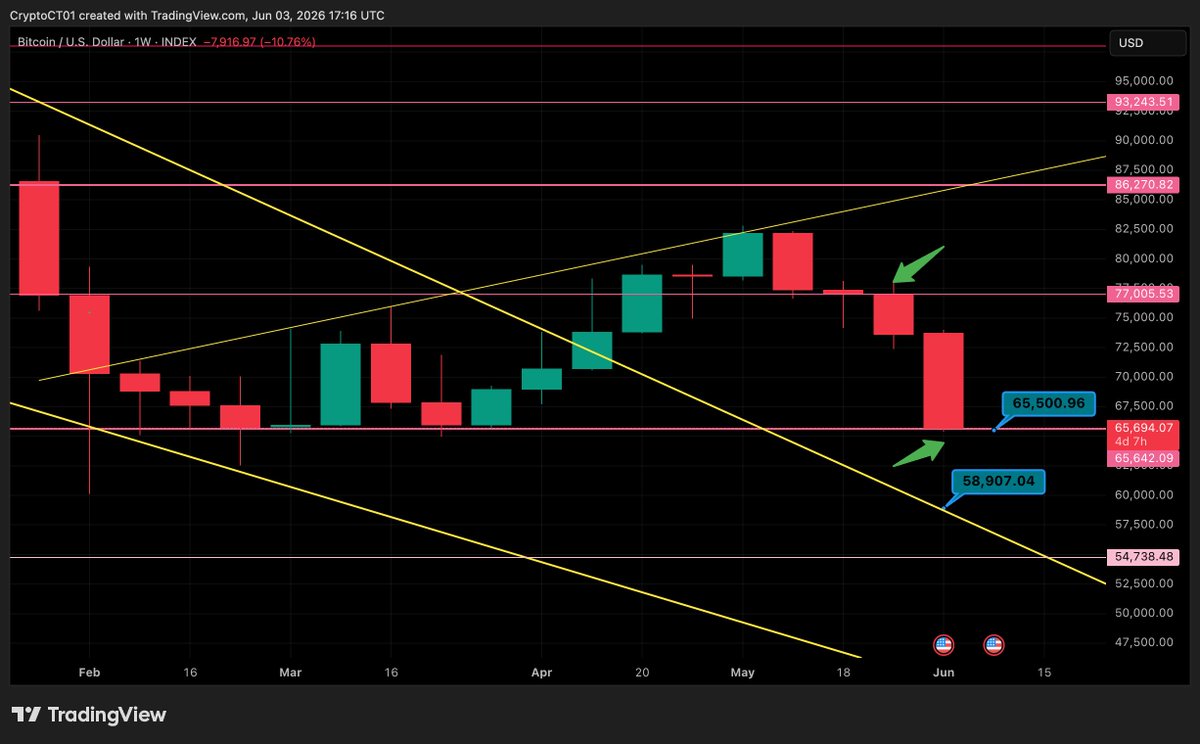
Bitcoin June Alert: Testing $65,500 Support – Rebound or Drop to $59K? 📉🚀
The cryptocurrency market has entered June with significant volatility, making it an opportune time to provide an update on Bitcoin (BTC) and its current support and resistance levels. 📈
Examining $BTC from the daily candle timeframe, it is crucial to note that since Bitcoin fell below $77,000, the monthly candle close for May also closed unfavourably below this threshold. This development is concerning. 📉
Currently, the price is testing a key support level at $65,500. If a higher timeframe candle close occurs above this level, there is optimism that the price will rebound from this point. 🚀
However, if the price closes below this support level in a higher timeframe candle, the next level of interest is approximately $59,000. Detailed targets and price levels can be observed in the accompanying charts. 📊
2
174
Jun 4
$BTC 📉
Jun 3
Bitcoin June Alert: Testing $65,500 Support – Rebound or Drop to $59K? 📉🚀
The cryptocurrency market has entered June with significant volatility, making it an opportune time to provide an update on Bitcoin (BTC) and its current support and resistance levels. 📈
Examining $BTC from the daily candle timeframe, it is crucial to note that since Bitcoin fell below $77,000, the monthly candle close for May also closed unfavourably below this threshold. This development is concerning. 📉
Currently, the price is testing a key support level at $65,500. If a higher timeframe candle close occurs above this level, there is optimism that the price will rebound from this point. 🚀
However, if the price closes below this support level in a higher timeframe candle, the next level of interest is approximately $59,000. Detailed targets and price levels can be observed in the accompanying charts. 📊
3
93
Jun 3
Bitcoin June Alert: Testing $65,500 Support – Rebound or Drop to $59K? 📉🚀
The cryptocurrency market has entered June with significant volatility, making it an opportune time to provide an update on Bitcoin (BTC) and its current support and resistance levels. 📈
Examining $BTC from the daily candle timeframe, it is crucial to note that since Bitcoin fell below $77,000, the monthly candle close for May also closed unfavourably below this threshold. This development is concerning. 📉
Currently, the price is testing a key support level at $65,500. If a higher timeframe candle close occurs above this level, there is optimism that the price will rebound from this point. 🚀
However, if the price closes below this support level in a higher timeframe candle, the next level of interest is approximately $59,000. Detailed targets and price levels can be observed in the accompanying charts. 📊
2
219
May 29
As Friday comes to fruition, we see the markets have been extremely volatile this last week, especially for crude oil. 📈
I jumped into a quick long position this morning with a leverage position currently up over 63%. On my $CL chart, it is currently just trading below one level of resistance at $89.4. 💰
I do believe if we can have a strong four-hour candle close above this level, then I believe we can hit the resistance trend line shown in the chart provided around $91. 📊
Also, if we are unable to break above this current level and we keep failing to break resistance, then we are most likely going to be heading to test support levels. 📉
What do you think? Let me know your thoughts! 🤔 $uso #oil


1
147