
Decoding Markets From The Shadows 👁️
Joined September 2019
- Tweets 6,996
- Following 24
- Followers 7,373
- Likes 12,436
1,533 Photos and videos


Pinned Tweet

30 Jun 2025
EDUCATIONAL POSTS 🧵
Explore my curated collection of educational content designed to strengthen your technical analysis skills and psychological behaviour.
Whether you're refining your strategy or starting from scratch, this resource hub will accelerate your learning curve, helping you build long-term profitability.
Dedicate a few months to gain a profitable edge for many years to come. Master the Markets with Precision 🎯.
▫️ SMC Dictionary: x.com/CryptoChase02/status/1…
▫️ Psychological Thinking: x.com/CryptoChase02/status/1…
▫️ Risk Management: x.com/CryptoChase02/status/1…
▫️ Volume:
x.com/CryptoChase02/status/1…
▫️ Market Structure:
x.com/CryptoChase02/status/1…
x.com/CryptoChase02/status/1… (Candle confirmation)
▫️ Refining key levels:
x.com/CryptoChase02/status/1…
▫️ Time Frames:
x.com/CryptoChase02/status/1…
x.com/CryptoChase02/status/1… (Personal preference)
▫️ Fibonacci Retracement:
x.com/CryptoChase02/status/1…
x.com/CryptoChase02/status/1… (Negative Fibonacci retracement)
▫️ Ranges:
x.com/CryptoChase02/status/1…
▫️ Fair Value Gaps:
x.com/CryptoChase02/status/1…
▫️ Order Blocks:
x.com/CryptoChase02/status/1…
▫️ Supply & Demand:
x.com/CryptoChase02/status/1…
▫️ Discount & Premium:
x.com/CryptoChase02/status/1…
▫️ Entering Trades:
x.com/CryptoChase02/status/1…
▫️ Stop Loss:
x.com/CryptoChase02/status/1…
▫️ Taking Profit:
x.com/CryptoChase02/status/1…
▫️ Confluences: x.com/CryptoChase02/status/1…
▫️ Volatility:
x.com/CryptoChase02/status/1…
▫️ Journal Tracking:
x.com/CryptoChase02/status/1…
▫️ Invalidation: x.com/CryptoChase02/status/1…
I’m truly grateful for every follow, repost, and like. The time and effort I’ve put into this mean a lot to me, and your support makes it all worthwhile. Thank you!
All work is referenced to @Moneytaur_ 👁️🧩
(Thank you very much MT 🫶)
10 Jun 2025

⚠️ INVALIDATION ⚠️
Invalidating setups as early as possible can take you from an average trader to a great trader! Invalidation protects your capital and improves your discipline. When a trade no longer meets your criteria and you exit your position, you will minimise losses and prevent unnecessary drawdowns in your portfolio. This helps you preserve your trading or investing portfolio and stay in the game longer.
Once a setup breaks its structure or your conditions, holding onto the trade can lead to impulsive decisions driven by greed or fear. By invalidating early, you can remain objective and adhere to your trading plan, thereby maintaining the integrity of your strategy. Letting a broken setup run means you are trading without a consistent edge. Respecting invalidation points, regardless of the result, keeps your system reliable and measurable.
Closing a position early frees up capital, allowing you to redirect your funds to higher-probability opportunities elsewhere in the market that align with your strategy criteria instead of being stuck in a low-probability trade. Making this a habit will also build confidence in your decision-making. Each time you act decisively based on your chosen rules, you reinforce trust in your process and become a more disciplined, efficient trader.
It is important to keep an 👁️ on candle closes instead of wicks because you will end up invalidating a lot of valid plays otherwise. Plays can be invalidated last minute or adjusted [increasing/decreasing risk], so it's important to keep a close watch on the next candle closure on the timeframe you found the key level and Bitcoin, as it is the leader of the market.
MoneyTaur - "Regularly monitoring Bitcoin is a must when playing tight stops"
If Bitcoin is dumping, you wouldn't want to open a scalp long position on a low-volume coin.
If Bitcoin is pumping, you wouldn't want to open a scalp short position on a low-volume coin.
If Bitcoin is dumping [downtrend], you invalidate long positions and look for retracements into 🗝️ levels before bearish continuation.
If Bitcoin is pumping [uptrend], you invalidate short positions and look for pullbacks into 🗝️ levels before bullish continuation.
The Bitcoin example is down in the comments below 👇
This can be justified depending on your skill set.
MoneyTaur - "Don't long/short anything on LTF/MTF confirmations if Bitcoin is breaking past significant key levels/ranges"
MARKET STRUCTURE
A setup can be invalidated if there is no change in market structure. If there is no close above a PSH or below a PSL, this is an early signal to invalidate the setup. This is crucial as we look for high-probability setups only. Without a confirmed close, we have to assume the current trend will not continue.
If there is a confirmed break of structure and PA doesn't pull back and goes straight towards ATHs and confirms a new trading range, then you can invalidate that setup [For that specific moment]. The setup could still be valid in the future, depending on how powerful the key level is 👁️.
When you are missing confluence on a setup, it means you should approach the setup as a low-probability trade. The fewer confluences you have, the bigger the reasoning to invalidate the setup. You either risk less or completely ignore the trade and find opportunities elsewhere in the market.
There are plenty of opportunities in every market. Don't be so fixated on a setup if you deem the probability of success to be low.
The Litcoin example showing how to identify a MSS is down in the comments below 👇
You can read about market structure in this post 👉 x.com/CryptoChase02/status/1…
FIBONACCI RETRACEMENT
Occasionally, a key level will align with or near a fib level (0.5, 0.618-0.705 and 0.786). If the key level is not near a fib level, then proceed with caution. Usually, if I can't find a [untested] fib level with my key level, I would invalidate the play and choose to seek another opportunity or regularly monitor Bitcoin or other majors alongside my chosen trade to time the position. If the timing isn't somewhat simultaneous, I will invalidate the setup.
It is important to search for key levels on Bitcoin, Ethereum and other major charts as they'll act as strong confluences and will turn your setup from a low-probability trade into a high-probability trade.
You can read about Fibonacci retracement in this post 👉 x.com/CryptoChase02/status/1…
DISCOUNT & PREMIUM ZONES
Depending on where your key level lies in the specified range, it will indicate whether the setup should be seen as a high-probability trade or a low-probability trade.
Below the equilibrium is your discount zone where you will look for longs/buys. If market structure is turning bullish with confirmation and we are still in the discount region, you should invalidate any short setups [scalps] unless the setup is seen as an optimal trade.
Above the equilibrium is your premium zone where you will look for shorts/sells. If market structure is turning bearish with confirmation and we are still in the premium region, you should invalidate any long setups [scalps] unless the setup is seen as an optimal trade.
If MS is bearish while entering the discount zone, continue to look for short positions until you see a confirmed MSS.
If MS is bullish while entering the premium zone, continue to look for long positions until you see a confirmed MSS.
Market structure is very important! Until you see a market structure shift, remain with the same perspective on the market.
Trade with the trend, not against it.
You can read about discount & premium zones in this post 👉 x.com/CryptoChase02/status/1…
These are the 3 main things that can help you invalidate a setup before even positioning yourself in a trade. The main purpose for you is to put your capital in high-probability trades to preserve your capital and leave you with more winners than losers.
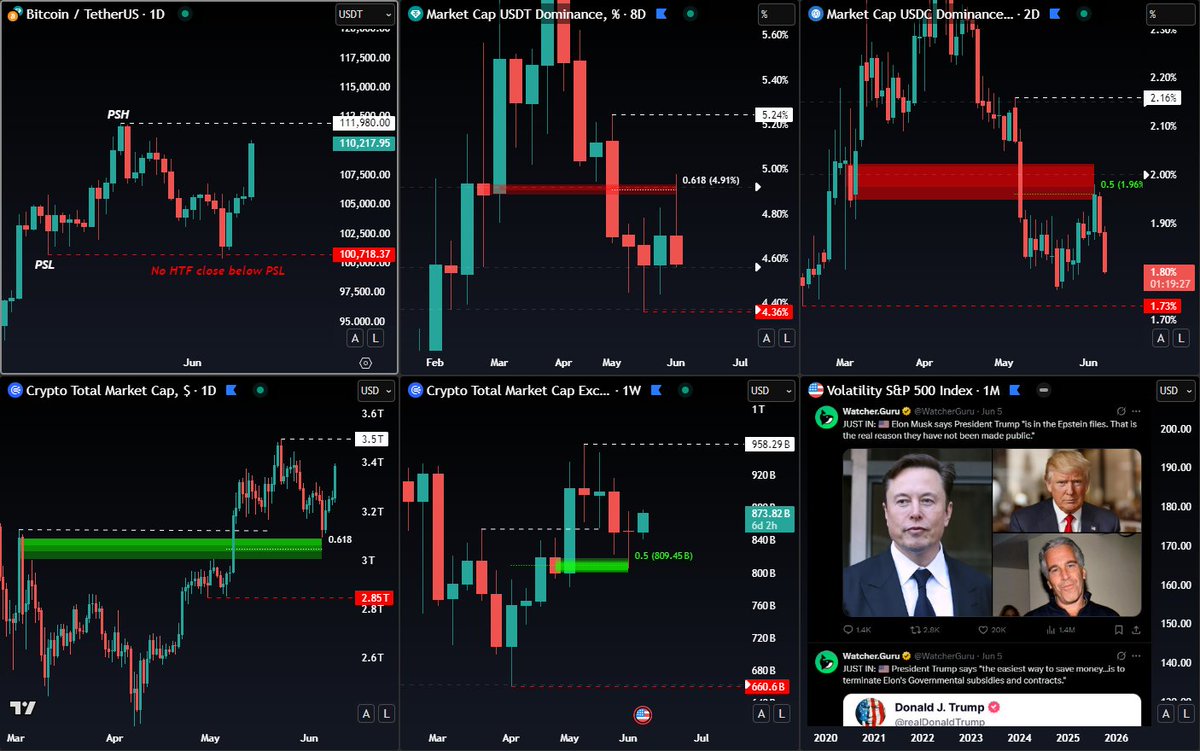
Recent Example across the market [05/06/25]:
In this situation, I remained with a long/buy perspective, invalidated any short setups and long setups that were too far. Keeping in mind that the local bottom occurred in early April, I had the thought that 🐳's will not give retail the pullback that they deeply desire as they currently want to build FOMO [Greed] by enticing late longs/buys.
▫️ Bitcoin failed to close below the PSL
▫️ USDT.D hit and respected its bearish key level
▫️ USDC.D hit and respected its bearish key level
▫️ TOTAL hit and respected its bullish key level
▫️ TOTAL3 hit and respected its bullish key level
▫️ Negative battle simultaneously erupted as these key levels hit between the most influential people in the world
▫️ Michael Taylor is quiet
▫️ Community [Inside & Outside] expecting lower levels to revisit
▫️ Most people are stuck in analysis paralysis
The picture for this example is below 👇
What about when we are already in a position and want to see early signs of invalidation?
Longs can be invalidated when you identify signs of weakness [SOW], and shorts can be invalidated when you see signs of strength [SOS] on the identified timeframe. The lower the timeframe, the earlier you'll see the signal for invalidation.
CANDLE CLOSURES
If you are already in a position, then you need to keep an 👁️ on the next candle close, depending on what TF you found your key levels on. Sometimes your level may have been invalidated before your stop loss was hit, and you need to see these signs as soon as possible. Meaning, if you found the key level on the 1D TF, you need to watch the next daily candle close to see if the candle closed above or below the key level.
This will be your flashing invalidation signal that you should always respect 🚨!
You may have to watch a couple of daily candle closes to see if the level is invalidated. It's not just about the next one, as the level could be invalidated in 2 or 3 days, etc.
When you can refine the key level, you must watch the reaction towards the refined key level. The invalidation signal will be shown earlier if you watch the refined level compared to the HTF key level. For example, you found a key level on the 1D TF, which can be refined down to the 4H TF. Instead of waiting for the next daily candle close [longer wait time], you can now watch the next 4H candle close to see if the refined level will be (in)validated.
This is very important as it will save you from losing a fully risked position. For example, you risked 1%, but you may only lose 0.5% or 0.3% risk by manually closing the position before your SL is hit.
Another version of this is to watch the equilibrium of your key level [0.5 Fib level of the identified OB]. If the candle closes below/above the equilibrium on the respective TF, this can be a SOW/SOS as the reaction towards the key level is weak.
This doesn't always mean you should always sell because the level is technically still valid, and there may also be external reasoning, but it's important to watch the reaction, as it will tell you if the key level is strong or not.
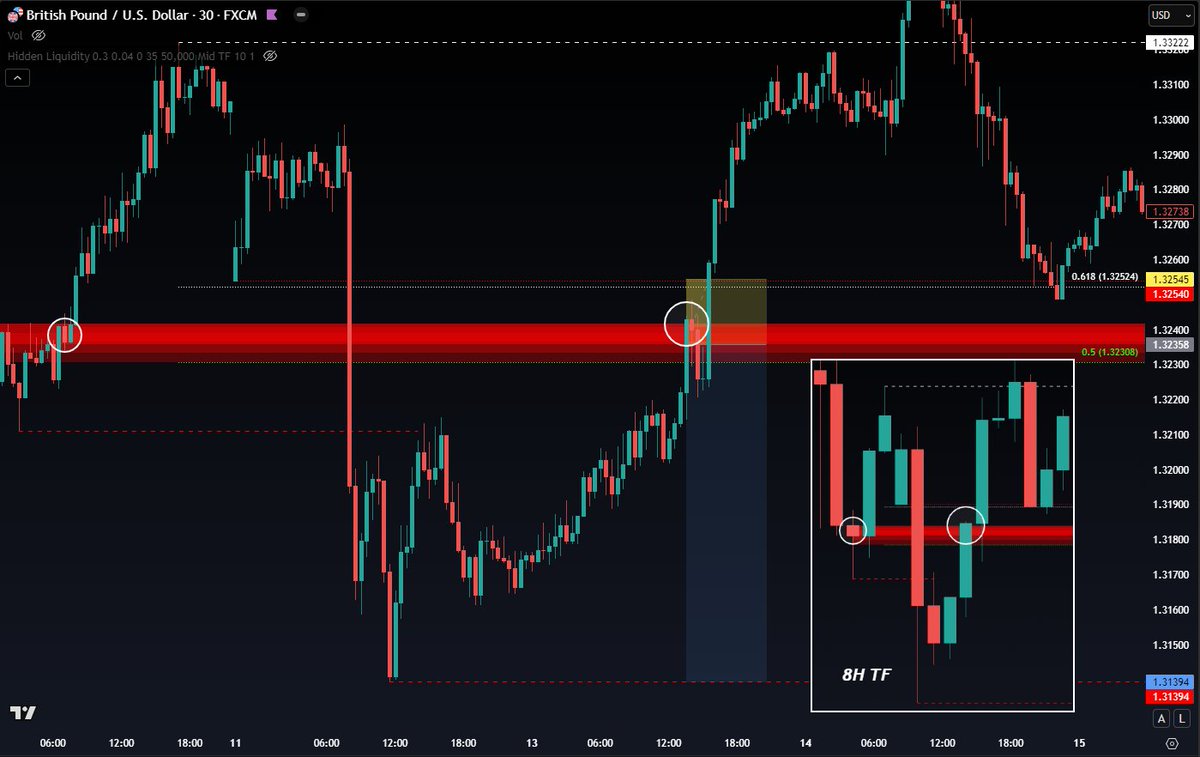
GBPUSD Example [13/05/25]:
Here we have a 8H BB 0.5 Fib level and a confirmed MTF BOS. The key level also shows additional BBs on multiple TFs [7H, 6H, 4H and 30m]. As this level can be refined to the LTF, this tells you this level is even more valid and could provide a good R/R, but in this example, the key level was invalidated before my SL was hit.
As the level approached the level, I kept an eye on the next candle close on all TFs to see which one was earliest. On the 30m TF, the candle closed above the 30m BB, and on the 8H TF, the candle closed above the 8H BB too [Both candle closes occurred at 14:00 GMT]. This is an early sign that the level has been invalidated.
The next 7H and 6H candle closes occurred at a later time, which wouldn't be helpful, as we could've been stopped before the candle closes. This is why it's important to monitor which candle closes is closer in timing.
Now I choose to close my position manually at half the amount I originally risked, or I can wait for PA to sweep the liquidity that was ignored on the 8H/30m TF and close at BE.
This will be unpredictable, as you don't know if PA will sweep the liquidity that it previously ignored. In most cases, it will be better to close your position at a smaller loss than always trying to close your position at BE [Greed].
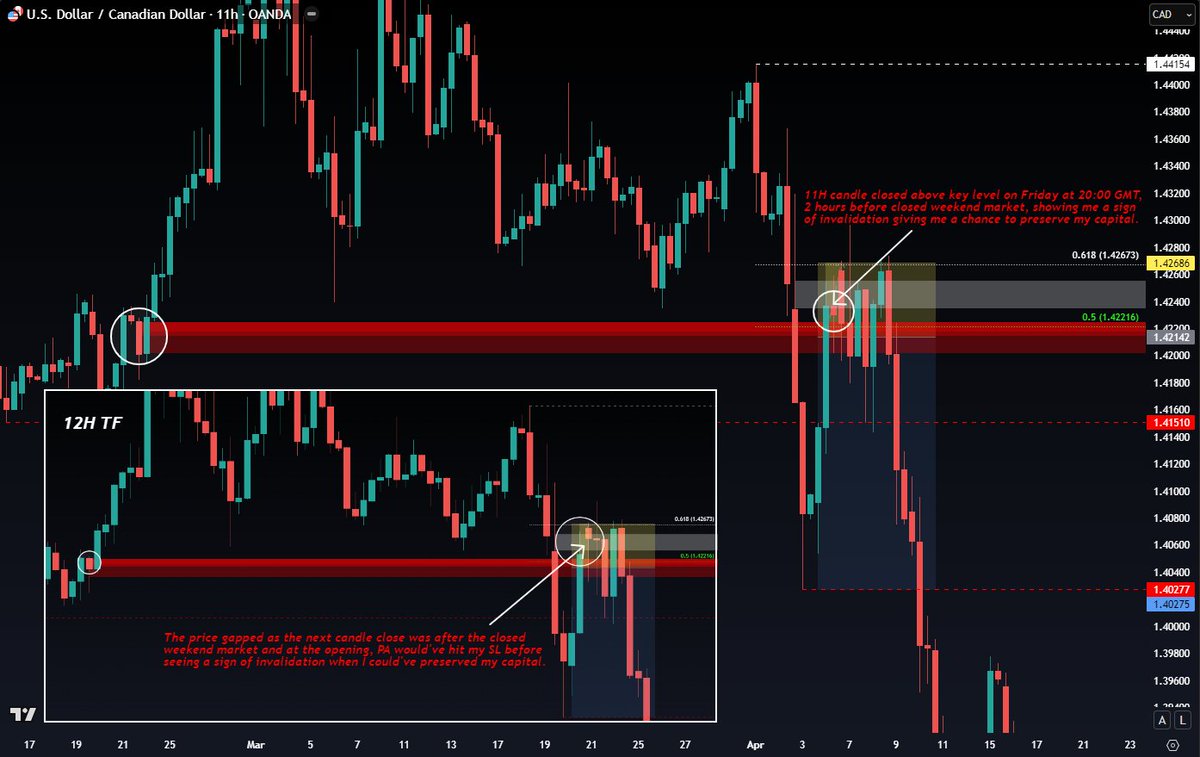
USDCAD Example [04/04/25]:
Here we have a MTF key level shown on 7 different TFs [21/16/15/14/13/12/11H BB] with a 0.5 Fib level and a confirmed MTF BOS. I had my SL covering the 8H OB 0.618 Fib level. With additional TFs around the same key area, you can assume the key level would have some strength and potentially give you a high R/R opportunity.
As this trade occurred on a Friday, you have to be careful because the market will be closed until Sunday 22:00 GMT after Friday 22:00 GMT [This can change due to adjusted time zones].
As the PA approached the key level, I kept an 👁️ on the next candle close on all TFs to see which one was earliest. The key level was invalidated only on 1 TF before my SL was hit out of the 7 TFs. On the 11H TF, the candle closed above the 11H BB, closing on Friday at 20:00 GMT [2 hours before the market closed]. This is an early signal that the level has been invalidated, as all the other TFs' next candle close was on Sunday at 22:00 GMT [The opening of the market].
As I realised 2 hours before the market was about to close on the 11H TF, I decided to close my position manually at half the amount I originally risked. Accepting a 1% loss instead of a 2% loss [Preserving capital].
You cannot adjust your trades during the weekend, so I couldn't close my position manually.
This is why it's crucial to monitor all TFs identified to see which TF gets invalidated first. I would've been stopped at market open [Sunday evening], losing the full amount I originally risked if I didn't monitor the 11H TF.
AERO [SPOT] Example:
In this example, we are riding the wave with 🐳's from Aug '24 to Jan '25, trailing our SL and waiting for invalidation, which could potentially be a MSS or a close below a BB.
Skipping towards the end [Dec '24], we are now trying to look for invalidation points so we don't lose all our unrealised profits watching the market 🩸 alongside retail.
Our first flashing signal is the market structure. As we can see, PA failed to get above the SH [$2.372] and close above it on any HTFs. While looking at Bitcoin's market structure, you can see a 3-drive pattern forming, which is a sign of whale activity [distribution]. Although this is a great sign, this isn't a confirmed invalidation, as PA could have still gone up soon after.
On the weekly chart, a 1W BB formed, so you would trail your SL underneath that identified level. However, the following candle stick only wicks through it but never closes below it or the equilibrium of the 1W BB, so you may have never sold during that time. The following candle stick invalidated the 1W BB, but price closed at $1.476, which is much further down than near the 1W BB [$2 region], so you would've missed out on some profits as the candle closed ~23% away from the 1W BB on 23/12/24.
Going down to the 3D TF, you can see a 3D pBB was left behind, which aligned with an untested 0.5 Fib level, so you may have trailed your SL underneath that identified level. The 3D candle closed below that level, which is a SOW, so you would've sold at $1.56 on 20/12/24.
This sold price is higher than the one on the weekly chart, and you saw the invalidation 3 days earlier, so you would've saved some profits.
Going down to an even lower TF, you can see a 23H/21H BB that was left behind, which aligned with a 0.5 Fib level, so you may have trailed underneath that identified level. Price action made a double top [$2.335], failing to close above the PSH, and retraced back towards our 21H BB 0.5 Fib level. The 21H candle closed below our 21H BB, which is a SOW, so you would have sold your position at $1.982 on 14/12/24, keeping in mind Bitcoin's MS as it was forming a 3-drive pattern during 22/11/24 to 17/12/24.
PA also proceeded to close below its PSL [$1.743] after closing below the 21H BB [confluence], which is a sign of bearish continuation.
This sold price is higher than the one on the 1W and 3D TF, so you would've saved even more profits as you have identified a key level on a lower TF to trail your SL at a higher price. Meaning you would have seen your invalidation way earlier, the only thing left to do is to execute, which is the hardest part due to psychology 🧠.
With any of these options, you would have saved yourself from experiencing a ~90% drop, which is the main thing we want to avoid. Invalidation is used to preserve capital and lose less than we might have originally.
With spot positions, I prefer to rely on candle closes rather than wicks hitting stop losses because of the confirmation.
Invalidation and stop losses are heavily linked. You can read about stop losses in this post 👉 x.com/CryptoChase02/status/1…
Volume Spread Analysis (VSA)
VSA can be used once your key level is hit or when PA is nearing your identified key level. If there is a widespread candlestick with high volume approaching your bullish/bearish key level, which can be a SOS, price action may pierce through your key level.
I won't go into this in detail here because I'll be repeating myself, as I have already made a great post about VSA in the volume education post with examples in the comments showing validation to potential setups. You just have to see the opposite side of what I say, and you have your answer for invalidating setups.
You can read about volume in this post 👉 x.com/CryptoChase02/status/1…
I try to make these topics as friendly as possible, and it does take some time out of my day, so if you want me to provide more educational posts, please like and repost so they can reach more people 🙏
If you have any questions, put them in the comments below 👇

65
159
777
159,173

Jun 10
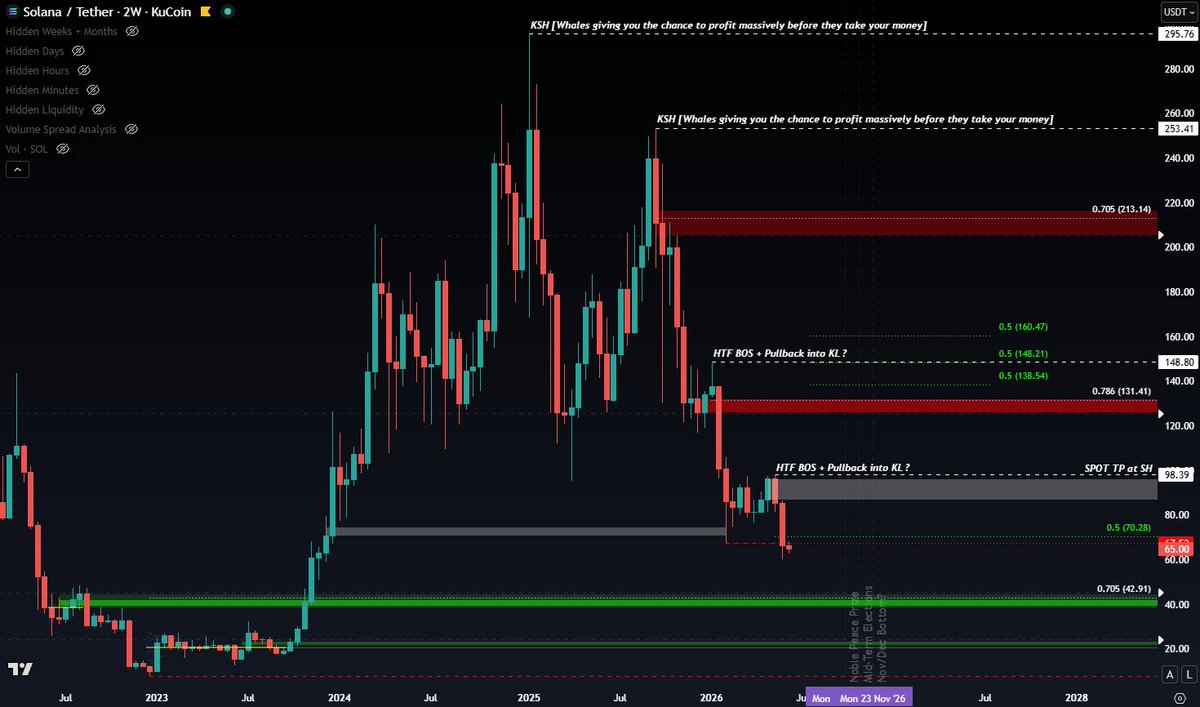
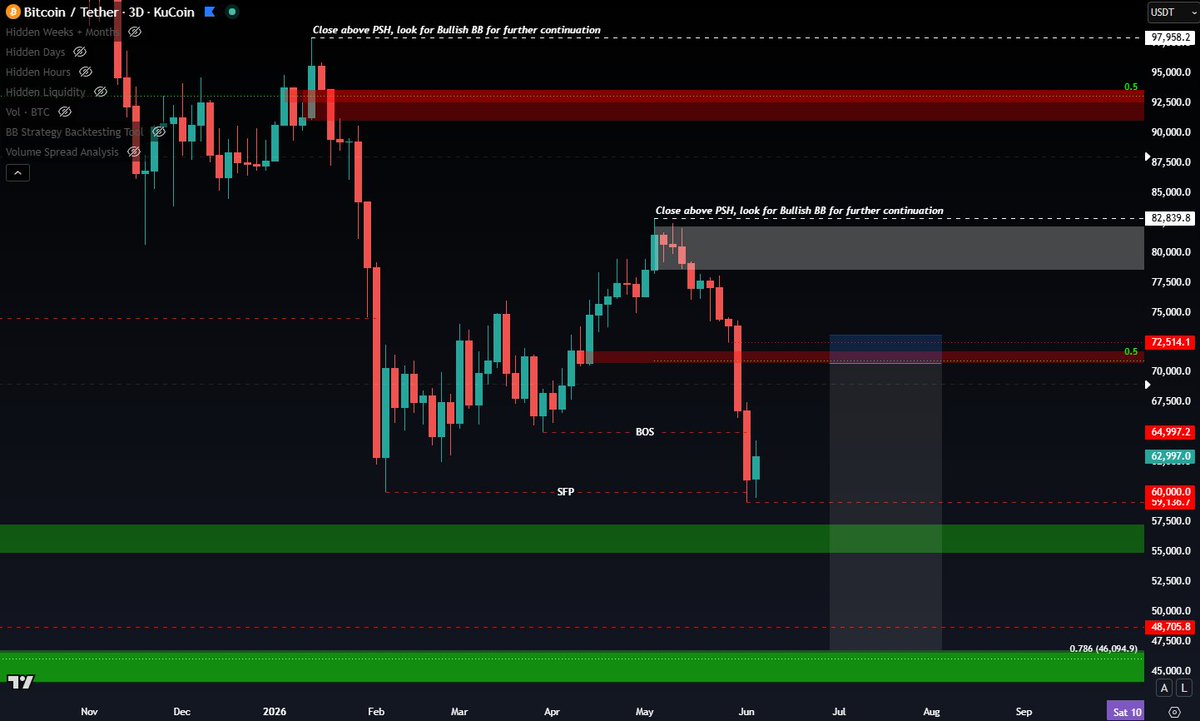
One more powerful reversal [46K] before the true macro bottom [28K]? 👁️🔮
Current Bitcoin scenarios:
46K > 66K - 71K > 30K
66K - 71K > 46K
These are just scenarios. I could be completely wrong. I don't expect price action to move this smoothly. I'm painting pictures in my head with the key levels left behind and the information presented.
The majority of altcoins didn't have a crazy move in the latest HTF swing [Produced ~50% gains, which is still considered great] and failed to touch their HTF BBs [2W BB on major charts/High-capped coins], which were left behind. Additionally, ETH/BTC has yet to see its impulse, with major key levels being above us. So many possibilities and opportunities in the not-so-distant future.
MT - "True reversals form only at the most powerful levels where liquidity, structure and time all converge"
Spot positions require the most patience ⏰
Find > Wait > Execute > Profit > Repeat.
7
6
128
5,823

Jun 9
$LINK [SPOT]
Don't act blind near the bear market bottom because many will. There is always some sort of data somewhere.
Don't be lazy, find it.
7
4
100
5,430
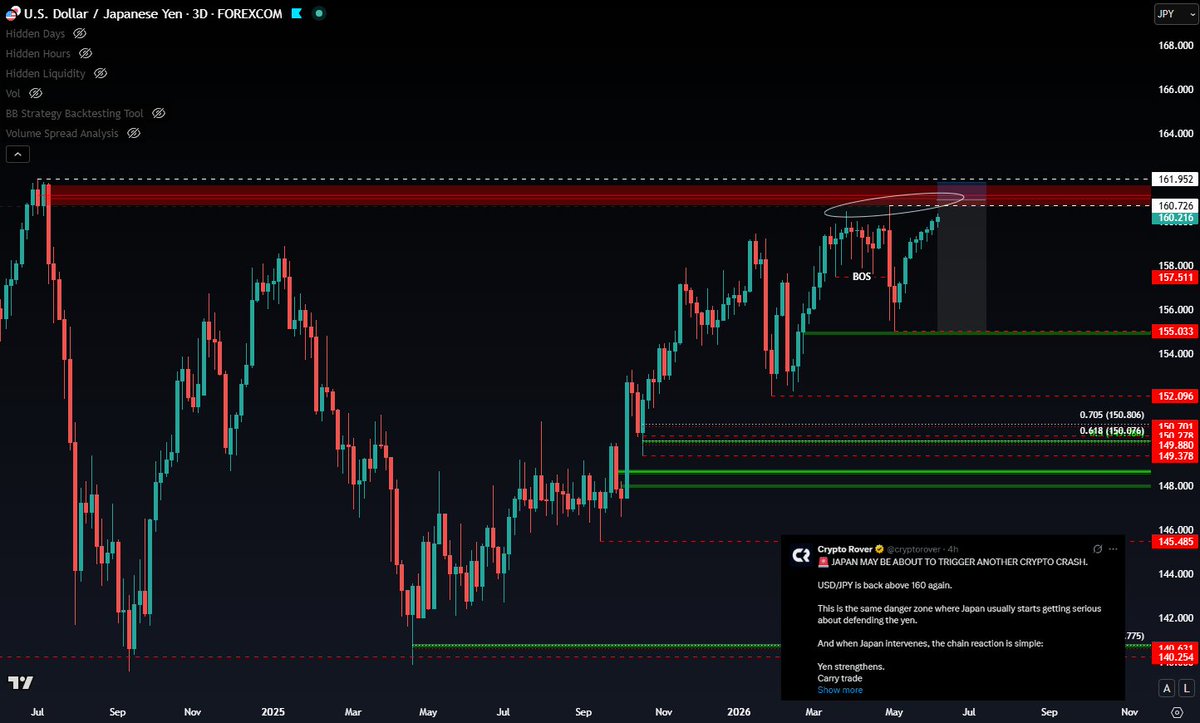
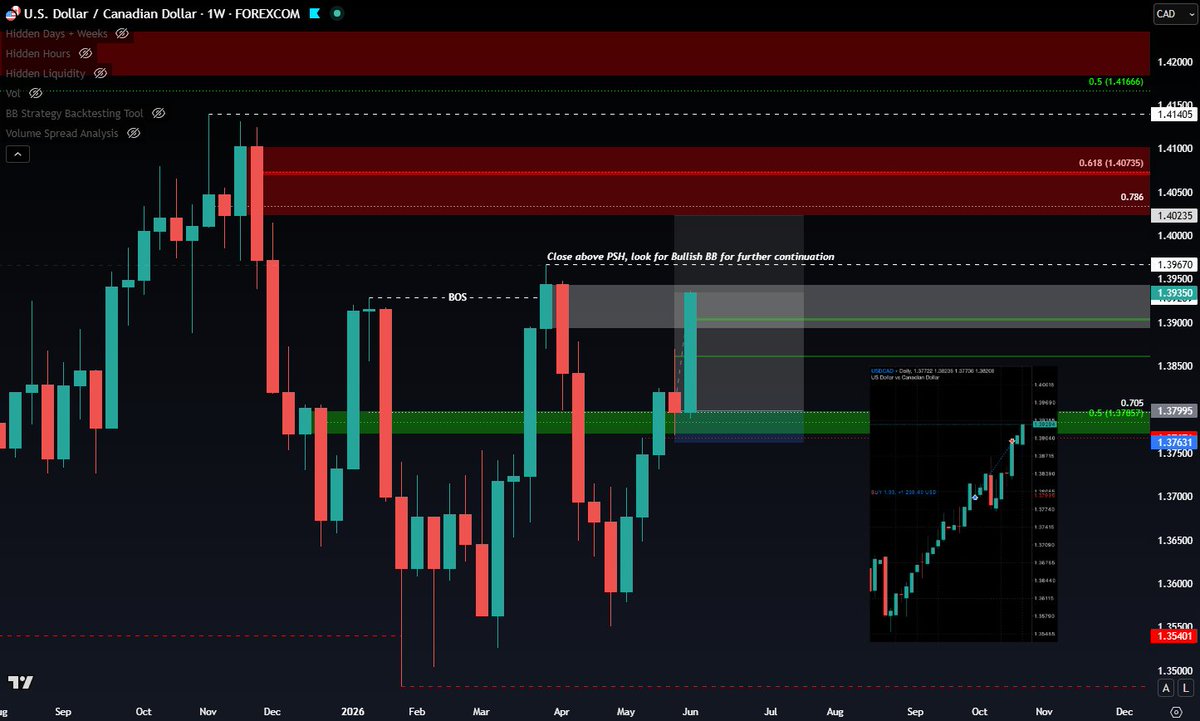
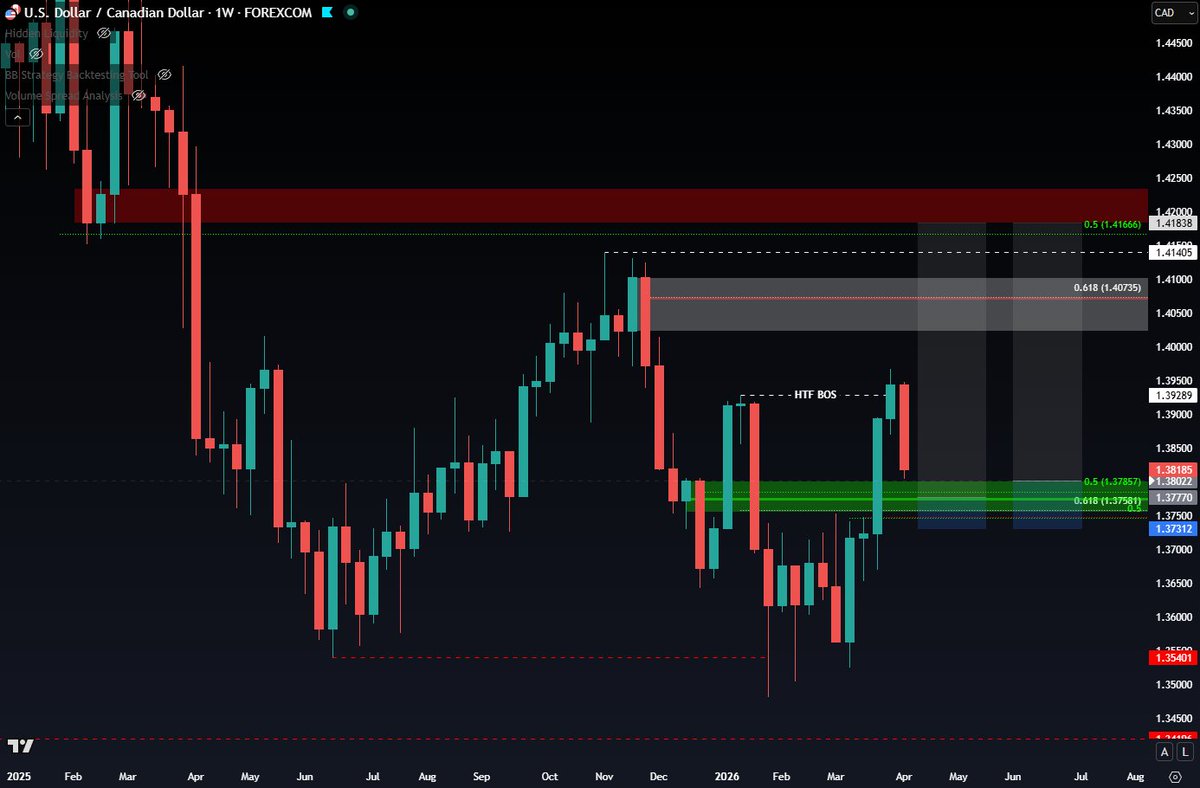
Jun 5
$USDCAD [UPDATE]
Added 2 more weekly FVGs before the gap was filled. The BOS already told you which direction was favoured 👍
4
2
35
7,006
Jun 5
cardano:native Dead 📉?
We shall see in the near future...
10
1
54
5,700
Jun 5
I’m going to call this “The Great Reset”.
Many altcoins will show new lows. The biggest fear ever created by 🐳. The same fear that will stop people from buying because they think the market is dead.
We know the market won’t die because of the HTF key levels left behind 🧠
2
6
155
7,441
Jun 3
I do plan on doing an update on the major charts as the picture has completely changed hence why I sold most of my spot bags.
I saw weakness [Invalidation] so I sold, simple. However, I may jump back in but only on confirmation.
Waiting on the HTF candle closes 👍🏽
1
1
53
2,844
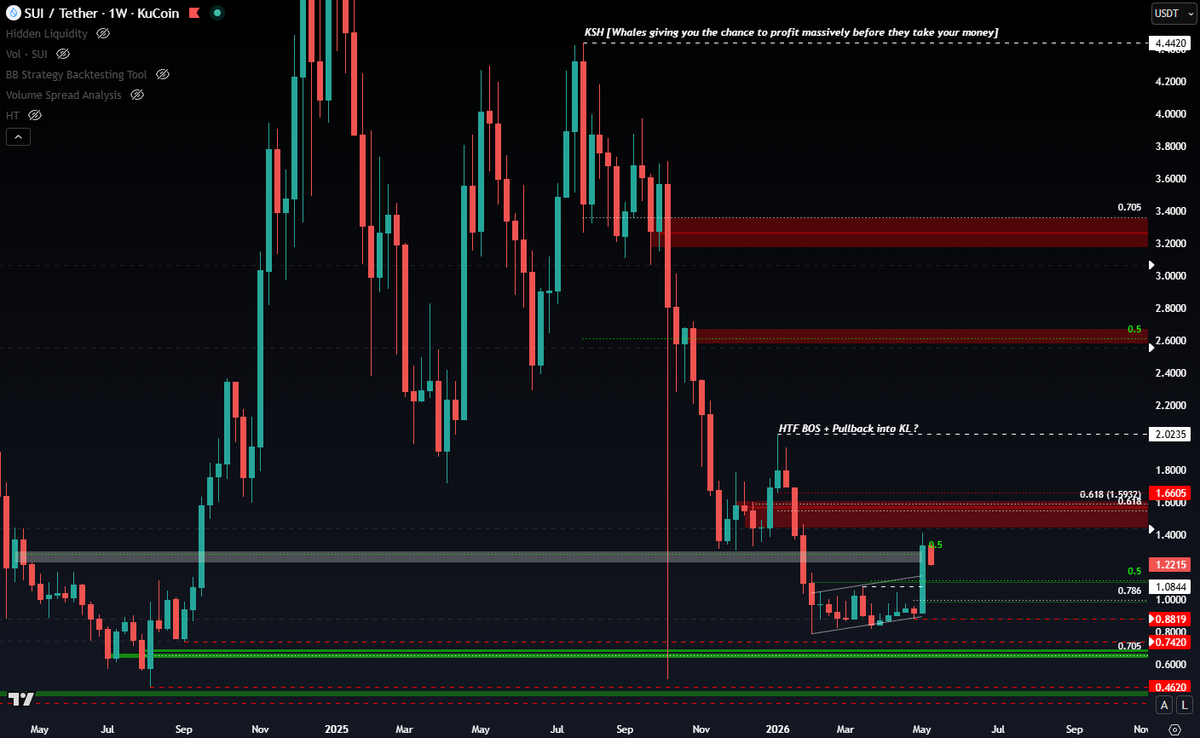
Jun 3
$SUI [UPDATE] 📉
Quite disappointed with myself on this position, as I had a few signals to take profit [SUI/BTC and the equilibrium of the HTF range], but I was heavily focused on the 2W BB.
After waiting so patiently and it being the biggest bag over 5 figures, price action collapsed and returned to my entry, so I decided to close my position at around -5%. Naturally, I'm going to feel some sort of emotion, but I didn't lose much compared to the average crypto investor, so no reason to feel too upset.
I tend to jump back into a SUI position at the 3D BBx2, which I posted way back in Sep '24 👉 x.com/CryptoChase02/status/1…
The ideal scenario would be for price action to hit 3D BBx2 and move into the 2W BB. Will MM's give it? That's another question.
May 13
$SUI [SPOT UPDATE]
I haven't talked about my SUI spot bag for a long time, but since we got that amazing HTF candle closure, it's time to update. Since it's my biggest spot bag, I pay even more attention to this coin 👁️
So last week we broke the HTF MS on the weekly TF, the parallel channel and we closed above the 1W pBBx2 key level. These are all bullish signals for further continuation. The 2W BB didn't hit, so I haven't taken any profit just yet. When it hits, I'm planning to TP 40% of my spot bag and move my trailing SL ⬆️.
Remember, we are in a macro downtrend, so taking more profit than you would in a bull market is ideal.
I'm not planning to reallocate on the pullback as I think there are better opportunities elsewhere in the market. There is a 2D BB below, but the OB is tiny, so it's not really in my best interest. I do think there is the potential of price action blowing past the 2W BB as well, since the HTF KLs on the major charts are a bit further away.
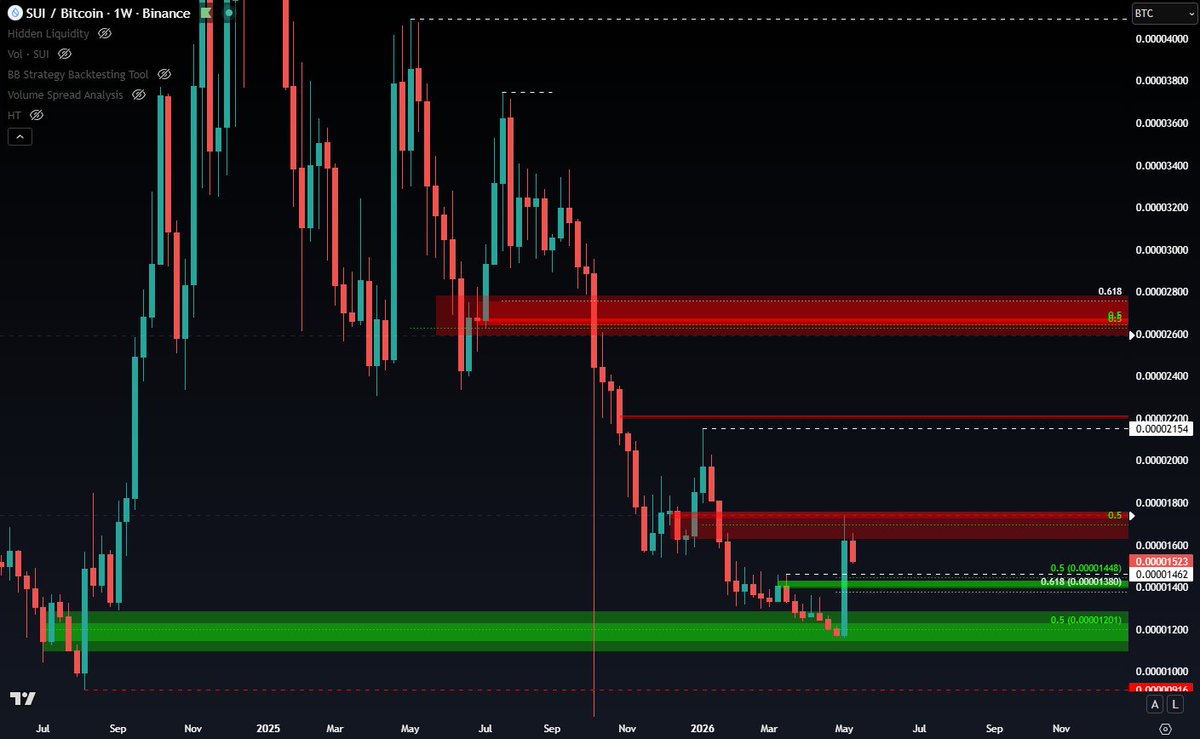
SUI/BTC is also a great chart to keep an eye on if you want to find where/when pumps and dumps are likely. Updated version in the picture below 👇
SUI/BTC showed a weekly BOS while reacting to the bearish 2W BB, but it left behind a 5D/3D BB. Price action is likely to bounce off this area and reverse back up, which could be our signal of where/when to expect the next pump on SUI. The next SH and HTF BBs 0.5 Fib level would be the next area where we could see some sort of resistance after the 2W BB on SUI/BTC.
Before and after proof, like always, inside this community 👉 x.com/CryptoChase02/status/2…
4
35
6,935
May 22
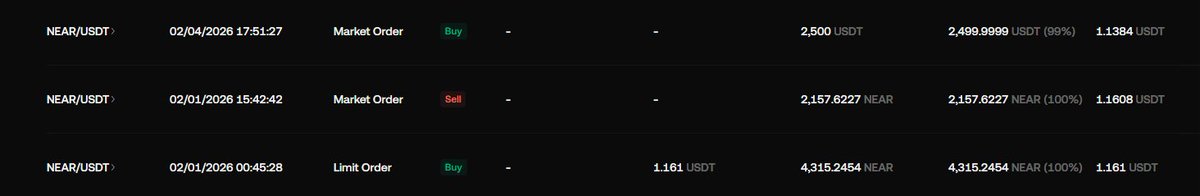
near:native [SPOT UPDATE] 💰
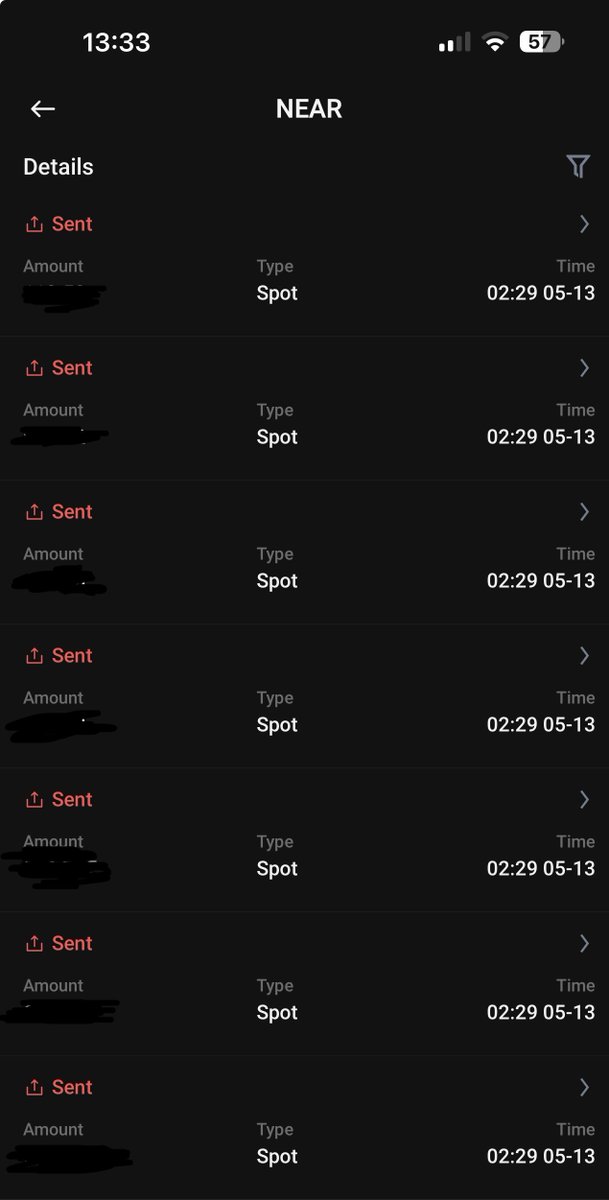
Woke up to beautiful weather in London and a nice TV notification. Another take profit level hit with my near spot position!
I've sold 50% of my remaining bag at the 5D BB and will move my trailing SL ⬆️ responsibly [Possible 5W or 5D BBx2 forming].
Looking to sell the rest of my position in accordance with NEAR/BTC. I'm looking at a potential HTF SFP at the highs or a touch into the HTF BB above [2M]. That may represent the highs at $3.18 or the 5D BB at $3.8. Quite far, but if we can invalidate the current 5D BB [$2.1] with a weekly BOS, then it becomes reasonable to test the above.
Looking to deploy my profits elsewhere in the market that show potential [Currently SEI, GALA and ARB] or reinvest back into NEAR's 5D BB at $1.4 [So many 5D BBs 🤣].
Before and after receipts like always 👉 x.com/CryptoChase02/status/2…


May 13
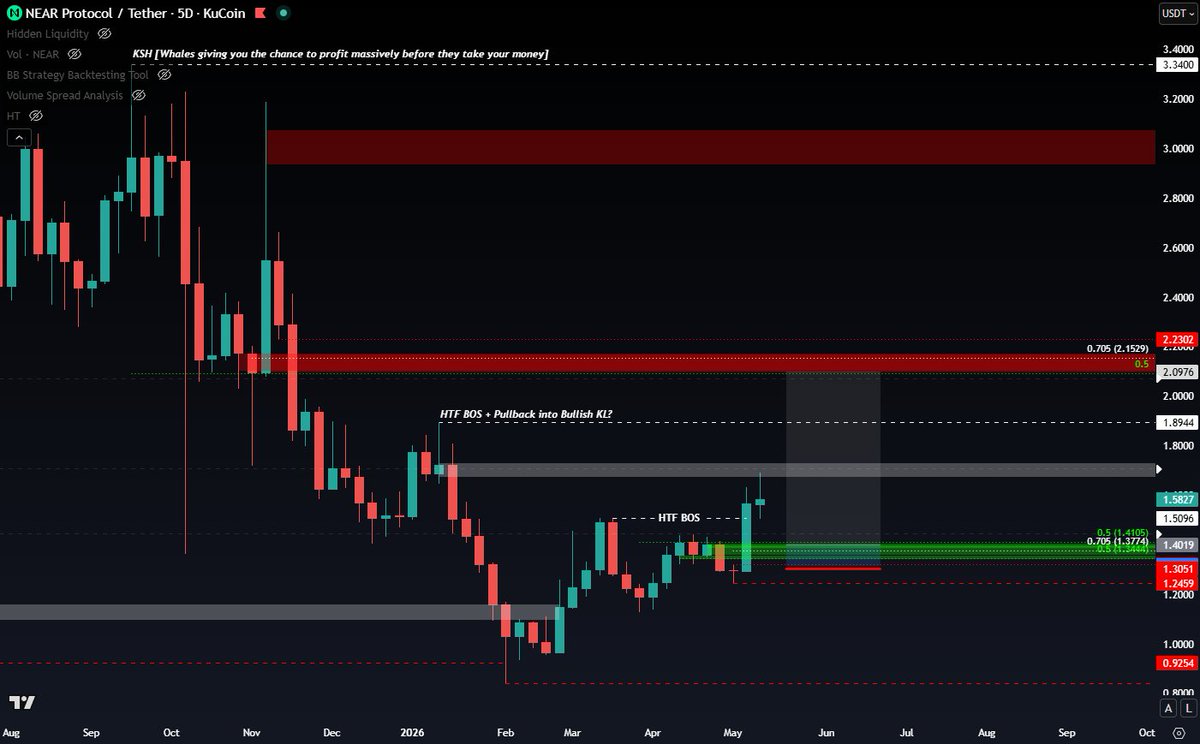
$NEAR [SPOT UPDATE]
Amazing market structure on NEAR and some nice HTF BBs left behind 👁️
Last night, I took 25% profits from my spot bag at the HTF supply and moved my trailing SL ⬆️ below the HTF BB.
Planning to reallocate at the 5D BB and open a separate trade at the KL with our main target of profiting heavily at the bearish 5D BB above.
Do keep an eye on the grey area, as those OBs could potentially turn into a BB, which could provide us with another long opportunity and a place to trail our SL under.
9
4
71
10,070
Jun 3
Sold a small amount of NEAR when NEAR/BTC hit 2M/3M BBs. It's still rising and you never know what could happen, so I'm leaving the rest for the 5D BB [$3.8].
Either SL hit or TP hit. Which one will happen first?
7
869
Jun 3
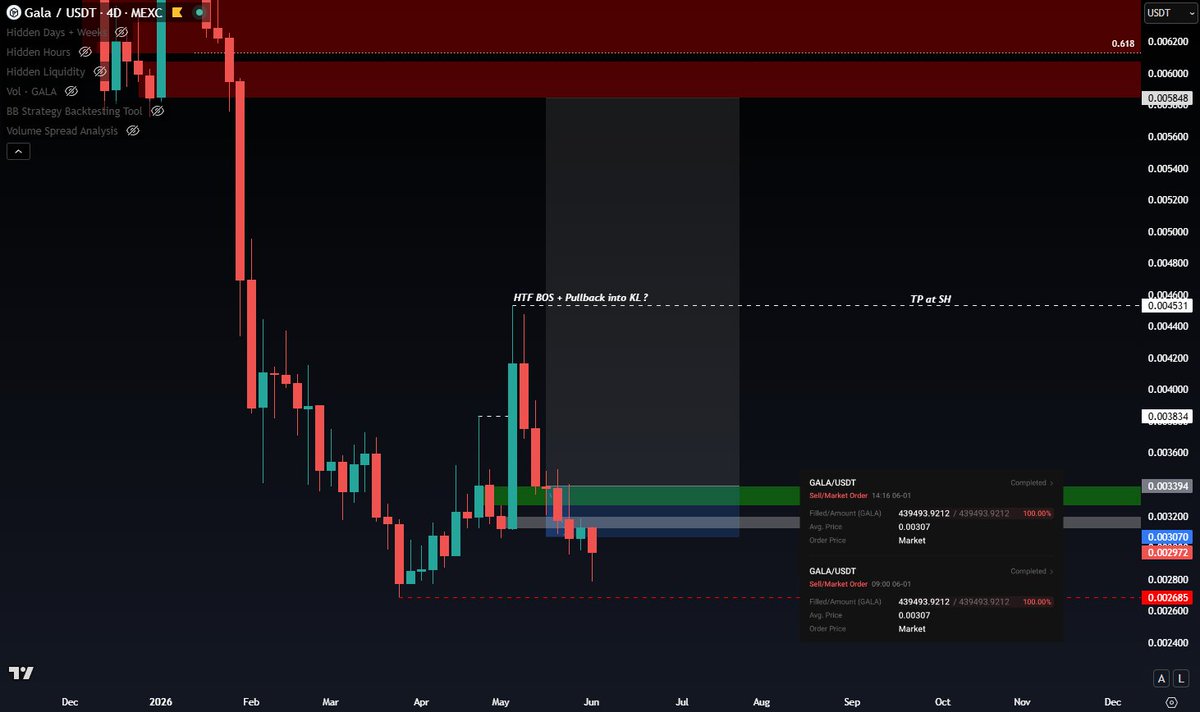
$GALA [UPDATE] 📉
The HTF KL failed and we saw a HTF candle close below its BB on the respective TF, so I sold my whole spot bag. I lost around -10% of my bag.
In this scenario, I played it a little differently in terms of stop-loss because there was a demand area just below. At the time, I thought maybe we would bounce off demand and shoot. As it was relatively close to my entry, I wanted to see what the demand area could do. That failed, so I immediately closed my position manually.
If the demand area had not been close by, I would've stuck to my original stop-loss strategy for my spot positions.
May 20
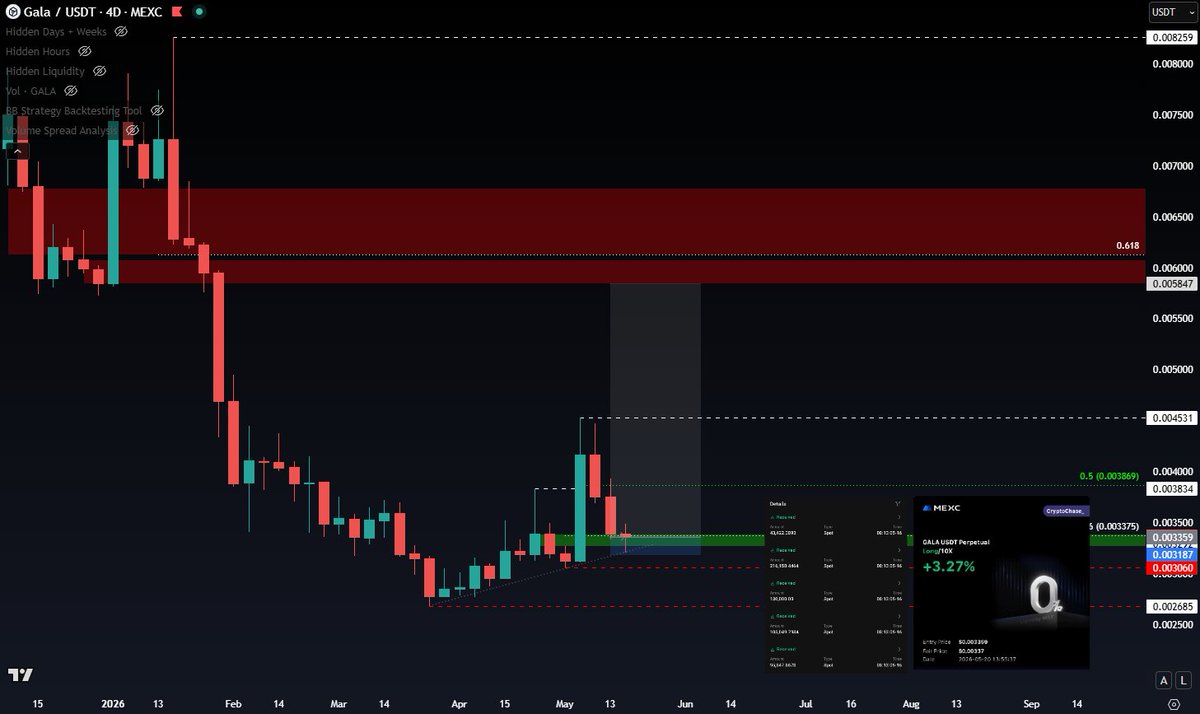
$GALA [UPDATE]
Entered with a spot position and a long leverage. Nearly got stopped out but somehow still in.
If Bitcoin collapses past current HTF demand then likely to be stopped out on the leverage position. The spot position, I'll wait for HTF candle closures to invalidate.
1
28
3,870
Jun 3
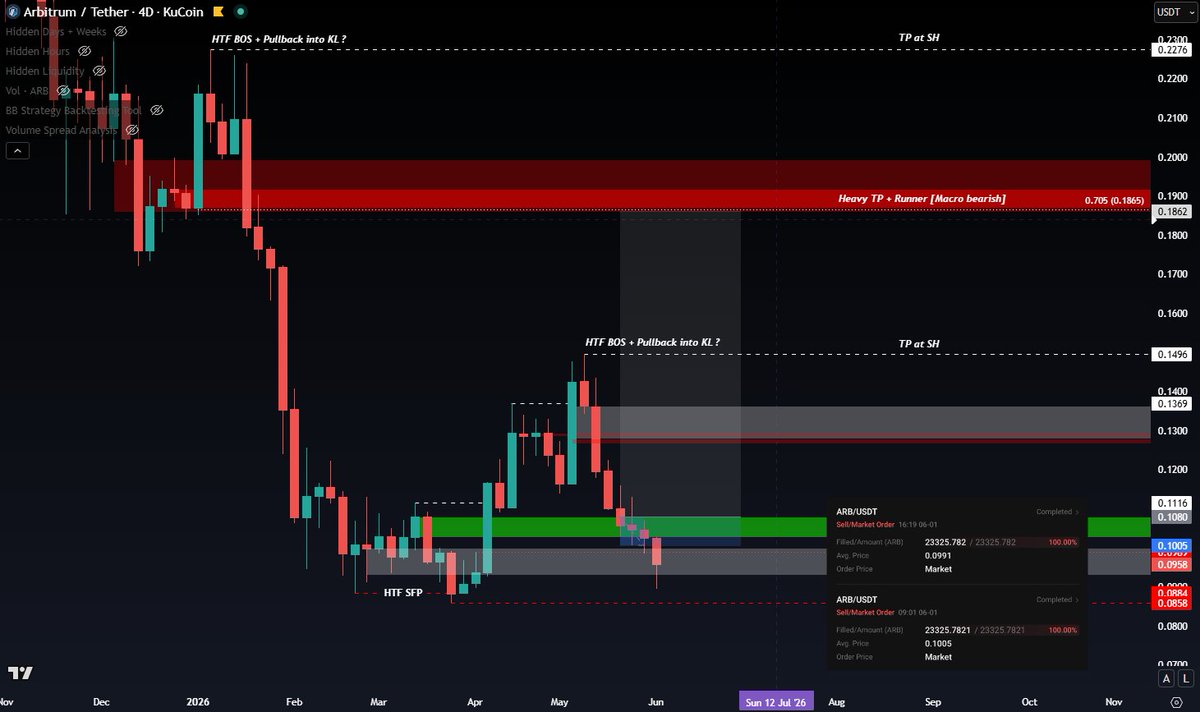
$ARB [UPDATE] 📉
The HTF KL failed and we saw a HTF candle close below its BB on the respective TF, so I sold my whole spot bag. I lost about -8% of my bag.
I am aware of price action currently testing its HTF demand area, but in terms of timing in our cycle, I'm not sure if I want to be overly exposed to altcoins right now. We will see.
May 25
$ARB [SPOT UPDATE]
Over 1 month later, the HTF KL finally hit after great HTF BOS's. Market structure looked good, so I set a LO and waited.
Also added size last night, as there was confluence on the ARB/BTC chart. PA hit HTF demand [Base before rally] POC.
Now we wait and watch for invalidation signals 🚨


26
3,572