
Joined September 2012
- Tweets 41,556
- Following 963
- Followers 60,864
- Likes 31,870
14,652 Photos and videos


Pinned Tweet

Jun 10
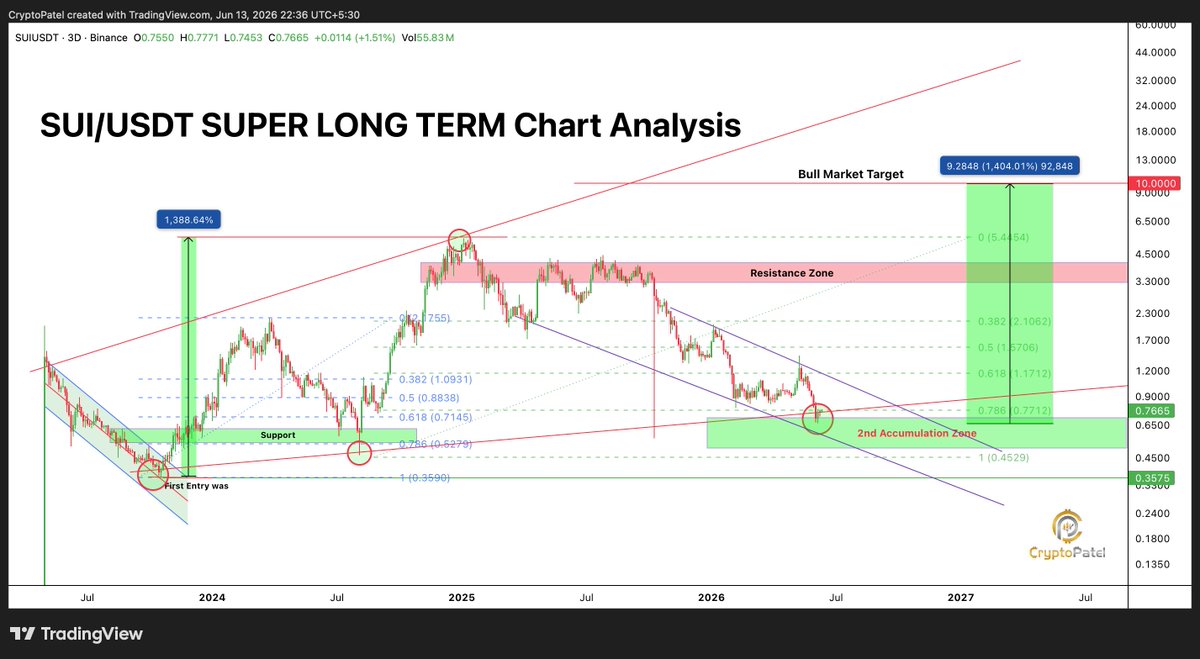
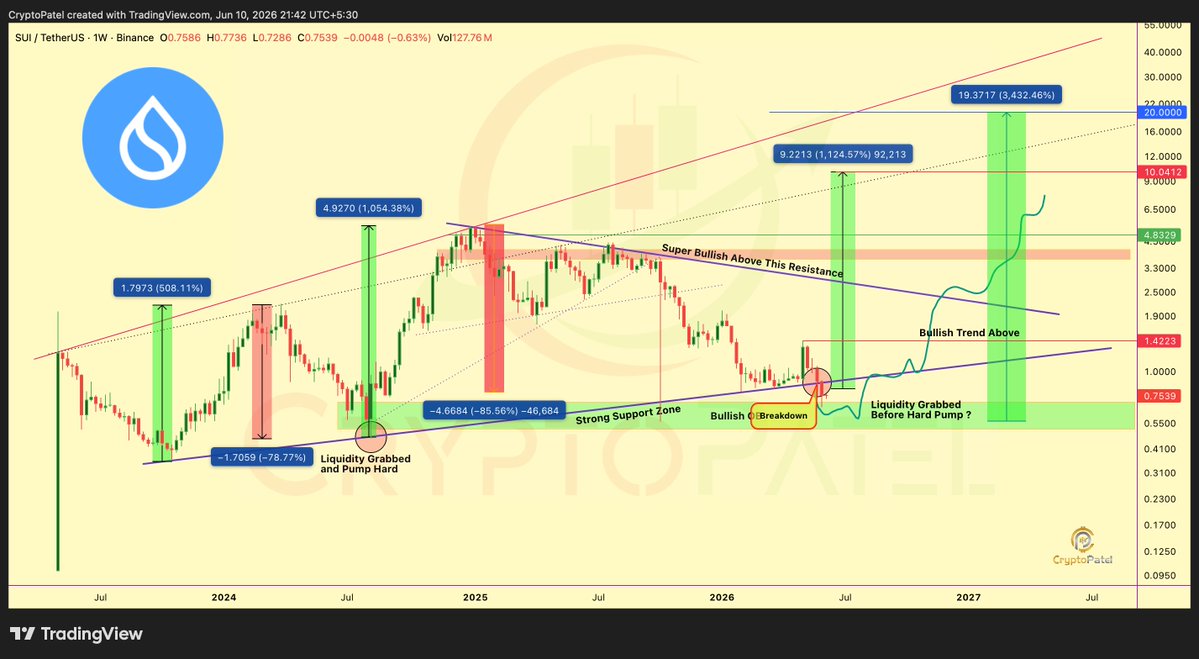
$SUI From $0.7 To $10? 🚀
The SUI Network Growth Story Might Be The Opportunity Most Investors Are Missing.
Explosive Ecosystem Growth, Rising Adoption, Increasing TVL, And Strong Institutional Interest Are Putting #SUI In The Spotlight.
If This Momentum Continues, @SuiNetwork Could Be One Of The Biggest Winners Of This Cycle. 👀🔥
13
121
535
15,113
FACT: SpaceX is now the 8th largest public Bitcoin-holding company.
$SPCX Currently Holding: 18,712 BTC ($1.2B)
13
12
212
7,522
BULLISH: $BTC IS EXTREMELY OVERSOLD ON THE RAINBOW CHART.
18
16
241
7,604
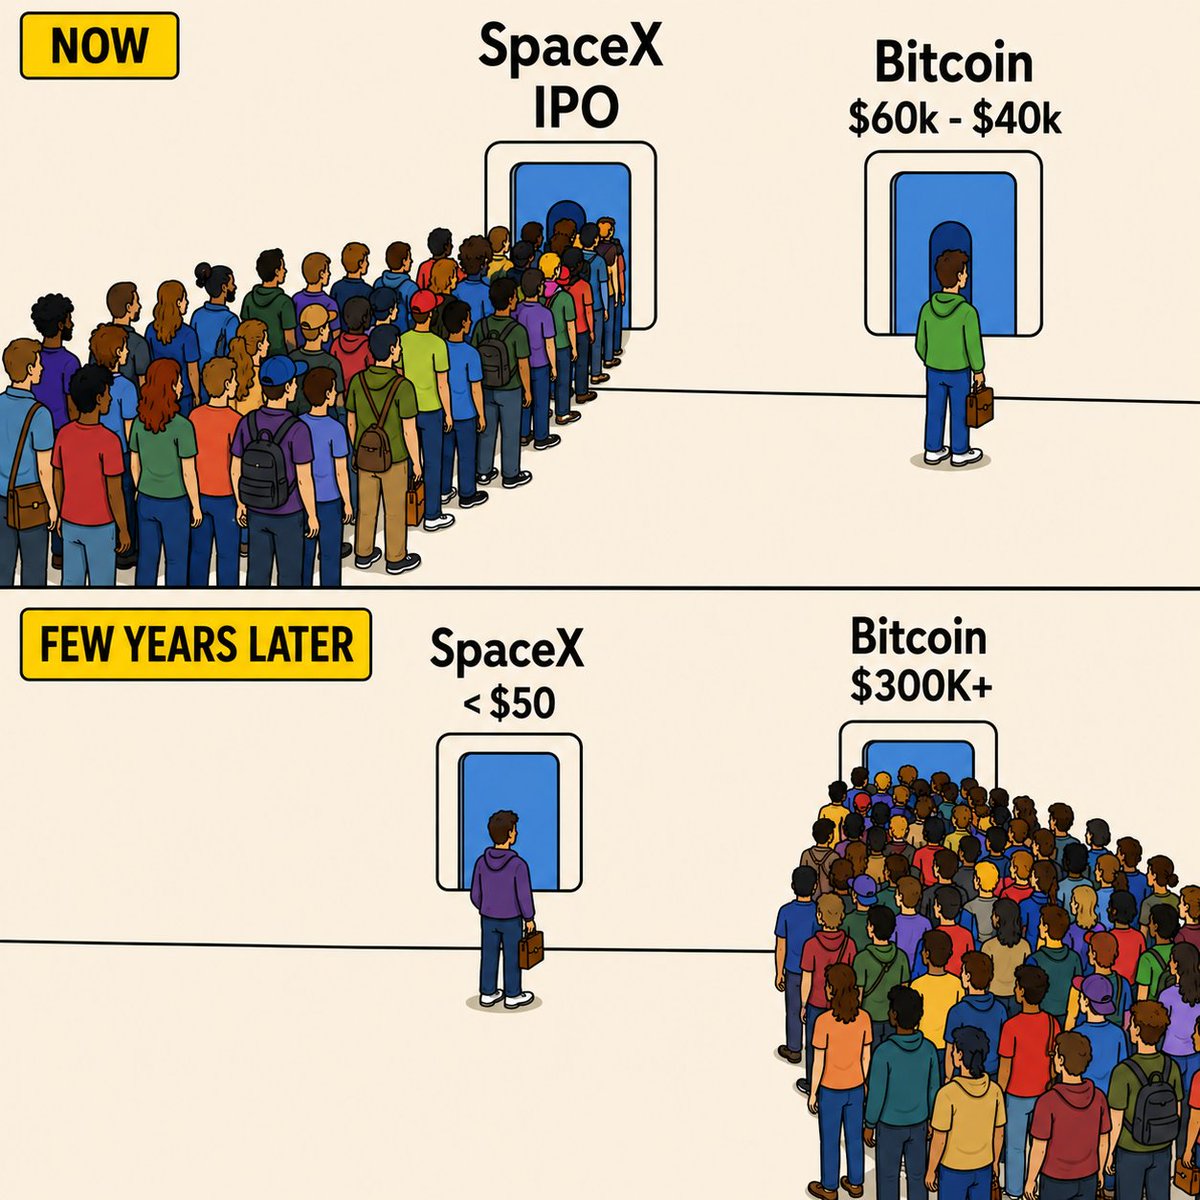
Everyone Is Racing To Buy SpaceX At $161 Per Share.
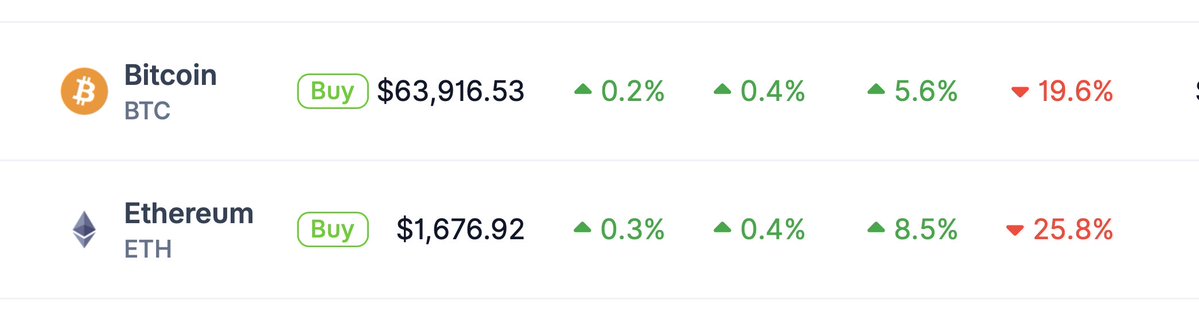
Meanwhile $BTC Is Still Being Ignored Around $60K–$40K.
Most Investors Focus On Price.
Few Focus On Valuation.
That's A Costly Mistake.
Ask Yourself:
What Is More Realistic Over The Next Few Years?
👉 #Bitcoin: $64,000 → $300,000 ( 370%)
OR
👉 $SPCX Adding Several Trillion Dollars In Additional Market Value
SpaceX Is One Of The Greatest Companies Ever Built.
But Great Companies Don't Always Produce Great Returns.
Especially When Expectations Are Already Sky High.
The Market Doesn't Pay You For Buying Quality.
The Market Pays You For Being Early.
Today The Crowd Wants Access To SpaceX.
Tomorrow The Crowd May Be Chasing Bitcoin At $300K .
The Funny Part?
When Bitcoin Was $16K, Nobody Wanted It.
At $300K, Everyone Will Have A Reason Why They Always Believed In It.
The Biggest Returns Rarely Come From Following The Line.
They Come From Standing Where Nobody Else Wants To Stand.
Price Is What You Pay.
Valuation Is What You Get.
And Expectations Decide Everything. ₿

17
17
224
7,543
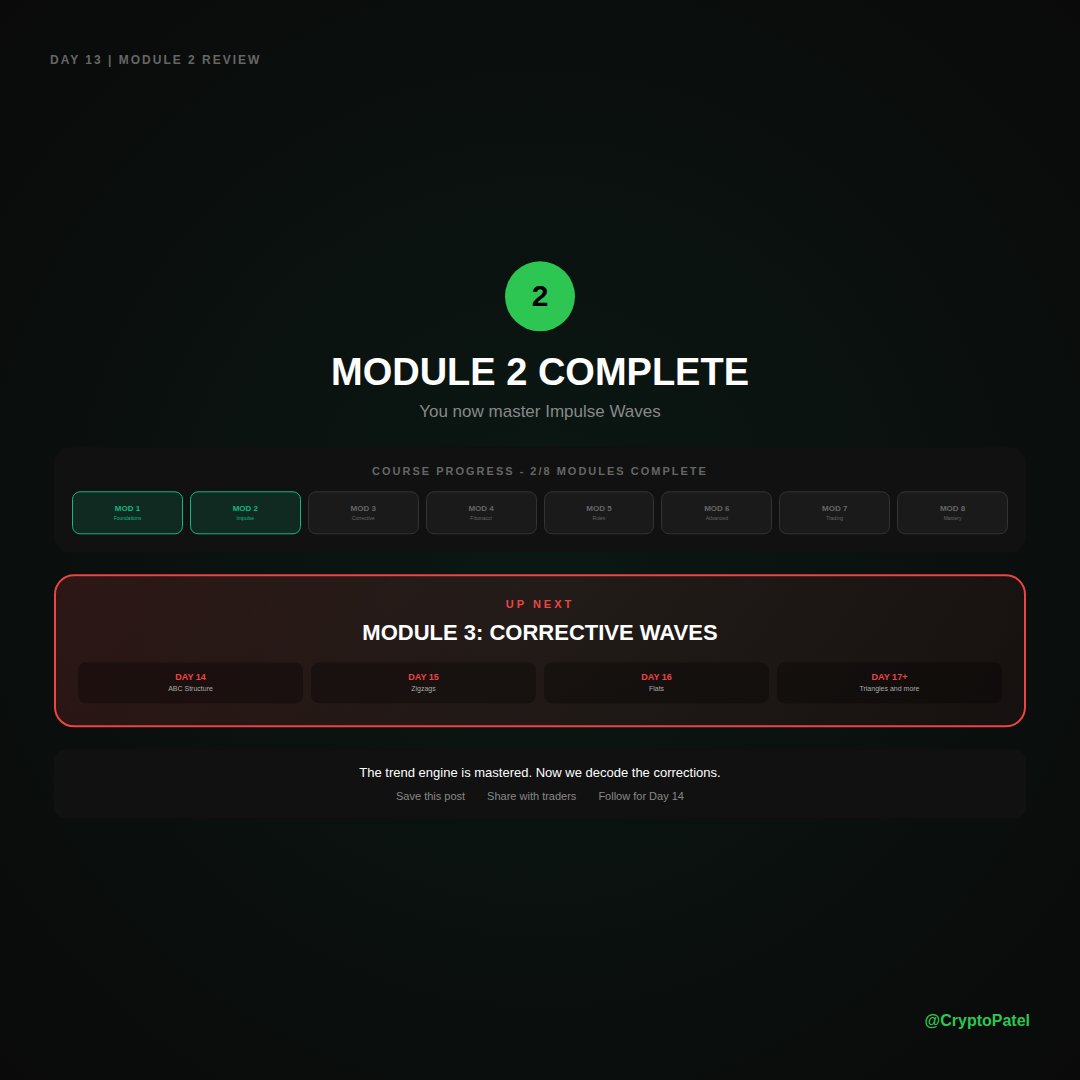
ELLIOTT WAVE MASTERY COURSE | MODULE 2 COMPLETE | DAY 13
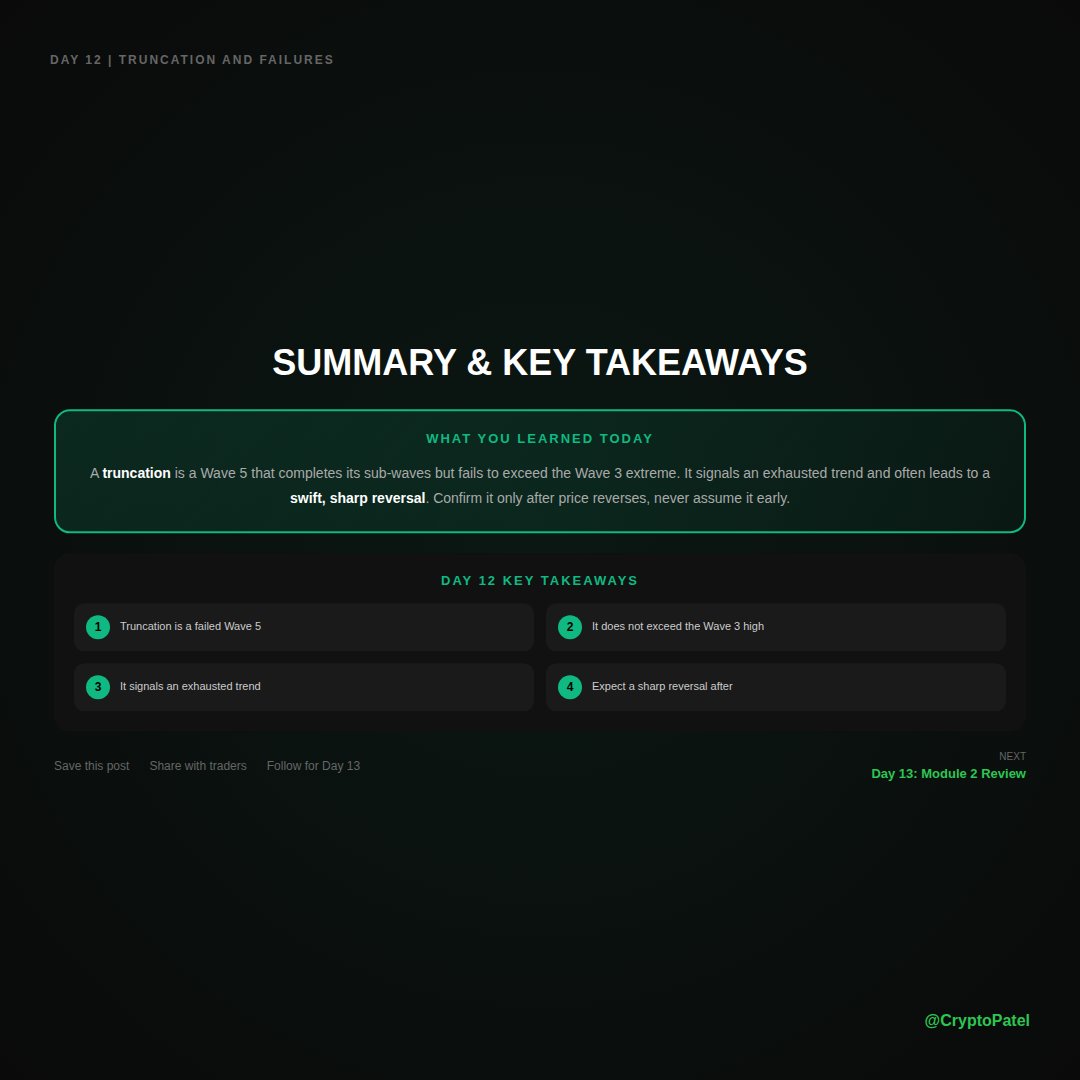
MODULE 2 REVIEW: Impulse Waves Mastered
You now understand the full impulse wave structure.
DAYS COMPLETED:
Day 7: Impulse Structure
Day 8: Waves 1 and 2
Day 9: Wave 3
Day 10: Waves 4 and 5
Day 11: Extensions
Day 12: Truncation
13 Days Done | 52 Slides Learned | 22% Course Progress
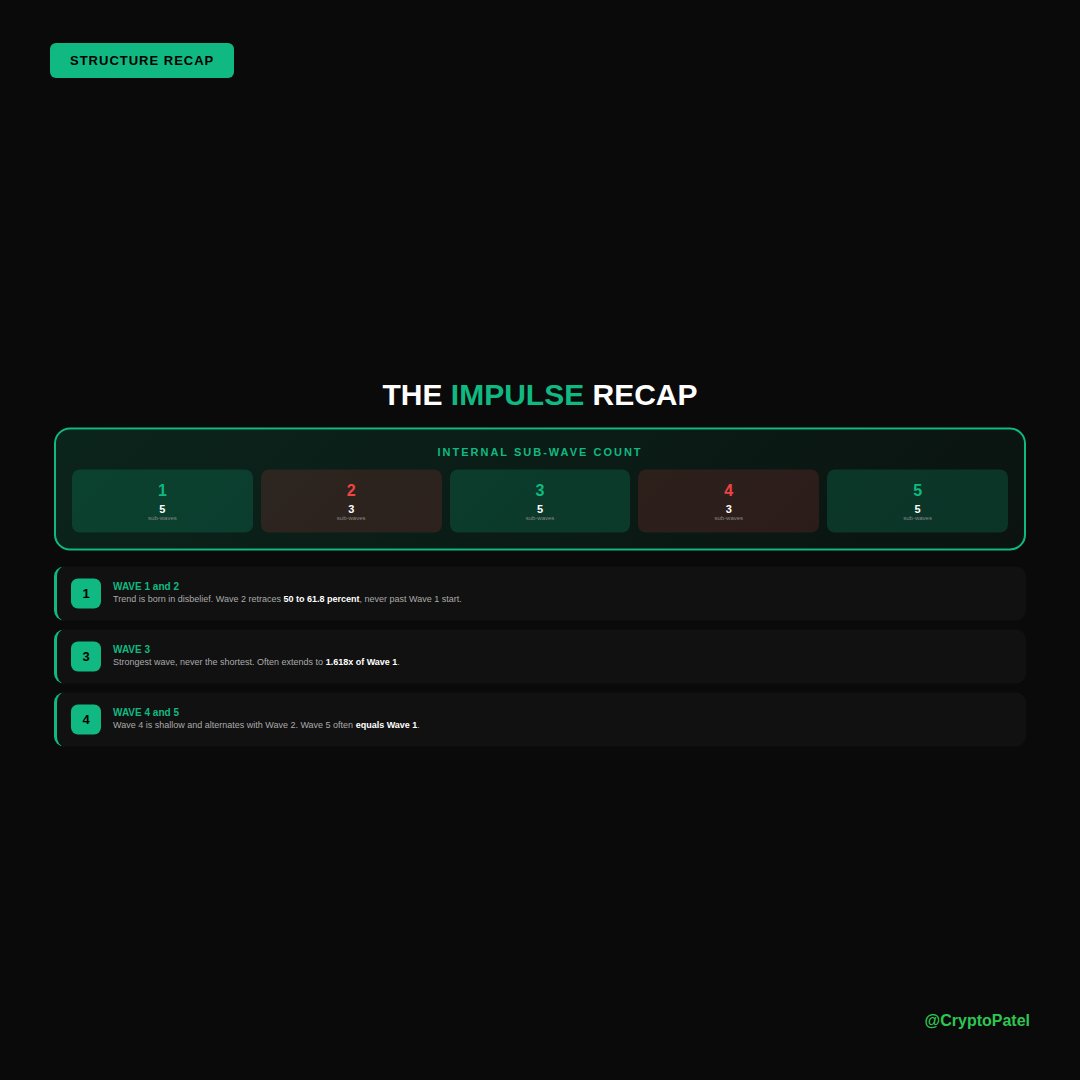
THE IMPULSE RECAP:
INTERNAL SUB-WAVE COUNT:
🔹 Wave 1: 5 | Wave 2: 3 | Wave 3: 5 | Wave 4: 3 | Wave 5: 5
🔹 WAVE 1 and 2: Trend is born in disbelief. Wave 2 retraces 50 to 61.8 percent, never past Wave 1 start.
🔹 WAVE 3: Strongest wave, never the shortest. Often extends to 1.618x of Wave 1.
🔹 WAVE 4 and 5: Wave 4 is shallow and alternates with Wave 2. Wave 5 often equals Wave 1.
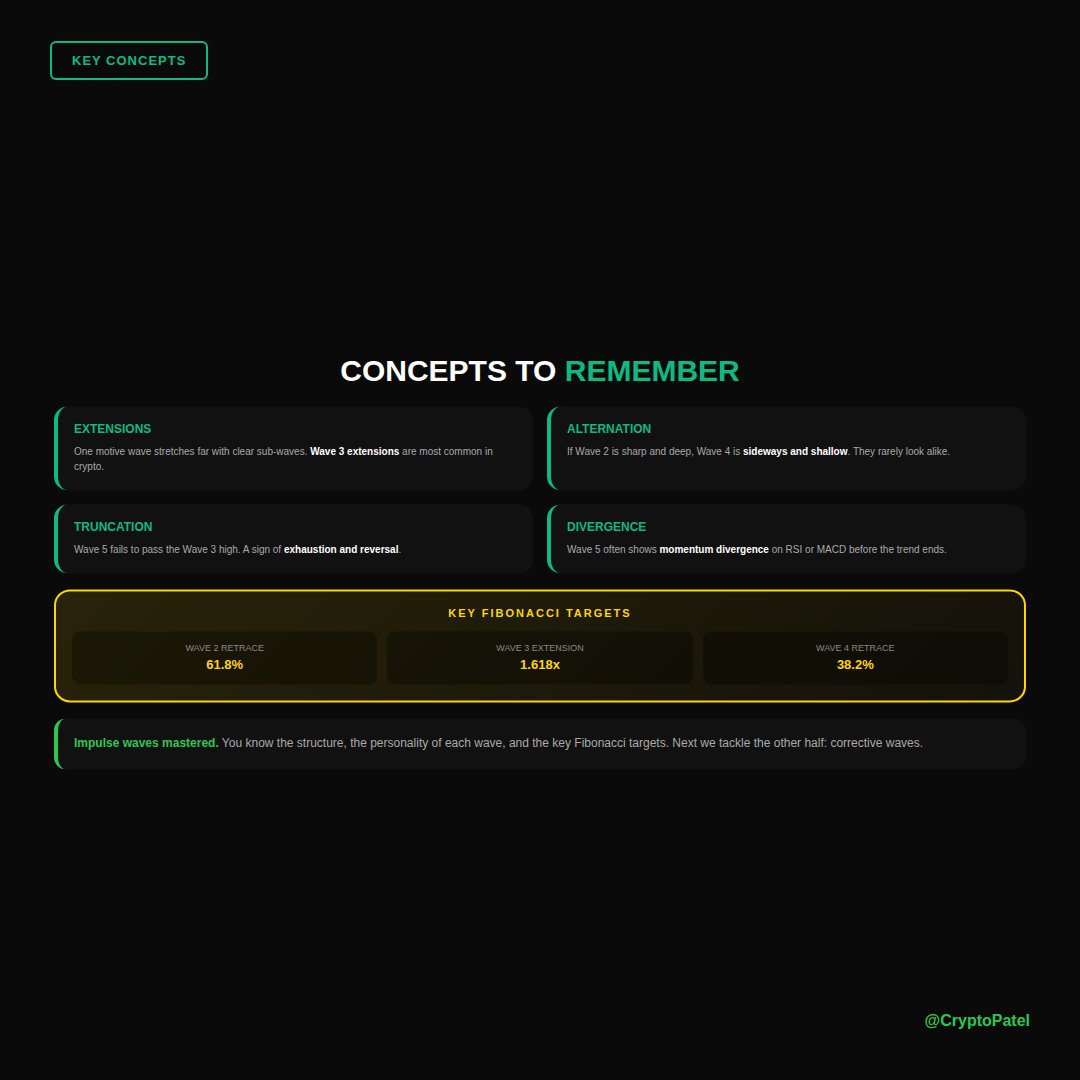
CONCEPTS TO REMEMBER:
🔹 EXTENSIONS: One motive wave stretches far with clear sub-waves. Wave 3 extensions are most common in crypto.
🔹 ALTERNATION: If Wave 2 is sharp and deep, Wave 4 is sideways and shallow. They rarely look alike.
🔹 TRUNCATION: Wave 5 fails to pass the Wave 3 high. A sign of exhaustion and reversal.
🔹 DIVERGENCE: Wave 5 often shows momentum divergence on RSI or MACD before the trend ends.
KEY FIBONACCI TARGETS:
Wave 2 Retrace: 61.8%
Wave 3 Extension: 1.618x
Wave 4 Retrace: 38.2%
Impulse waves mastered. You know the structure, the personality of each wave, and the key Fibonacci targets. Next we tackle the other half: corrective waves.
COURSE PROGRESS - 2/8 MODULES COMPLETE:
Module 1: Foundations DONE
Module 2: Impulse Waves DONE
Module 3: Corrective Waves UP NEXT
Module 4: Fibonacci & Waves
Module 5: Wave Rules & Guidelines
Module 6: Advanced Patterns
Module 7: Trading the Waves
Module 8: Mastery & Application
UP NEXT - MODULE 3: CORRECTIVE WAVES
Day 14: ABC Structure
Day 15: Zigzags
Day 16: Flats
Day 17 : Triangles and more
The trend engine is mastered. Now we decode the corrections.
Next: Day 14 | The ABC Structure
#ElliottWave #EWT #ImpulseWaves

ELLIOTT WAVE MASTERY COURSE | MODULE 2: IMPULSE WAVES | DAY 12
TRUNCATION AND FAILURES: When Wave 5 Falls Short
Sometimes Wave 5 runs out of steam before making a new high.
This failure is a powerful warning of reversal.
UNDERSTANDING TRUNCATION:
A truncation (or failure) is when Wave 5 completes its five sub-waves but fails to exceed the end of Wave 3. The expected new high or low never arrives.
STILL A VALID WAVE 5
It still subdivides into 5 clean sub-waves. It just falls short of the Wave 3 extreme.
FOLLOWS A STRONG WAVE 3
Truncation usually appears after a powerful, extended Wave 3 that used up momentum.
SIGN OF WEAKNESS
The market lacked the strength for a new extreme. Buyers or sellers are exhausted.
RARE BUT IMPORTANT
Truncations are uncommon, but when they appear they carry a strong message.
THE WARNING IT SENDS:
A truncated fifth often leads to a swift and severe reversal, because the trend ended weaker than expected.
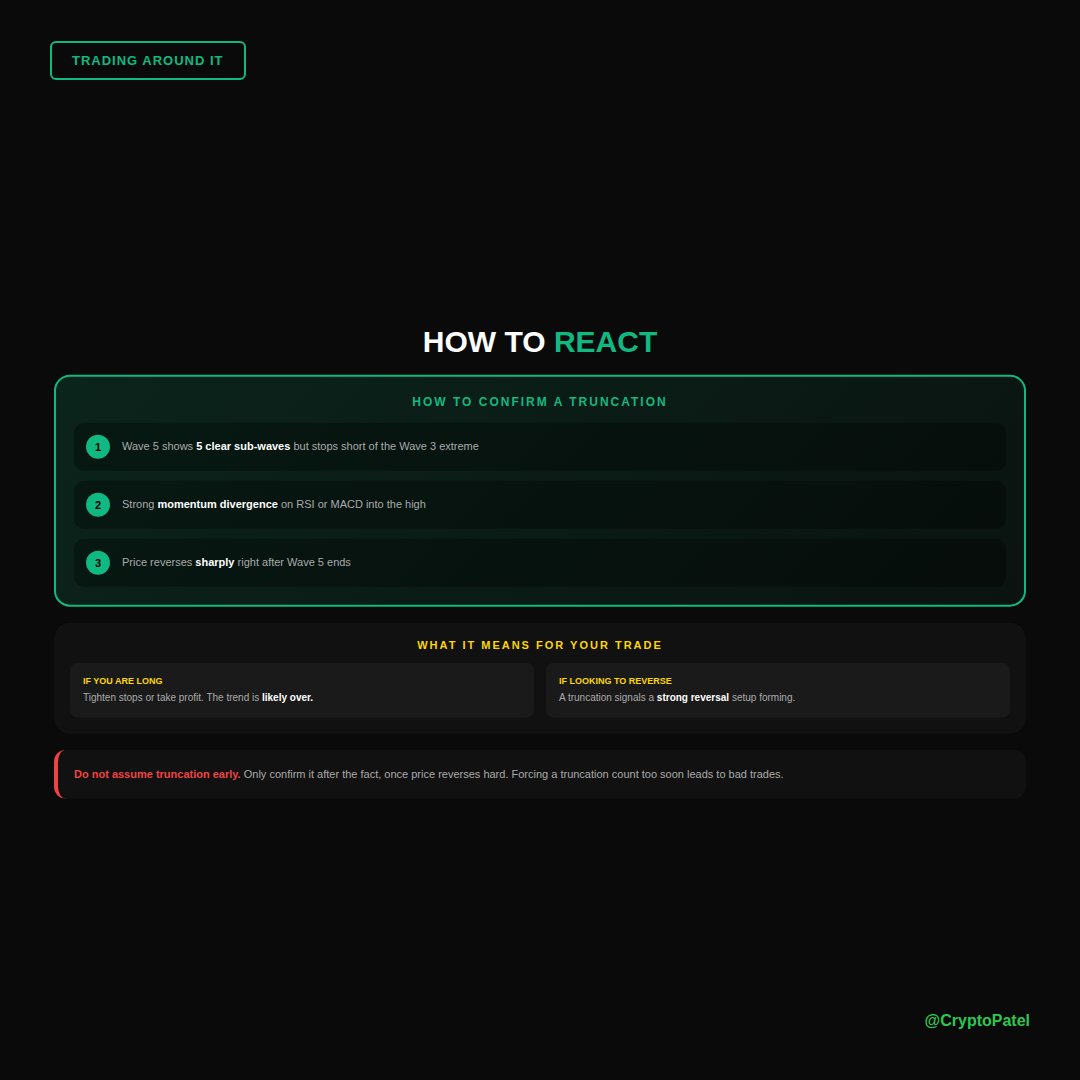
HOW TO CONFIRM A TRUNCATION:
🔸 Wave 5 shows 5 clear sub-waves but stops short of the Wave 3 extreme
🔸 Strong momentum divergence on RSI or MACD into the high
🔸 Price reverses sharply right after Wave 5 ends
WHAT IT MEANS FOR YOUR TRADE:
🔸 IF YOU ARE LONG: Tighten stops or take profit. The trend is likely over.
🔸 IF LOOKING TO REVERSE: A truncation signals a strong reversal setup forming.
WARNING: Do not assume truncation early. Only confirm it after the fact, once price reverses hard. Forcing a truncation count too soon leads to bad trades.
DAY 12 KEY TAKEAWAYS:
🔹 Truncation is a failed Wave 5
🔹 It does not exceed the Wave 3 high
🔹 It signals an exhausted trend
🔹 Expect a sharp reversal after
Next: Day 13 | Module 2 Review
#ElliottWave #Truncation #ImpulseWaves

13
15
250
13,313
$SUI From $0.70 to $10 This Cycle? 🚀
The #SUI Growth Story Is Becoming Hard To Ignore.
Explosive Ecosystem Expansion, Rising TVL, Growing User Adoption, And Increasing Institutional Interest Are Positioning SUI As One Of The Strongest Layer-1 Narratives In Crypto.
Accumulation Zone: $0.70 – $0.50
Targets: $5 | $10 | $20
If Network Growth Continues At This Pace, $SUI Could End Up Being One Of The Biggest Winners Of The Cycle.
Not Financial Advice. Always DYOR.
@SuiNetwork
13
22
263
8,266
$XTZ Update: I Called The #XTZ Crash. Now I'm Eyeing 2,000% Upside From The Bottom
The Breakdown Played Out Exactly As Expected.
Back on March 31st, I warned that XTZ/USDT had confirmed a bearish HTF breakdown and could see up to 59% downside from the breakdown level.
Since then:
✅ Breakdown confirmed
✅ Price dumped nearly 50% from the short-entry zone
✅ Bearish structure played out almost exactly as projected
Now the interesting part begins.
While most investors are panic selling, I'm starting to watch for long-term accumulation opportunities.
High-Risk Accumulation Zone: $0.20 – $0.16
At these levels, $XTZ would be trading nearly 98% below its all-time high of $9.17.
Long-term targets remain unchanged: $0.64 → $1.30 → $4 → $5
If a true Altseason arrives, I believe $XTZ has the potential to reclaim much higher levels over time.
The key is patience.
Most people buy after a 500% pump.
Smart money looks for opportunities after a 97% crash.
Will $XTZ become one of the biggest comeback stories of the next cycle?
TA Only. Not Financial Advice. Always DYOR.
#Tezos @tezos
Mar 31
Everyone Ignored $XTZ After A -96% Crash. The Potential Upside From Here Is 5,538%
#XTZ Has Broken Its HTF Descending Channel, Confirming A Bearish Structural Shift With Potential 30%–60% Downside From Current Levels. However, From A Long-Term Perspective, Price Is Entering A High-Risk Accumulation Zone Suitable For Gradual Positioning.
Technical Structure
✅ Previous Cycle ATH: $9.17 (Macro Liquidity High)
✅ Macro Correction: −96.35% Into Current Range (~$0.34)
✅ Multi-Year Descending Channel Breakdown Confirmed
✅ Post-Breakdown Impulse: -30% - 59% Down Side Move Into HTF Demand
✅ Weak Retest Rejection Confirms Bearish Continuation Structure
✅ Lower High Formation Maintains HTF Bearish Bias
✅ High-Risk Accumulation Zone: $0.20–$0.16
✅ Major S/R Flip: $0.6418 (Bullish Above / Bearish Below)
✅ Resistance Stack: $0.446 → $0.6418 → $1.30 → $3.98
✅ Risk Invalidation: Sustained Acceptance Below $0.17
➡️ 2021 Expansion: Rally To ATH ~$9.17
➡️ 2022–2026: −96% Multi-Year Corrective Phase
➡️ Current Price: ~$0.34 (Accumulation Range)
➡️ Current Phase: Post-Distribution → Early Accumulation
Structure Shift Requirements
1️⃣ Weekly Close Above $0.6418 (HTF S/R Flip)
2️⃣ Break Of Descending Structure (LH → HH Transition)
3️⃣ Acceptance Above $1.30 For Expansion Confirmation
Bull Cycle Targets (If Structure Shifts): $0.6418 → $1.30 → $3.98 → $10
Invalidation: Continued Rejection Below $0.6418 Failure To Hold $0.17 Demand
The $0.20–$0.16 Region Represents A High-Risk Accumulation Zone For XTZ/USDT. Bearish Structure Remains Intact Until HTF Reclaim Confirms Trend Reversal.
TA Only. Not Financial Advice. ALWAYS DYOR.
@tezos

12
13
221
11,422
Throwback to May 8
🇺🇸 Trump: "Go out and buy $DELL. They’re great."
DELL Stock is up 100% Since Then.....

11
11
238
10,613
ELLIOTT WAVE MASTERY COURSE | MODULE 2: IMPULSE WAVES | DAY 12
TRUNCATION AND FAILURES: When Wave 5 Falls Short
Sometimes Wave 5 runs out of steam before making a new high.
This failure is a powerful warning of reversal.
UNDERSTANDING TRUNCATION:
A truncation (or failure) is when Wave 5 completes its five sub-waves but fails to exceed the end of Wave 3. The expected new high or low never arrives.
STILL A VALID WAVE 5
It still subdivides into 5 clean sub-waves. It just falls short of the Wave 3 extreme.
FOLLOWS A STRONG WAVE 3
Truncation usually appears after a powerful, extended Wave 3 that used up momentum.
SIGN OF WEAKNESS
The market lacked the strength for a new extreme. Buyers or sellers are exhausted.
RARE BUT IMPORTANT
Truncations are uncommon, but when they appear they carry a strong message.
THE WARNING IT SENDS:
A truncated fifth often leads to a swift and severe reversal, because the trend ended weaker than expected.
HOW TO CONFIRM A TRUNCATION:
🔸 Wave 5 shows 5 clear sub-waves but stops short of the Wave 3 extreme
🔸 Strong momentum divergence on RSI or MACD into the high
🔸 Price reverses sharply right after Wave 5 ends
WHAT IT MEANS FOR YOUR TRADE:
🔸 IF YOU ARE LONG: Tighten stops or take profit. The trend is likely over.
🔸 IF LOOKING TO REVERSE: A truncation signals a strong reversal setup forming.
WARNING: Do not assume truncation early. Only confirm it after the fact, once price reverses hard. Forcing a truncation count too soon leads to bad trades.
DAY 12 KEY TAKEAWAYS:
🔹 Truncation is a failed Wave 5
🔹 It does not exceed the Wave 3 high
🔹 It signals an exhausted trend
🔹 Expect a sharp reversal after
Next: Day 13 | Module 2 Review
#ElliottWave #Truncation #ImpulseWaves
Jun 11
ELLIOTT WAVE MASTERY COURSE | MODULE 2: IMPULSE WAVES | DAY 11
EXTENSIONS: When One Wave Stretches Far
In most impulses, one wave grows much larger than the others.
That stretched wave is called an extension.
WHAT IS AN EXTENSION:
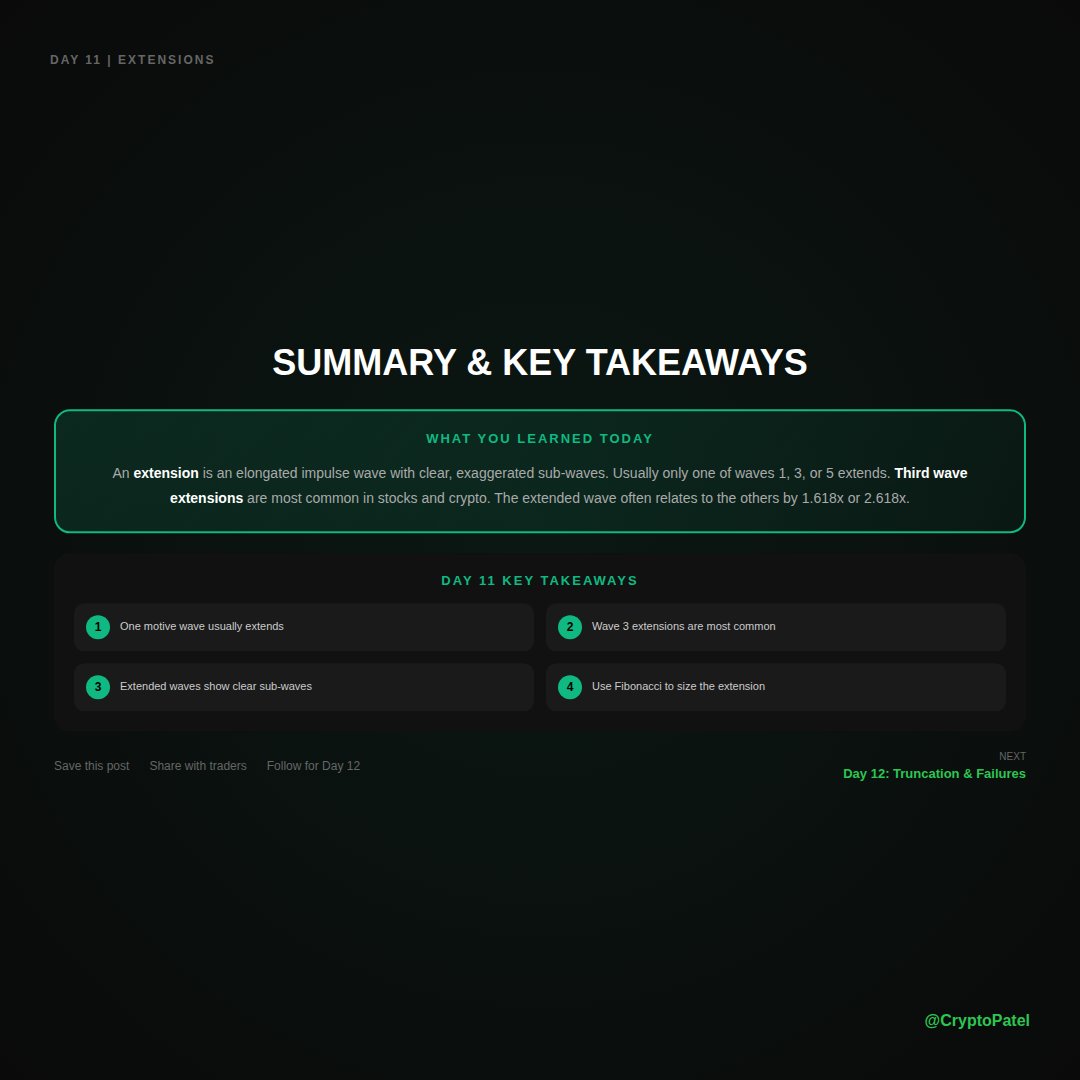
An extension is an elongated impulse wave with clearly visible, exaggerated sub-waves. Usually only one of the three motive waves (1, 3, or 5) extends in any given impulse.
WHICH WAVE EXTENDS:
🔹 THIRD WAVE EXTENSION (Most Common)
Most common in stocks and crypto. Wave 3 becomes the dominant, longest leg.
🔹 FIFTH WAVE EXTENSION (Occasional)
Common in commodities. The final push stretches out into a long leg.
🔹 FIRST WAVE EXTENSION (Rare)
The rarest. Wave 1 becomes the longest leg of the whole impulse.
HOW TO IDENTIFY AN EXTENSION:
🔸 One wave is clearly longer than the other two
🔸 Its 5 sub-waves are easy to see
🔸 The other waves look small by comparison
🔸 Total move can appear as 9 waves
EXTENDED WAVE FIBONACCI SIZE:
1.618x of smaller waves
2.618x common extension
4.236x strong extension
KEY INSIGHT:
When two of the three motive waves are roughly equal in length, the third is usually the extended one. This helps you project realistic targets for the big move.
DAY 11 KEY TAKEAWAYS:
🔸 One motive wave usually extends
🔸 Wave 3 extensions are most common
🔸 Extended waves show clear sub-waves
🔸 Use Fibonacci to size the extension
Next: Day 12 | Truncation & Failures
#ElliottWave #Extensions #ImpulseWaves


13
10
221
12,803
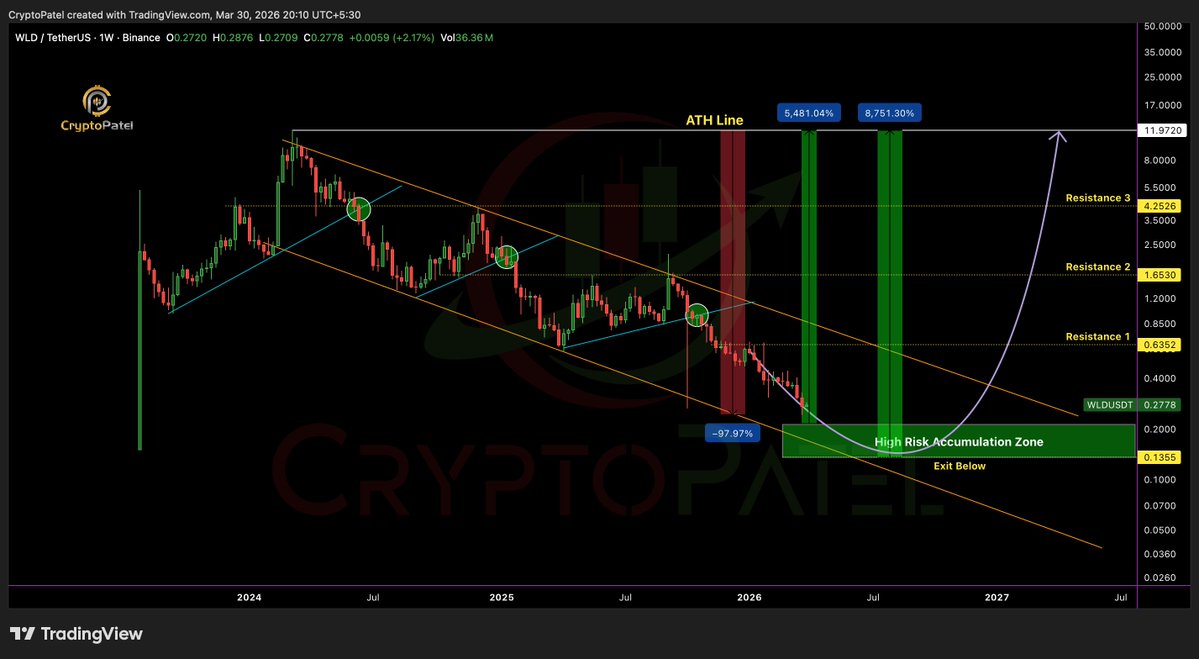
$WLD Hit My Accumulation Zone And Exploded 180% - Is $10 Still Possible?
Update On #WLD: Our Accumulation Zone Played Out Perfectly.
Back on March 31st, I highlighted the $0.24 - $0.14 accumulation zone as a high-risk, high-reward opportunity.
Since then:
✅ Accumulation zone filled
✅ Price rallied to $0.6317
✅ Currently trading near $0.50
✅ Up roughly 180% from our entry zone
Many laughed when $WLD was down ~98% from its ATH.
Now the market is starting to pay attention.
The best part?
Long-term targets remain unchanged: $0.63 → $2 → $5 → $10
For swing and scalp traders, taking partial profits after a 180% move is completely reasonable.
For long-term investors, the bigger trend may only be getting started.
Hope you're enjoying the ride and sitting on solid profits.
Not Financial Advice. Always Manage Risk.
#Worldcoin @worldcoin
Mar 31
$WLD Down 98% From ATH: Is This The Best Entry For An 8700% Potential Return?
#WLD Is Currently Trading Inside A Macro Descending Channel, Sitting In A High-Risk Accumulation Zone After A ~98% Correction From Its ATH, Positioning Price At A Critical Accumulation vs Invalidation Level.
Technical Structure
✅ Previous Cycle ATH: $11.97 (Macro High)
✅ Macro Correction: -98% From ATH Into Current Accumulation Range
✅ Multi-Year Descending Channel With Clear Lower Highs & Lower Lows
✅ HTF Accumulation Zone: $0.22 - $0.14
✅ Price Compressing Near Channel Support (Potential Base Formation)
✅ Strong Rejections From Dynamic Trendline Resistance
✅ No Confirmed Bullish BOS Yet (Structure Still Bearish)
✅ Bullish Structure Valid Only On Reclaim And Hold Above $0.66
✅ Risk Invalidation: Weekly Close Below $0.130
Cycle Context
➡️ Expansion Phase: Rally To $12 ATH
➡️ Distribution & Downtrend: Continuous LH Formation
➡️ 2024-2026: -98% Corrective Accumulation Phase
➡️ Trendline Resistance Acting As Strong Rejection Zone
Key Levels
👉 HTF Demand: $0.22 - $0.14 (High Risk Accumulation Zone)
👉 Breakdown Confirmation: Weekly Close Below $0.130
👉 Trend Reclaim: $0.66 (Channel Breakout Trigger)
Bull Cycle Targets $0.63/$2/$5/$10
Invalidation: Weekly Close Below $0.130
The $0.22–$0.14 Region Represents A High-Risk HTF Accumulation Zone For WLD/USDT Ahead Of A Potential Long-Term Expansion Phase.
TA Only. Not Financial Advice. Manage Risk.
@worldcoin @worldcoinfnd #Worldcoin
12
16
254
10,586
Let me tell you about someone I know personally.
He put $10,000 into altcoins during the 2023 accumulation phase. Patient entry, solid reasoning, good risk management at the start.
Over the next several months, that $10,000 grew to $78,000. Nearly an 8x. Real life-changing money by any measure.
He never took out a single dollar.
The reason? He set a mental target of $1,00,000. At $78k, he was 28% away from that number. It felt close. It felt inevitable. One more leg up and he would be there.
The market did not agree.
That portfolio is $3,200 today.
I am not sharing this to shame him because he is genuinely smart and this trap catches smart people every single cycle. There is actually a name for what happened to him. It is called Round Number Anchoring. The human brain assigns emotional significance to clean numbers like $1,00,000 or $50,000. So $78,000 feels incomplete. Unfinished. Like you stopped one step short of the real destination.
That feeling is not intuition. It is a cognitive bias. And the market exploits it with precision.
Here is the thing that hurts most when I look at his situation. A very basic exit strategy would have completely changed his outcome. If he had sold just 25% of his position every time he hit a major multiple, here is what the math looks like:
Sell 25% at 4x: $10,000 locked in. Original capital fully recovered. Everything else is house money.
Sell 25% at 6x: Another $15,000 out.
Sell 25% at 7.5x: Another $18,750 out.
Final 25%: Let it ride to whatever target you want.
That is $43,750 in his bank account regardless of what the market does next. The remaining position could go to zero and he still comes out ahead on the entire trade.
Instead, he held 100% waiting for the perfect exit. And the perfect exit never came.
This is the part most retail traders never fully internalize: a number on a screen is not profit. It is not yours until you sell. The portfolio value you see at the peak exists for a moment. The cash you withdraw exists permanently.
Three rules I think every trader needs to build into their system before the next cycle heats up:
One. Define your exit plan before you enter the trade. Not at 5x when emotions are running. Not at the peak when greed sounds like conviction. Before.
Two. Always take out your original capital first. Once your principal is recovered, you are playing with profit. The psychological shift that creates is massive and it protects you from the worst outcomes.
Three. Never let a winning trade become a losing one because you refused to take anything off. Selling early is painful. Watching $78,000 become $3,200 is permanent.
The best traders are not the ones who find the perfect entry. They are the ones who actually get paid.
NFA & DYOR
15
15
262
10,174
17
14
239
8,730
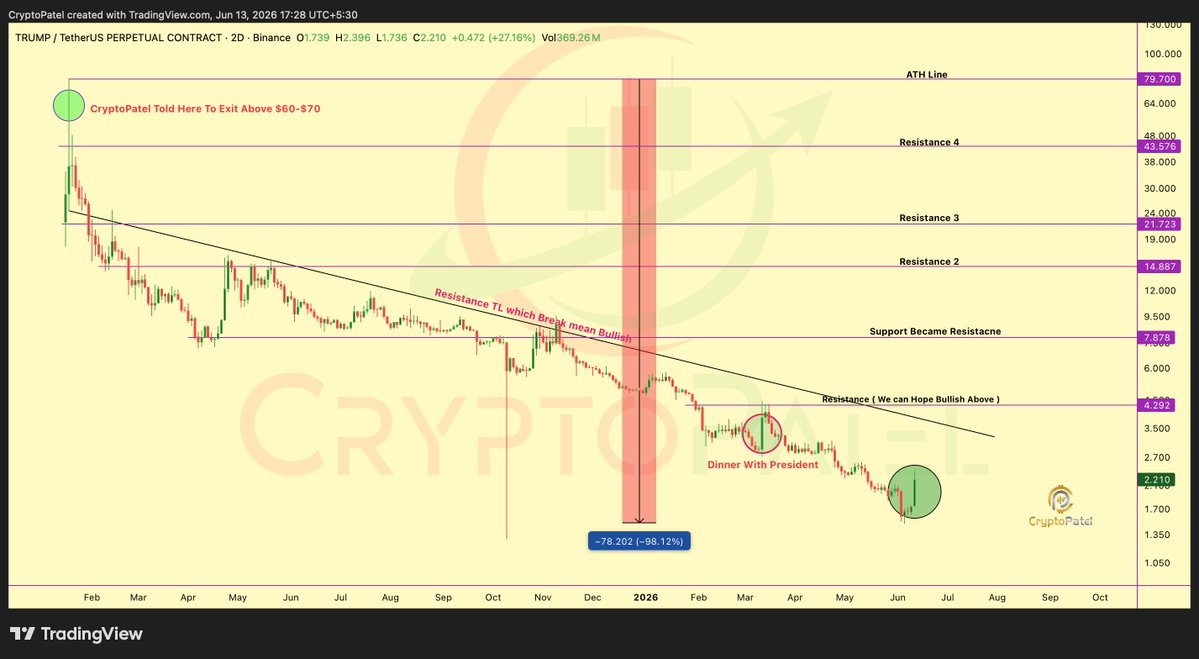
CT: $TRUMP IS MOONING 🚀
Meanwhile The Chart:
Still down so much that early buyers are probably wondering if this rally is even visible on the monthly chart. 😂
22
18
252
10,466
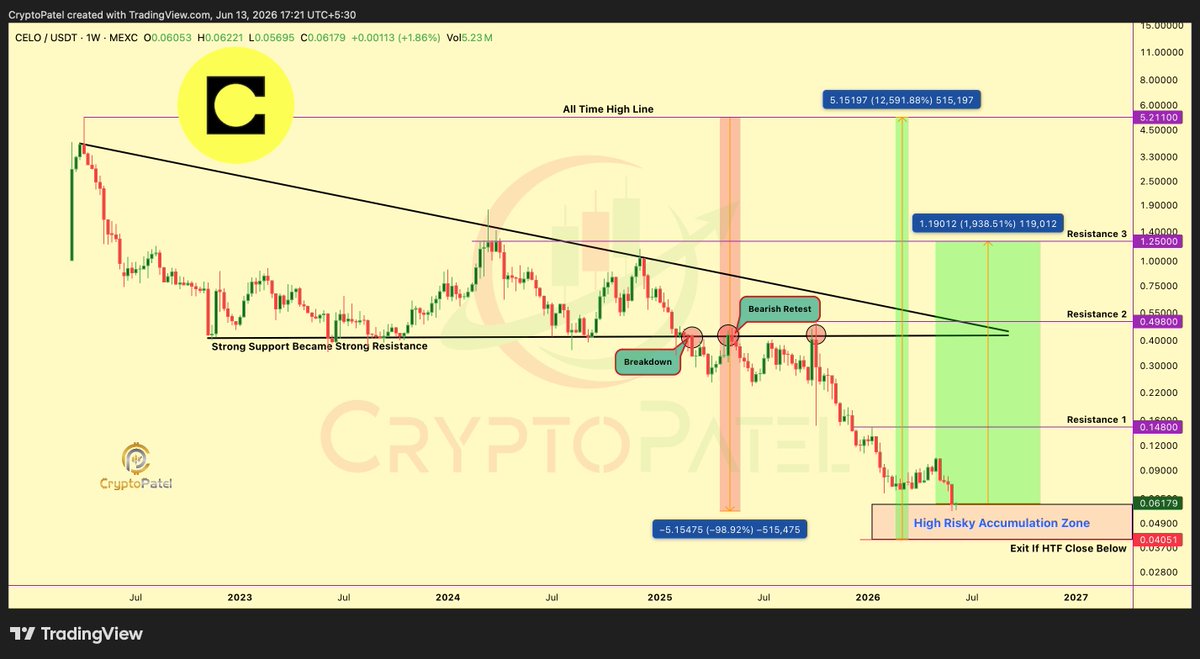
Update on $CELO: From my previous update, $CELO has now entered the accumulation zone, but I've slightly adjusted my buying range.
New Accumulation Zone: $0.060 – $0.040
Targets: $0.15 | $0.30 | $0.50 | $1
#CELO is already down nearly 99% from its all-time high, which makes this a very high-risk, high-reward setup.
Never assume a bottom is guaranteed. Manage your risk, do your own research, and only invest what you can afford to lose.
Not Financial Advice. ALWAYS DYOR.
@Celo #CELO
Apr 13
$CELO Is Being Accumulated So Deep That A 6,860% Move Could Be Back On The Table 🚀
Entry Zone: $0.07 – $0.055
Targets: $0.15 | $0.5 | $1.25 | $3 | $5
Save This and Share It With Your Friends.
Not Financial Advice. ALWAYS DYOR.
@Celo #CELO

19
20
241
9,813
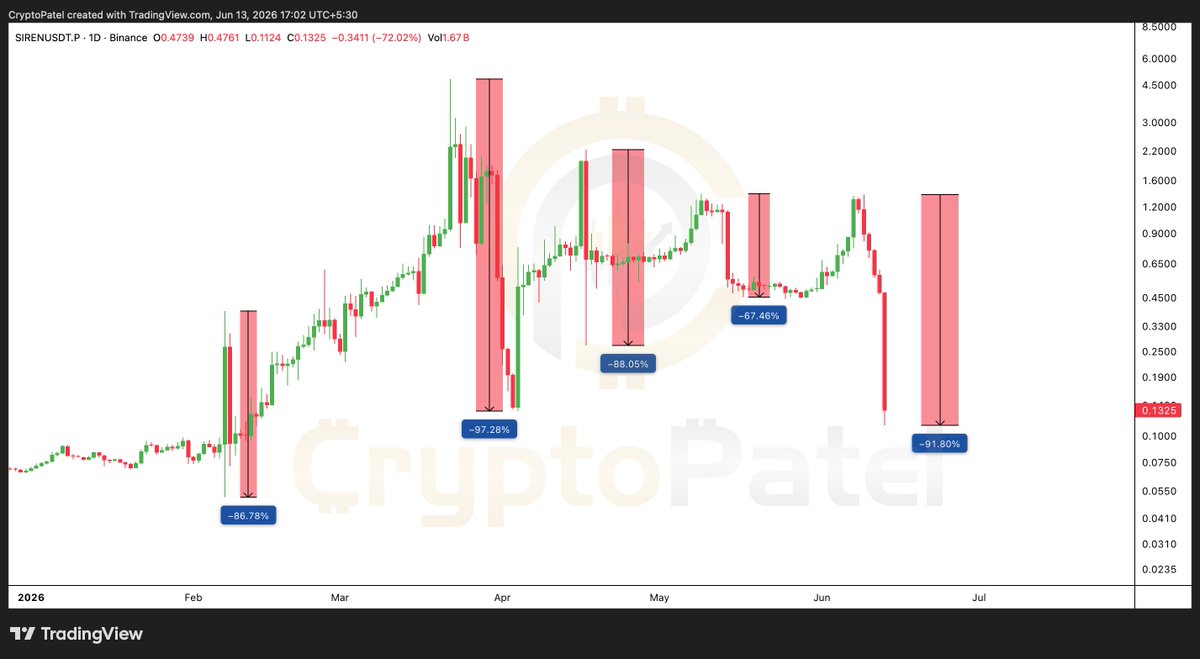
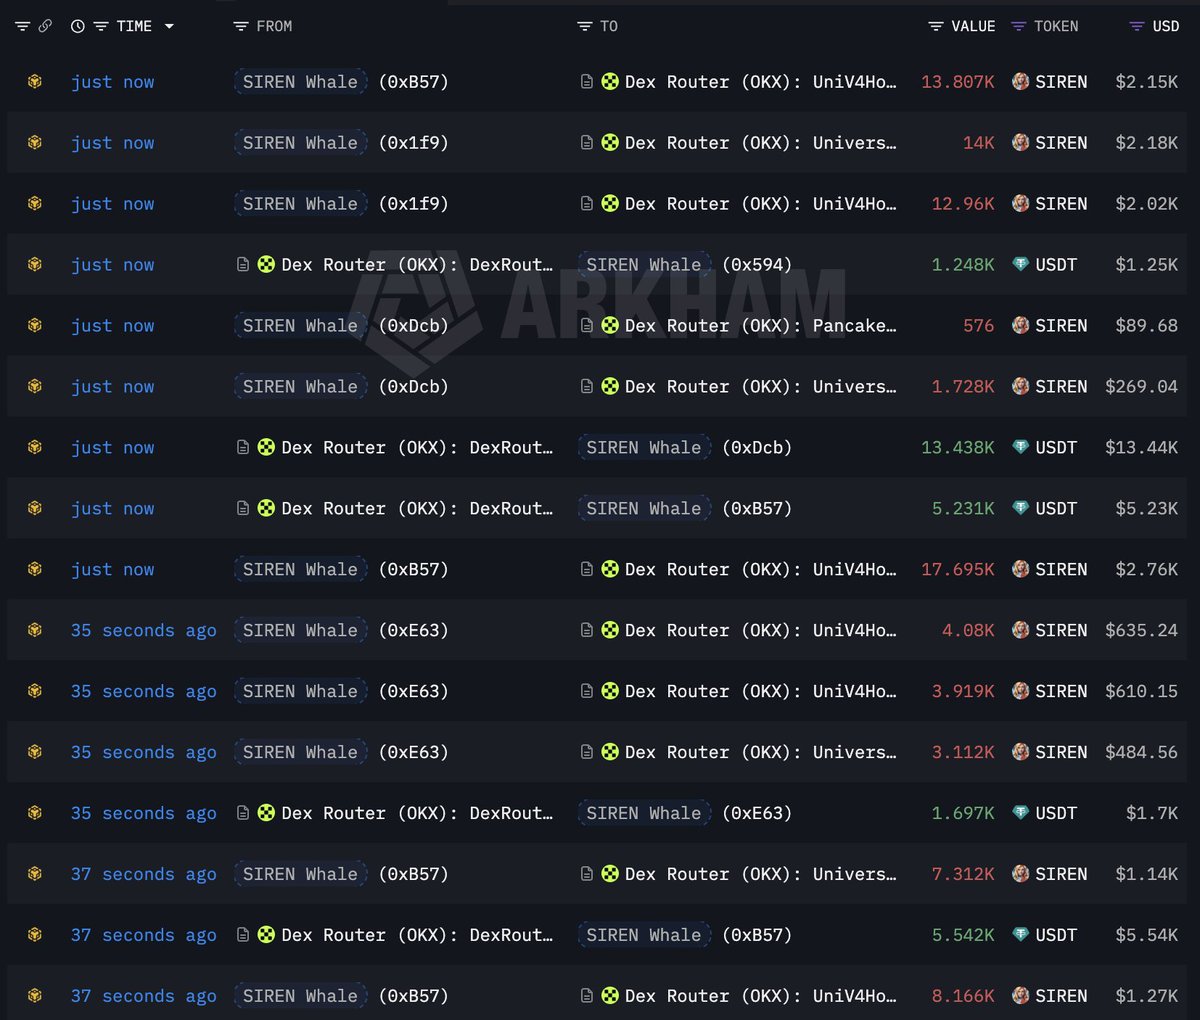
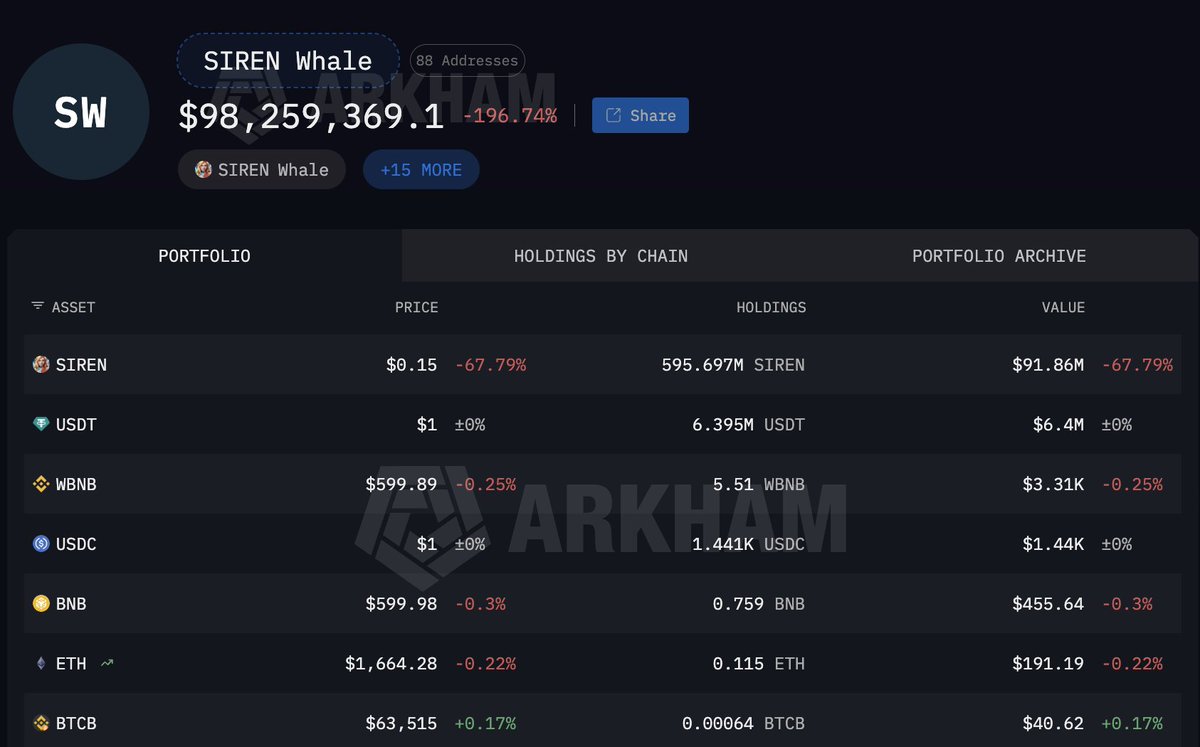
Shit Show in Crypto Continues: $SIREN Crashed Another 90% in Just the Last 5 days.
🔹 $760M wiped from market cap
🔹 $2.4M in longs liquidated
🔹 Triggered after a top holder dumped $7.5M worth of tokens
🔹 Selling pressure is still ongoing
🔹 The same wallet still holds 595M SIREN, around 82% of the circulating supply
What's Even Crazier?
Just days earlier, $SIREN had pumped over 200% in only 10 days, adding more than $600M in market cap.
2026 alone has already seen multiple SIREN crashes:
🔴 -87% ( 7-8 Feb 2026 )
🔴 -97% ( 22 March - 3 April 2026 )
🔴 -88% ( 17 April 2026 )
🔴 -67% ( 9-17 May 2026 )
🔴 -90% ( 9-12 June 2026 )
At what point do we stop calling this volatility and start calling it what it is?
🤔
21
12
231
8,850
Jun 13
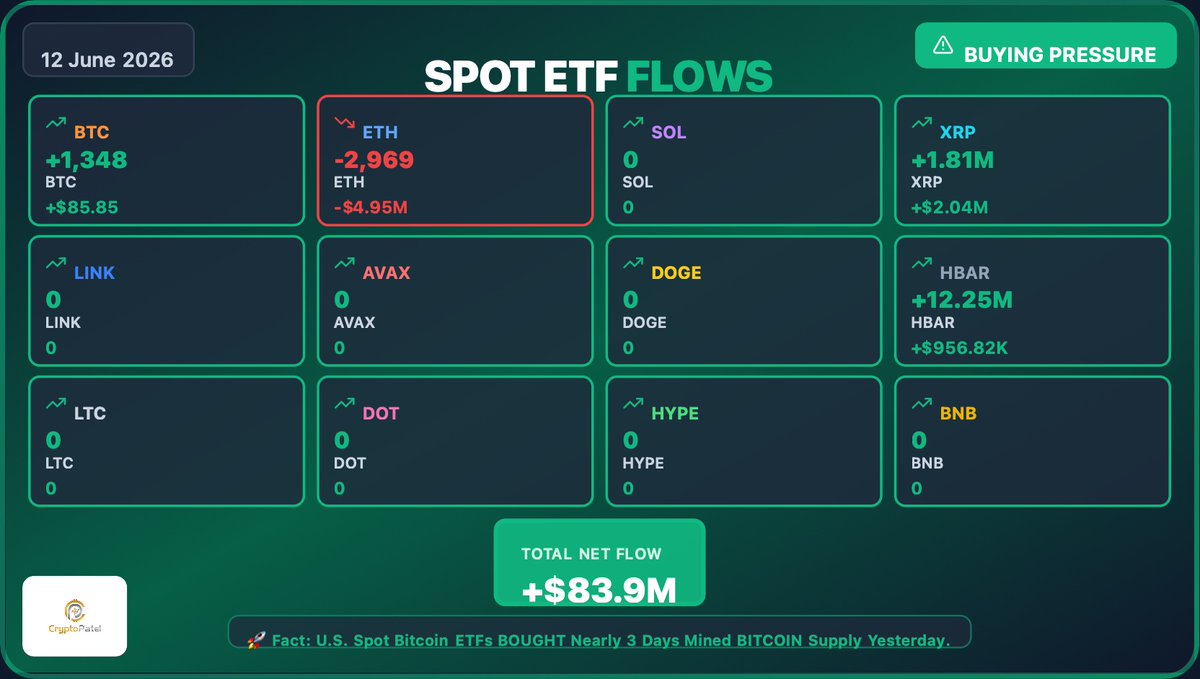
ETF FLOWS: US SPOT CRYPTO ETFs FLOWS DATA UPDATE (12-06-2026) YESTERDAY
🟩 Bitcoin ETFs: 1,348 $BTC ( $85.85M)
🟥 Ethereum ETFs: -2,969 $ETH (-$4.95M)
🟩 XRP ETFs: 1.81M $XRP ( $2.04M)
🟩 HBAR ETFs: 12.25M $HBAR ( $956.82K)
🟩 $SOL, $HYPE, $BNB, $LTC, $LINK, $AVAX, $DOGE, $DOT Flows Was Zero.
TOTAL US SPOT CRYPTO ETFs INFLOW: ≈ $83.9M
U.S. BITCOIN ETFs BOUGHT ~1,348 BTC Worth $85.85M
🇺🇸 BlackRock ETF Has BOUGHT ~906 BTC for $57.69M And SOLD 2,720 ETH for $4.53M
🇺🇸 Fidelity ETF Has BOUGHT 283 BTC for $18M And SOLD 249 ETH for $415.23K
🇺🇸 Wisdom Tree ETF Has BOUGHT 16 BTC for $0.98M
🇺🇸 Bitwise ETF Has BOUGHT 81 BTC for $5.18M
🇺🇸 ARK 21Shares ETF Has BOUGHT 50 BTC for $3.17M
🇺🇸 VanEck ETF Has BOUGHT 28 BTC for $1.80M
Fact: U.S. Spot Bitcoin ETFs BOUGHT Nearly 3 Days Mined BITCOIN Supply Yesterday.
Jun 12
ETF FLOWS: US SPOT CRYPTO ETFs FLOWS DATA UPDATE (11-06-2026) YESTERDAY
🟥 Bitcoin ETFs: -299 $BTC (-$19.03M)
🟥 Ethereum ETFs: -9,440 $ETH (-$15.89M)
🟥 SOLANA ETFs: -65.45K $SOL (-$4.38M)
🟩 HYPE ETFs: 10.57K $HYPE ( $622.02K)
🟩 BNB ETFs: 389 $BNB ( $234.82K)
🟩 CHAINLINK ETFs: 127.37K $LINK ( $1.01M)
🟩 HBAR ETFs: 8.17M $HBAR ( $648.58K)
🟩 $XRP, $LTC, $DOGE, $DOT Flows Was Zero.
TOTAL US SPOT CRYPTO ETFs OUTFLOW: ≈ -$36.78M
U.S. BITCOIN ETFs SOLD ~299 BTC Worth $19.03M
🇺🇸 BlackRock ETF Has BOUGHT ~476 BTC for $30.26M And 5,130 ETH for $8.63M
🇺🇸 Fidelity ETF Has SOLD 87 BTC for $5.54M And 12,200 ETH for $20.53M
🇺🇸 Grayscale ETF Has BOUGHT 88 BTC for $5.62M And SOLD 2,370 ETH for $3.99M
🇺🇸 Wisdom Tree ETF Has BOUGHT 16 BTC for $0.98M
🇺🇸 Bitwise ETF Has SOLD 206 BTC for $13.12M
🇺🇸 ARK 21Shares ETF Has SOLD 428 BTC for $27.21M
🇺🇸 VanEck ETF Has SOLD 233 BTC for $14.84M
🇺🇸 Morgan Stanley Tree ETF Has BOUGHT 34 BTC for $2.19M
🇺🇸 Hashdex Tree ETF Has BOUGHT 57 BTC for $3.60M
Fact: U.S. Spot Bitcoin ETFs SOLD Nearly 0.7 Days Mined BITCOIN Supply Yesterday.

20
25
230
7,818
Jun 13
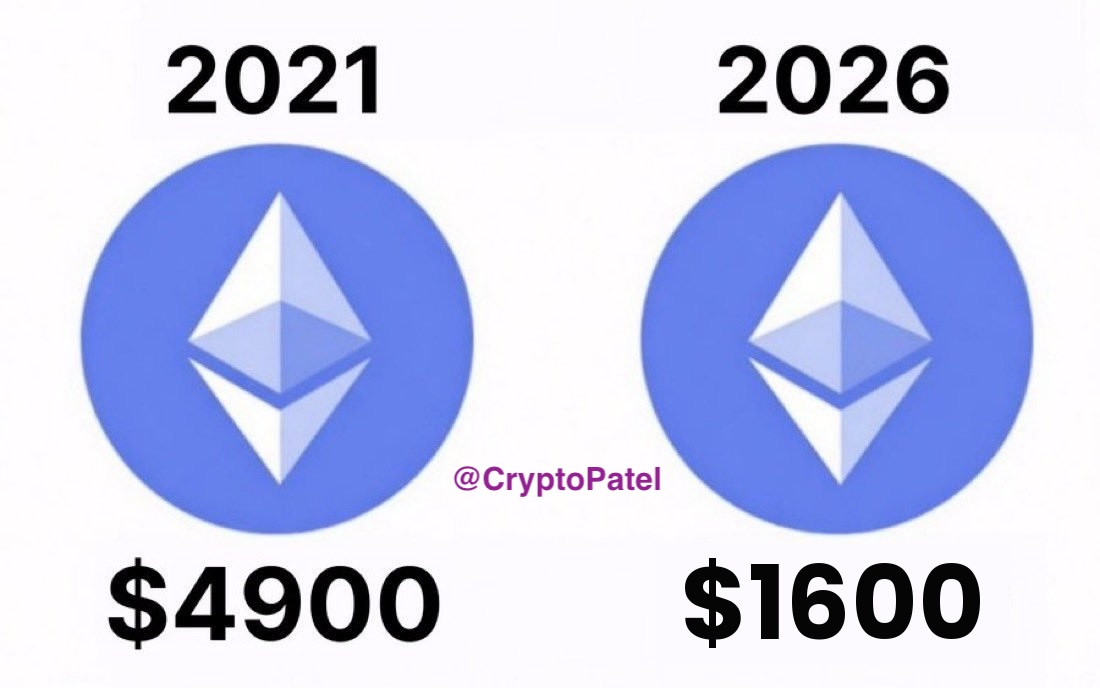
$ETH Accumulation Map (Zoomed Out):
🟢 $16,00 – $1,000 → Best Accumulation Zone
🔴 $4,700 → Major Resistance / Breakout Level
🎯 Targets: $10,000 → $15,000 → $20,000
24
38
383
15,391
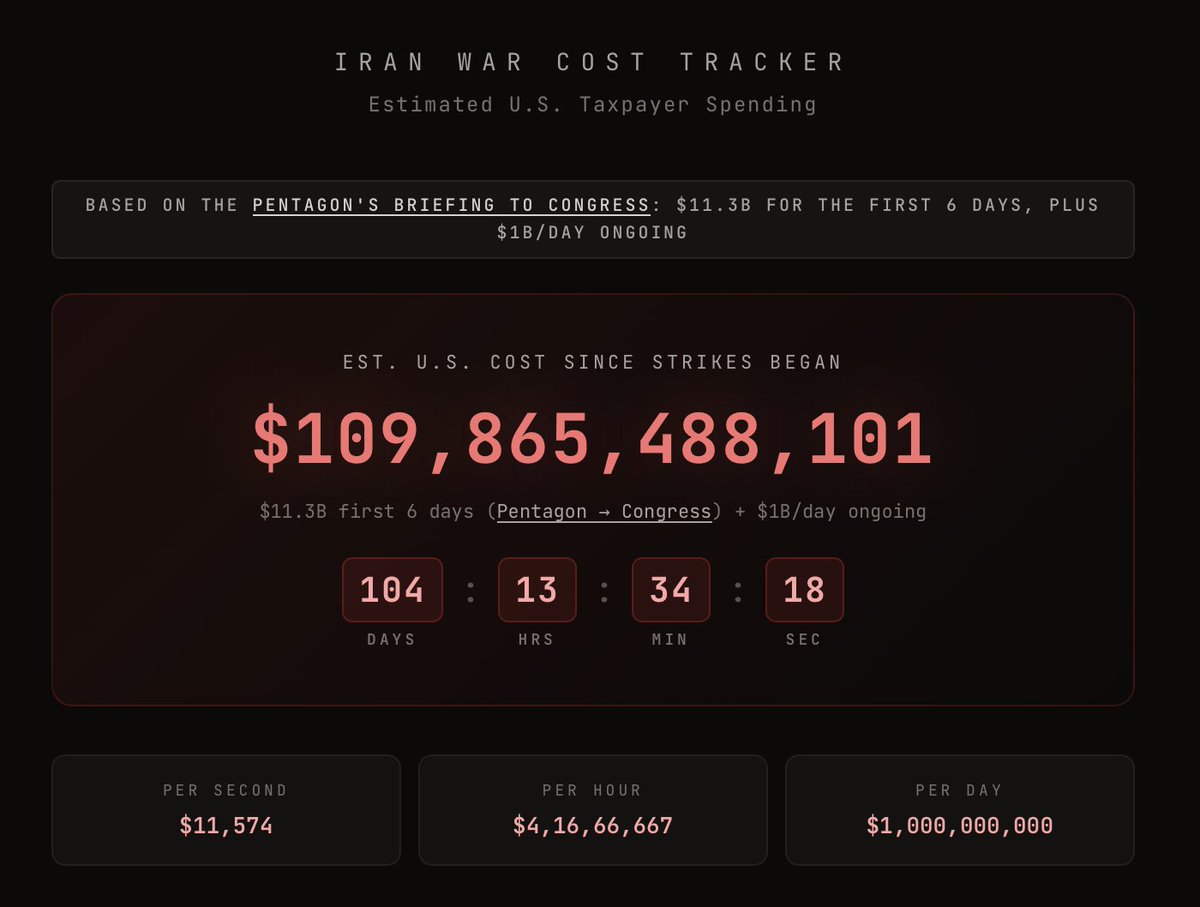
Jun 13
JUST IN: 🇺🇸🇮🇷 US war with Iran has now cost an estimated $110 Billion since strikes began, As Per Tracker
22
37
255
8,118