
I don't have a Telegram account and don't sell newsletters.
Joined April 2014
- Tweets 21,727
- Following 463
- Followers 57,906
- Likes 36,600
7,856 Photos and videos

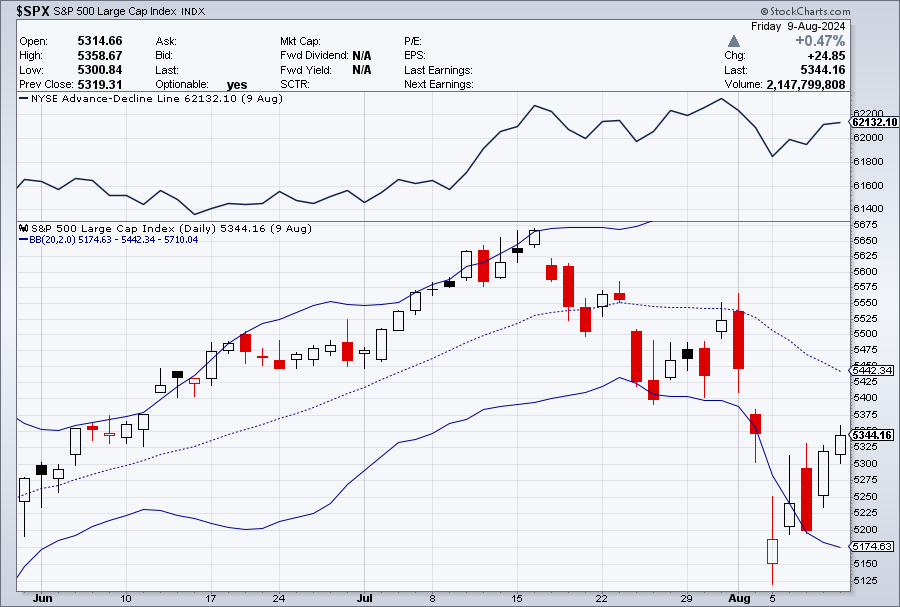

The NYSE A-D line has made a new high. This doesn't necessarily mean $SPX will follow with a new ATH. As an example we have July 2024. Both topped on July 16 and fell into July 24. On July 31 the A-D line made a new ATH while SPX hit its 20 day MA. SPX fell 6% in the next 3 days.
5
8
105
8,091
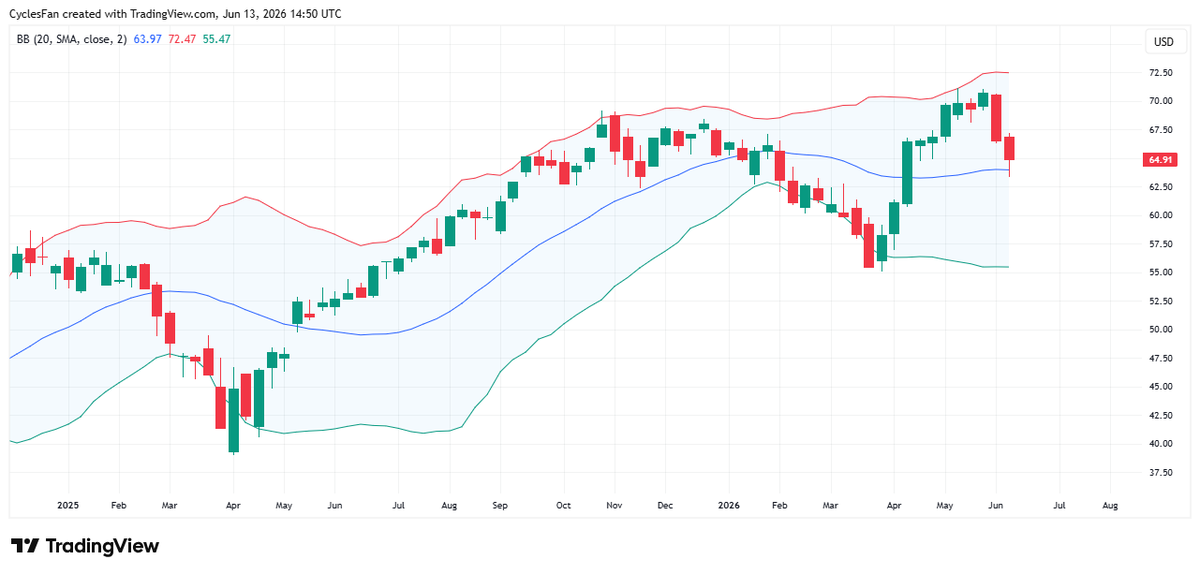
$MAGS - The 2 week decline found support at the 20 week MA. This could be a pullback that will lead to new highs or just an initial decline like the one in November, that will eventually lead to a much bigger decline. Losing the 20 week MA will lead to a retest of the March low.
3
7
59
4,741
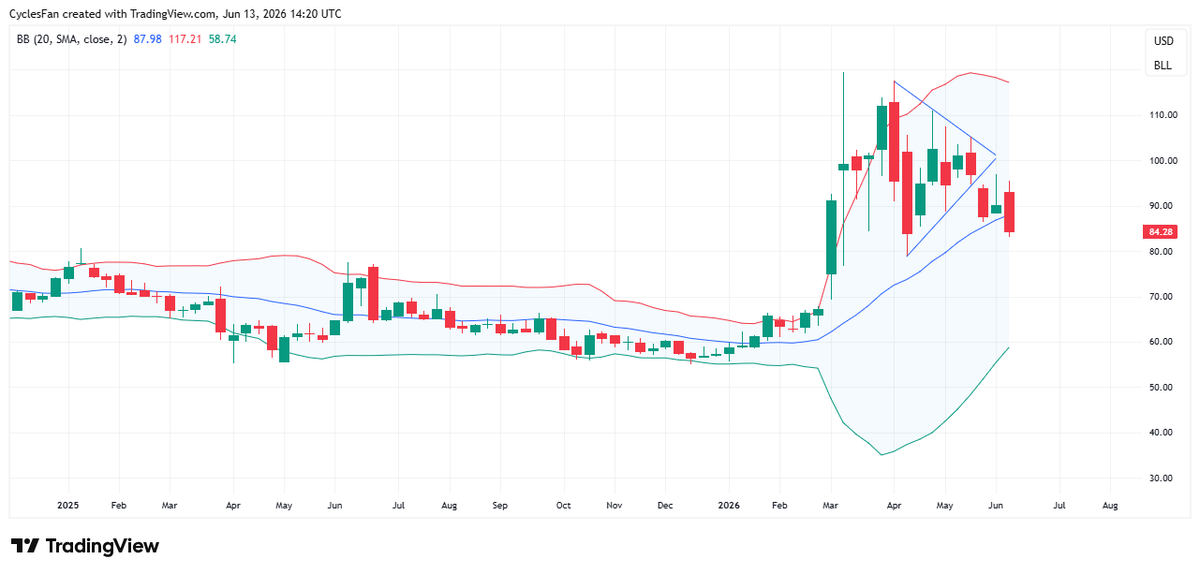
$USOIL - The price of crude oil indicates that there's likely to be some sort of deal with Iran because it closed the week below the 20 week MA which confirms the target of the triangle breakdown at $65.
15
13
99
10,110

Jun 13
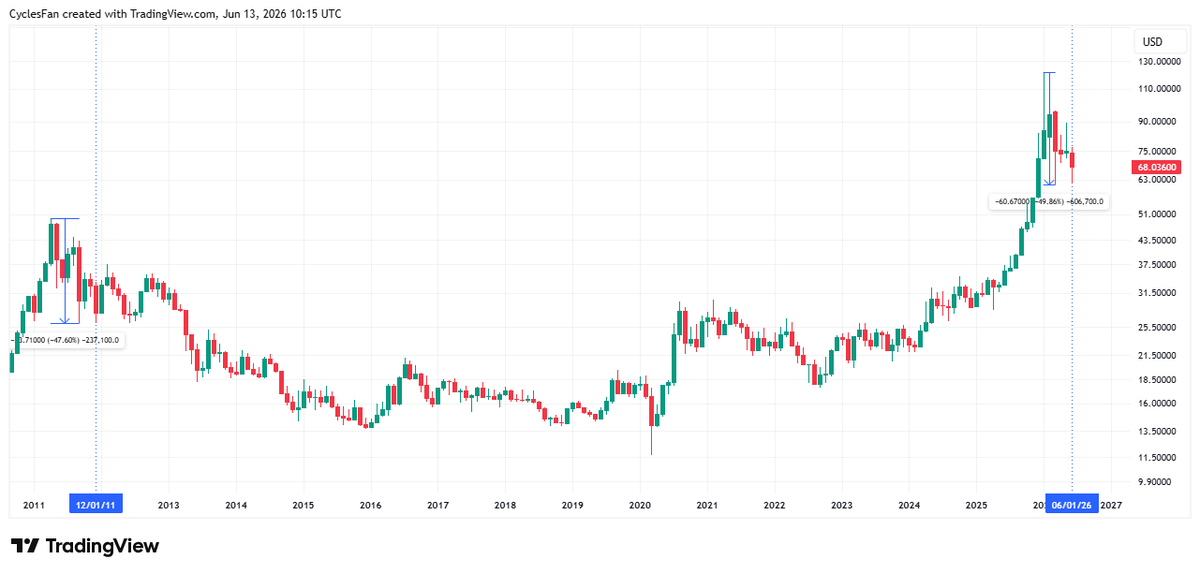
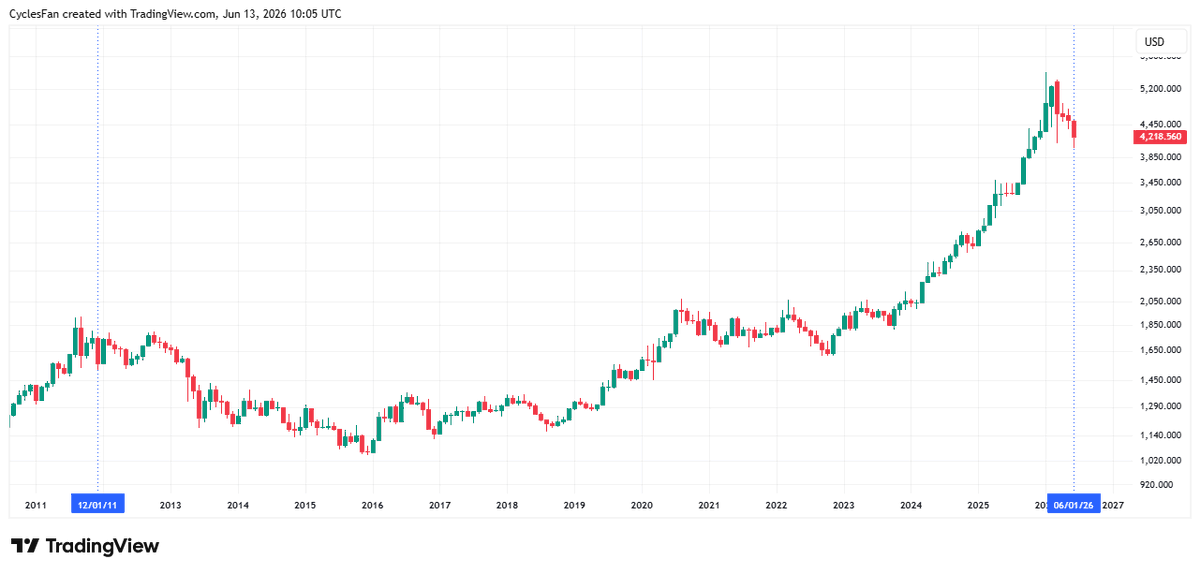
$Silver Deja vu.
2011: 48% crash, bounce, double bottom at $26.
2026: 50% crash, bounce, double bottom at $61.
What's next? a stronger bounce to as high as $94.
Silver bugs will keep fighting this bear market all the way to $30 at the next 7 year cycle low in late 2029.
14
18
150
11,865
Jun 13
$Gold may have made an intermediate term low this week. So far it's 2011 all over again. In September it bottomed at 1533, had a 4 week bounce, then fell to 1523 in December. In 2026 it bottomed at 4099 in March, had a 4 week bounce, then fell to 4024 in June. Now another bounce.
18
14
128
11,060
Jun 12
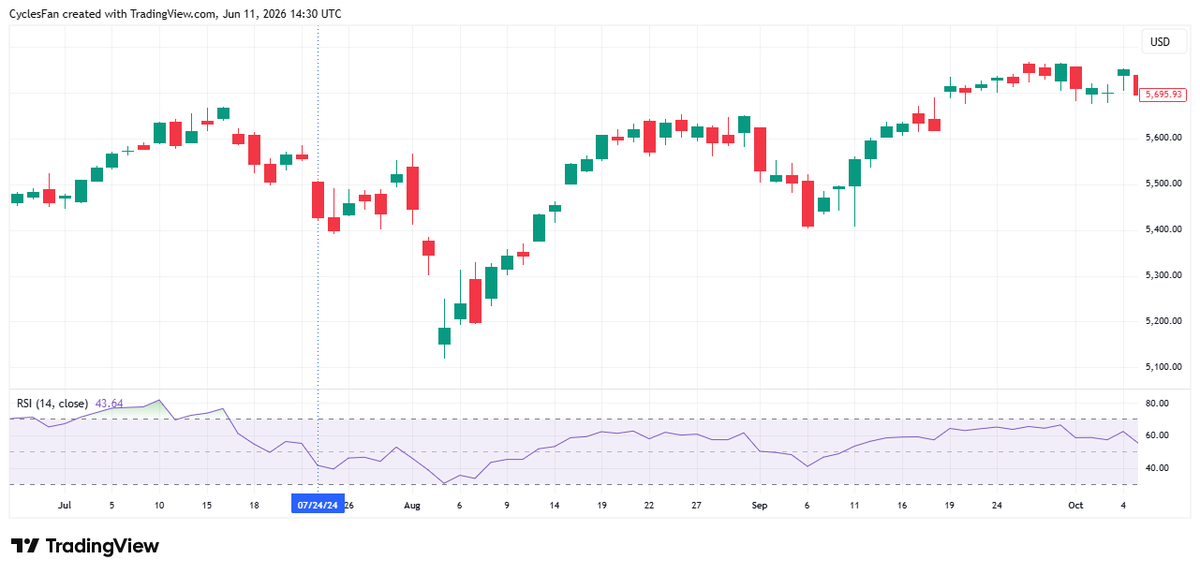
$SPX - Closed higher again today but it's still below the 20 day MA and didn't confirm that it bottomed. The RSI study from yesterday indicates that there's likely to be a 2nd down leg to this correction but 2 consecutive closes above the 20 day MA will invalidate more downside.
8
14
195
13,122
Jun 12
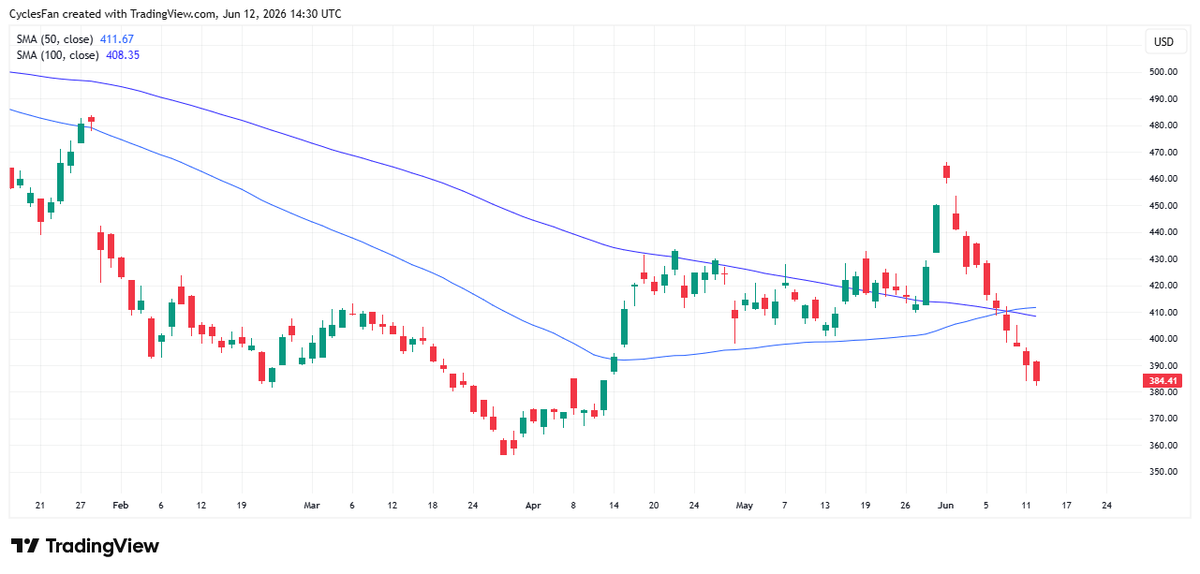
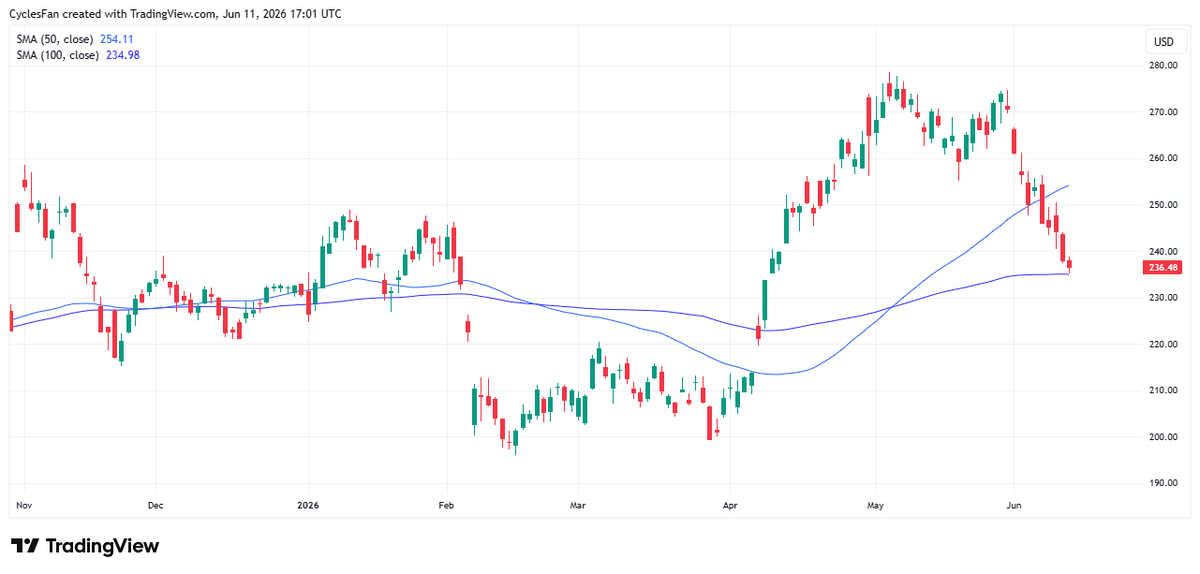
$MSFT - There have been 10 consecutive red candles since June 1st(not 10 down days, 2 of them were up days). It lost the 50 day and 100 day moving averages right after a bullish crossover. Now bearish on all timeframes.
15
15
128
16,210
Jun 12
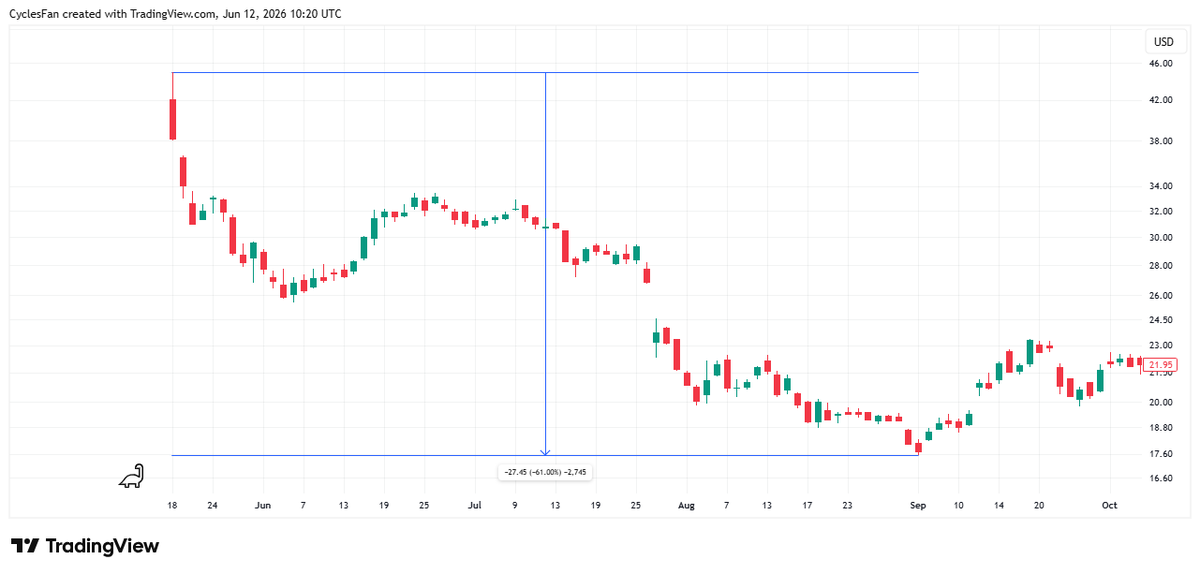
For those that are excited by $SPCX IPO, the most expensive IPO in history by far, here's a reminder of how META's IPO looked like in 2012, and it was much cheaper than SPCX is.
7
11
108
9,286
Jun 11
$SPX - I posted earlier how the 6 day decline in RSI at yesterday's low was similar to 07/24/24, but in terms of the interaction with the lower BB it's similar to 07/25/24. 4 days later it bounced to the 20 day MA and then fell into 08/05. Beware of a repeat of the same scenario.
4
13
141
9,624
Jun 11
$QQQ was up 3.3%, its 2nd biggest up day of the year after March 31. Despite that it's still below the 20 day MA. Trump is bullshitting as usual so the market isn't out of the woods yet. Two consecutive closes above the 20 day MA will confirm that it bottomed.
4
6
176
10,672
Jun 11
"Shortly" as in a year or two or never. x.com/FoxNews/status/2065125…

BREAKING: Trump reveals he canceled 'scheduled strikes and bombings' on Iran, time and place of potential deal-signing 'to be announced shortly'
5
38
6,972
Jun 11
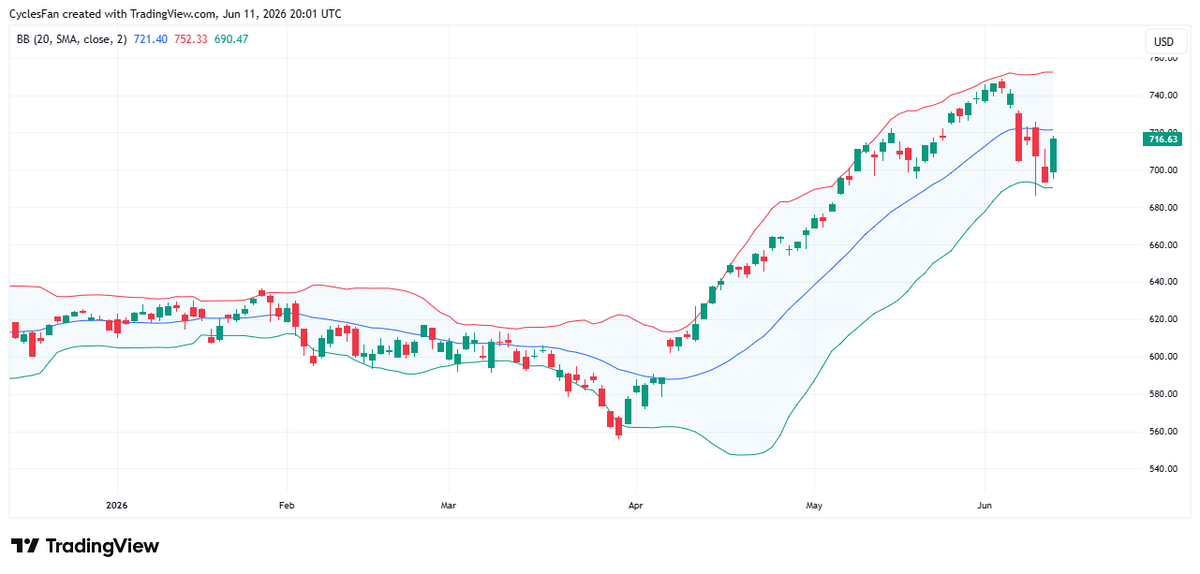
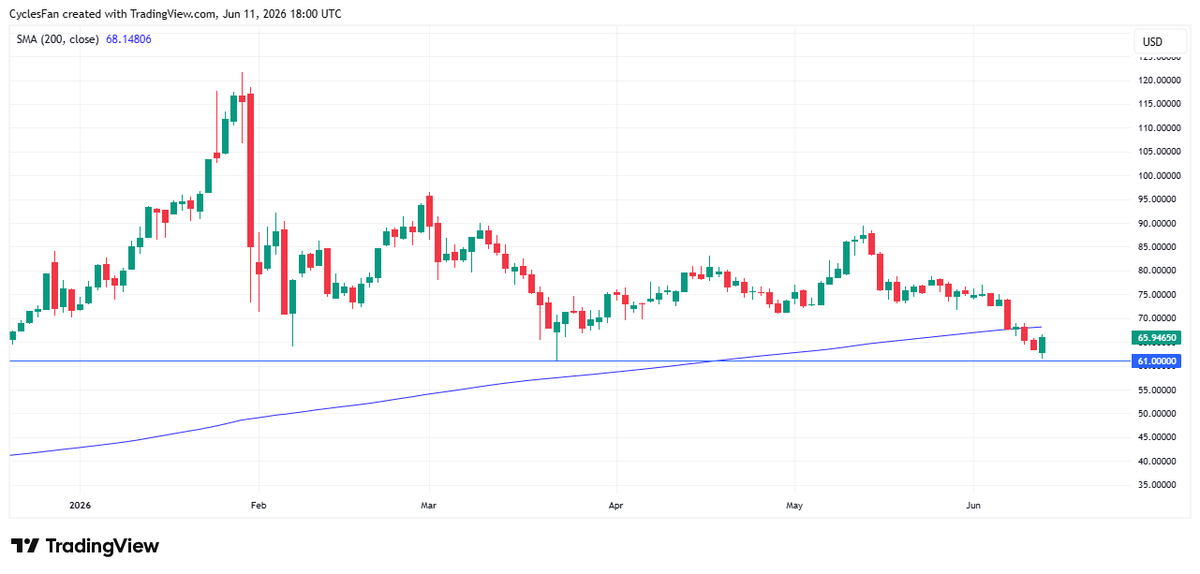
$Silver - Today's low was 61.50. That's close enough to be considered a retest of the March low. The daily candle turned into a bullish engulfing candle after the recent Iran news. It has to regain the 200 day MA in order to start confirming that it made an intermediate term low.
9
68
4,783
Jun 11
$AMZN that topped in early May has fallen all the way to its 100 day MA. That is the ideal level for it to reverse if it still wants to make a new ATH in Q3. A weekly close below the 100 day MA will confirm that it made an intermediate term top in May.
4
5
53
6,020
Jun 11
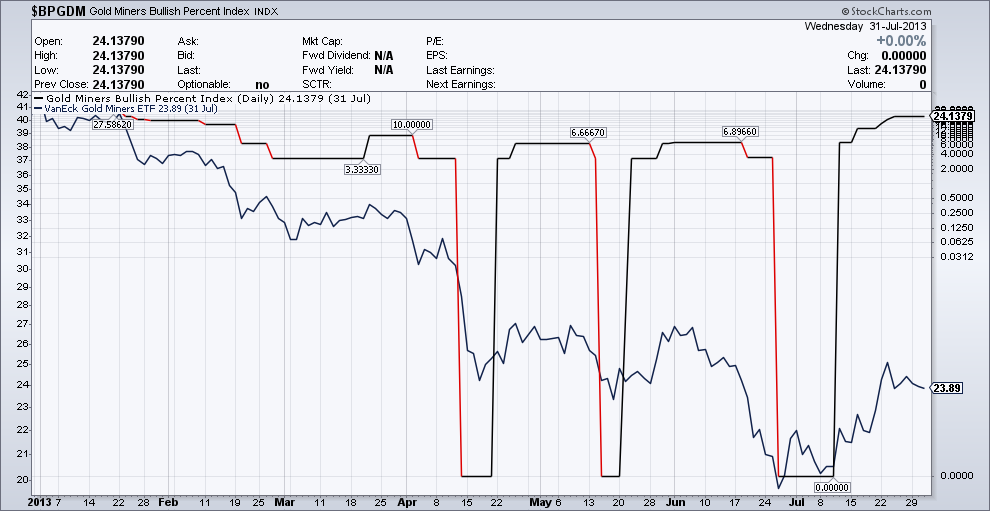
The gold miners bullish percent index closed at 0 yesterday. Does it mean an intermediate or even a short term low is imminent? Not necessarily. On 04/12/2013 $GDX closed at 32.22. It dropped to 27.38 3 days later, eventually making an int. term low at 22.22 only on 06/26/2013.
1
4
38
4,179
Jun 11
Do you want more bad news? I'm happy to oblige.
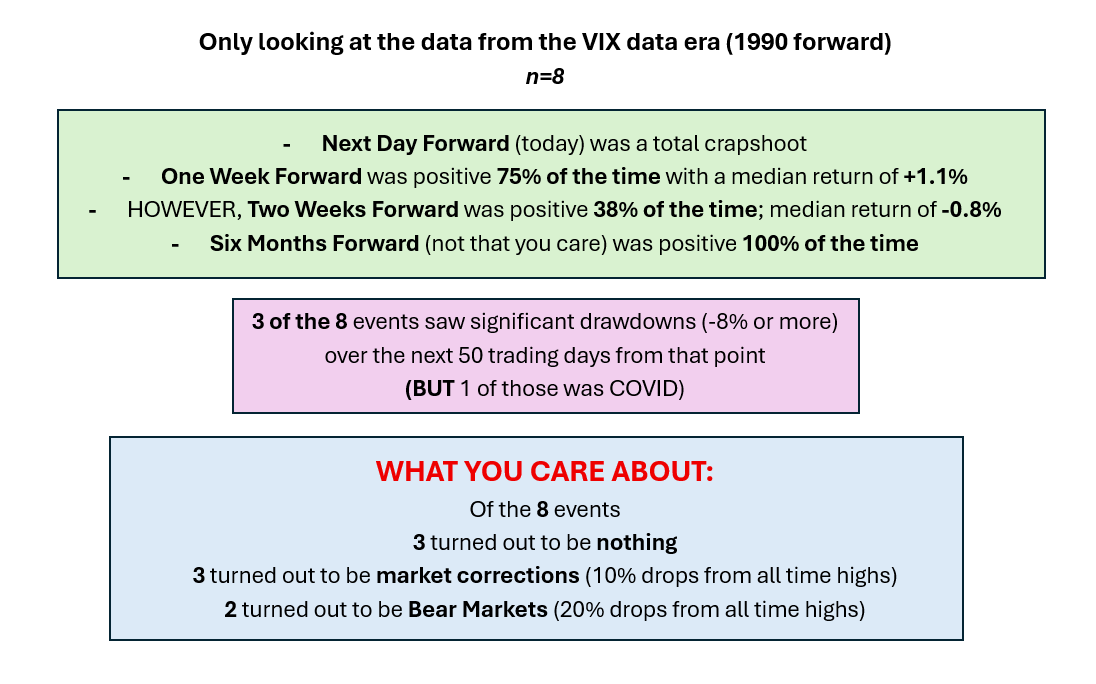
The last time RSI fell 34 points in 6 days was 07/24/2024. So, out of the 7 cases, 6 made lower lows. The minimal drawdown from the top was -7.6%
but in 5 out 6 it was at least 9.7%.
x.com/CyclesFan/status/20650…
Jun 11

Sorry, actually there was another case in this timeframe that matches the -34 points criteria, August 5, 2019. That's the only case in which SPX didn't make a lower low. In all other cases it made lower lows.
x.com/CyclesFan/status/20650…
4
7
87
10,691
Jun 11
Sorry, actually there was another case in this timeframe that matches the -34 points criteria, August 5, 2019. That's the only case in which SPX didn't make a lower low. In all other cases it made lower lows.
x.com/CyclesFan/status/20650…
Jun 11
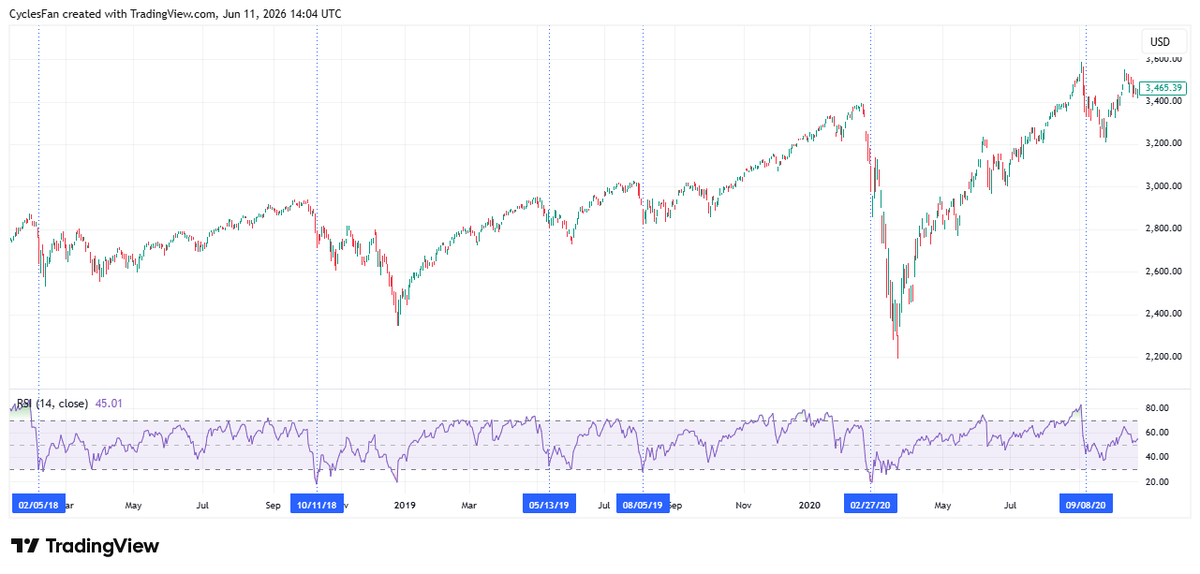
By my calculation the RSI fell only 34.36 points in the last 6 days so using a 34 points threshold and a 6 days max threshold(because it can happen in less than 6), here are 5 of these dates:
02/05/2018
10/11/2018
05/13/2019
02/27/2020
09/08/2020
x.com/OddStats/status/206504…
4
3
42
18,100
Jun 11
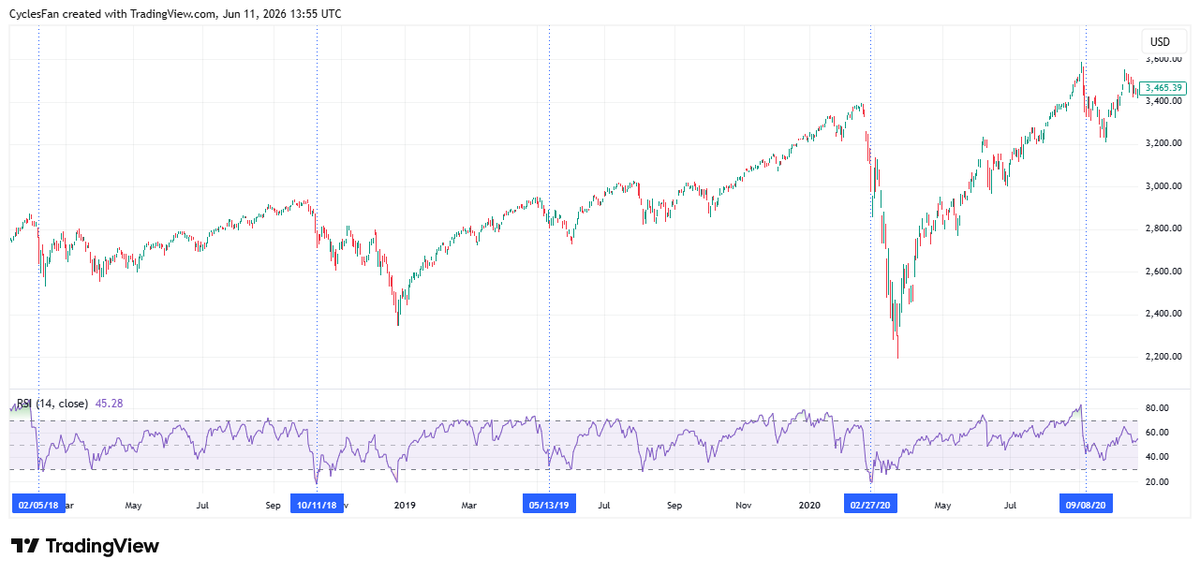
By my calculation the RSI fell only 34.36 points in the last 6 days so using a 34 points threshold and a 6 days max threshold(because it can happen in less than 6), here are 5 of these dates:
02/05/2018
10/11/2018
05/13/2019
02/27/2020
09/08/2020
x.com/OddStats/status/206504…

I've gotten 6 requests to recreate this study about how far RSI has fallen on SPX in the last 6 days (which I won't do; Matt knows what he's doing).
All you really care about anyway is how the S&P 500 did going forward after the past recent events.
5
5
43
15,625
Jun 10
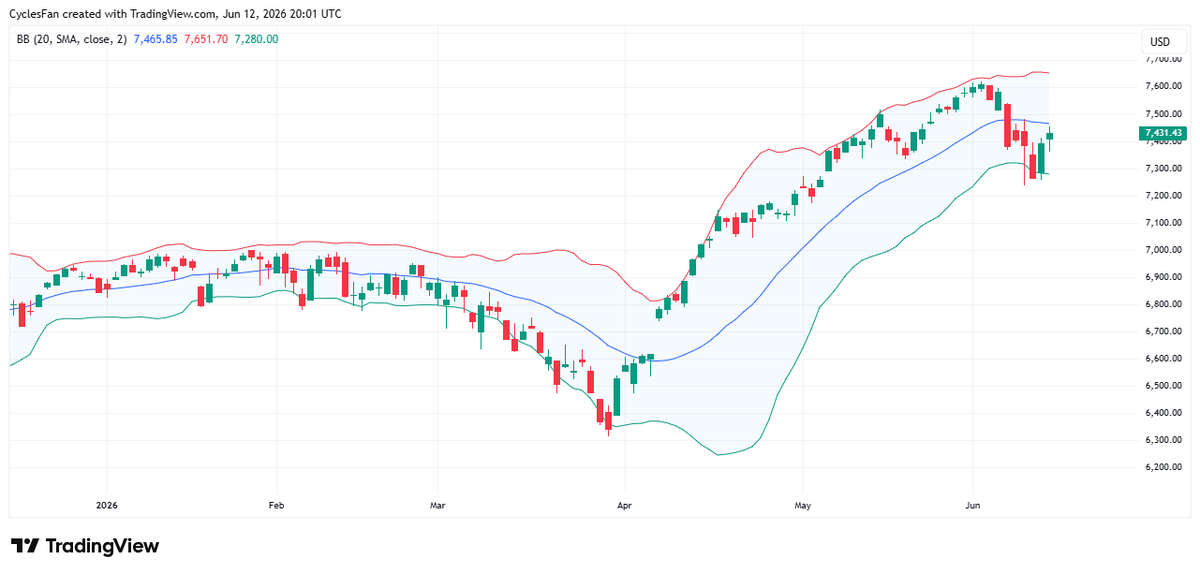
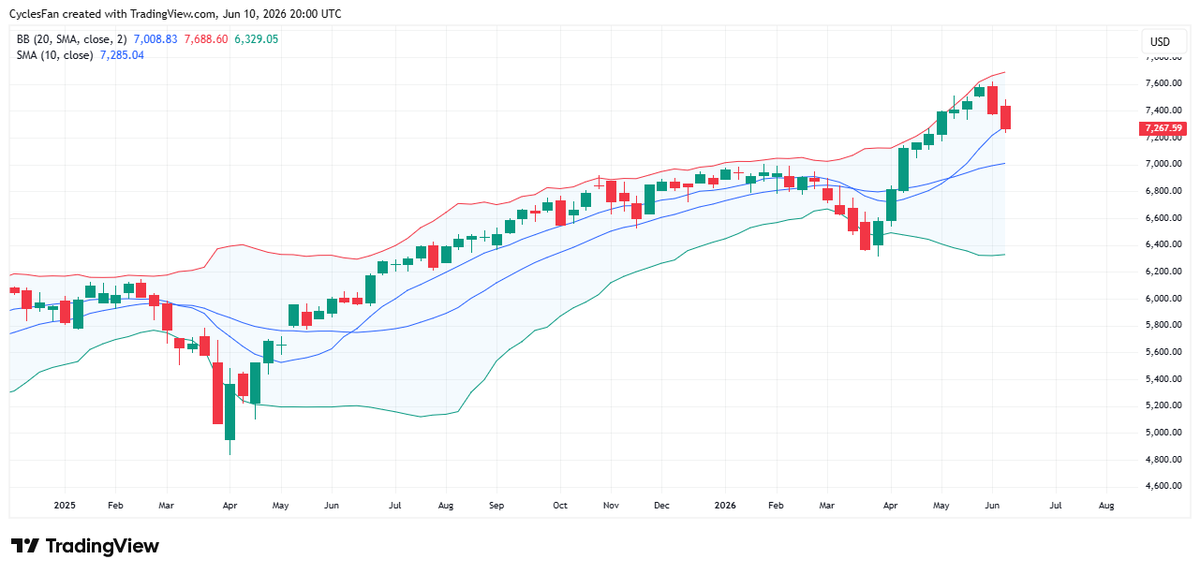
$SPX - Today I'm showing the weekly chart in order to make things simple. SPX closed the day below its 10 week MA(7285). If it closes the week below the 10 week MA a multi week top will be confirmed and the next downside target would be the 20 week MA that is currently at 7009.
13
20
211
12,612
Jun 10
$Gold retested the March low at today's low(4107). So far it has bounced only $20 so there's no bullish reversal yet. If 4100 is broken it may drop all the way to the late October low at 3886.

12
9
148
10,782
