
Evolutionary biologist studying archaeal and bacterial genomes | Assistant Prof @BinfUtrecht @UUBeta 🇳🇱 | Previously @ettema_lab @MIB_WUR @_SLU @MolEvoUpp
Joined May 2011
- Tweets 3,003
- Following 1,516
- Followers 2,118
- Likes 5,724
Photos and videos
Daniel Tamarit retweeted

17 Apr 2025
Did a “bottle opener” open the door to eukaryotes? Meet the Hodarchaeales-related cells- yet another bizarre morphology from Asgard archaea! journals.asm.org/doi/10.1128…
2
6
422
Daniel Tamarit retweeted

19 Apr 2025
We are looking for a Doctoral Candidate with a #bioinformatics background to use metagenomics to study microbial pathogens in non-clinical niches as part of #SPOILCONTROL @MSCActions DN DC5 - Pathogenic Flora spoilcontrol.hub.inrae.fr/ph…

2
28
37
4,422
Daniel Tamarit retweeted

24 Feb 2025
How I found professional satisfaction by adjusting my definition of success science.org/content/article/…

2
9
532
Daniel Tamarit retweeted

21 Feb 2025
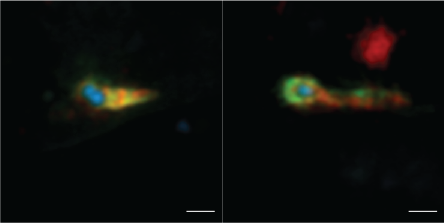
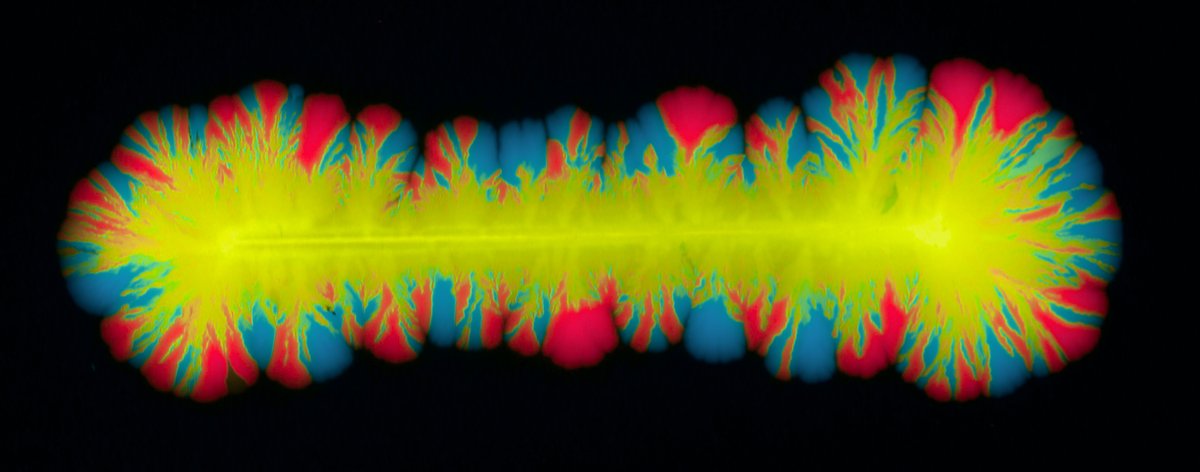
So happy that I can finally share the results of my first postdoc paper with @baym!! Turns out plasmids are an amazing system to study multi-scale evolution and we can track within-cell and between-cell dynamics! Here’s a photo of plasmids competing inside cells in a colony (1/n)
13
95
513
60,886
Daniel Tamarit retweeted

📣 Exciting News! The Evolutionary Microbiology Lab is hiring:
📍 The @IBE_Barcelona seeks a PhD Student.
📆 Application Deadline: 31st of March.
#JoinTheIBE and be part of our team!
✍️ibe.upf-csic.es/work-with-us…

8
11
1,032
Daniel Tamarit retweeted

24 Nov 2024
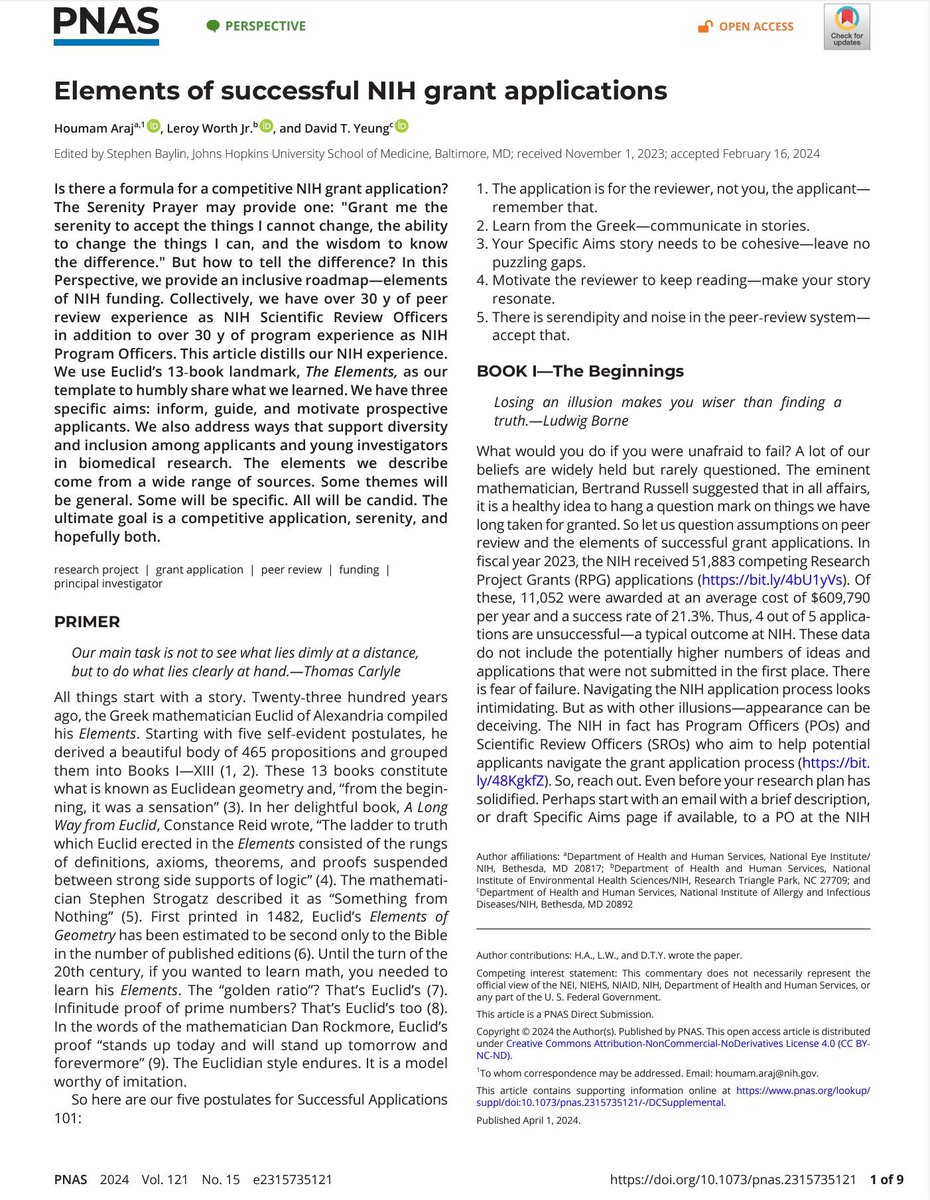
How to write a grant?
1. Write it for the reviewer, not you, the applicant.
2. Communicate in stories.
3. Make your story cohesive—leave no puzzling gaps.
4. Make your story resonate to keep the reviewer reading.
5. Accept chance and noise in peer-review.
pnas.org/doi/epub/10.1073/pn…
16
495
2,029
270,360
Daniel Tamarit retweeted

My mentor, colleague, friend and all-round clever guy Ford Doolittle has just published a book "Darwinizing Gaia". I've read pieces of it an it's very thought-provoking...go out and get it! mitpress.mit.edu/97802625495…
8
28
2,161

13 Nov 2024
RT @msmjetten: 🟥 Professors preparing protest posters against the announced draconic budget cuts on higher education in the Netherlands 🟥 u…
1
Daniel Tamarit retweeted
12 Nov 2024
2
8
531
Daniel Tamarit retweeted

9 Nov 2024
Yeah. Not good.
sciencedirect.com/science/ar…
122
1,218
15,099
1,392,896
Daniel Tamarit retweeted
10 Nov 2024
Scienticide’: Argentina’s science workforce shrinks with Milei government
The main science agency, the National Council of Scientific and Technical Research (CONICET), has lost about 1000 staff, or 9% of its workforce, since Milei took office in Dec 2023 science.org/content/article/…
14
23
2,835
Daniel Tamarit retweeted

9 Nov 2024
Calling on all science friends here to sign in to 🦋and join the growing online community there
3
7
1,397
Daniel Tamarit retweeted

7 Nov 2024
🦠 How does human milk stir the formation of bacterial communities in the infant gut?👶
Check our paper in @ISMEJournal from @clarabelzer group at @MIB_WUR
doi.org/10.1093/ismejo/wrae2…
4
6
14
1,081
Daniel Tamarit retweeted

7 Nov 2024
📢 Onderwijs en onderzoek zijn cruciaal om de grote vraagstukken van onze tijd aan te pakken! Toch bezuinigt het kabinet-Schoof €1 miljard op hoger onderwijs en wetenschap. Wij komen in actie tegen deze bezuinigingen! Teken jij ook de petitie? campagnes.degoedezaak.org/ca…
3
2
354
Daniel Tamarit retweeted

6 Nov 2024
Bring your data visualizations to life with animation! The gganimate package extends ggplot2 by adding animation capabilities, making it easy to create dynamic and engaging plots that reveal patterns over time or across categories.
✔️ Dynamic Storytelling: Transform static charts into animated visuals, allowing you to showcase changes, trends, and sequences clearly and effectively.
✔️ Customizable Animations: Control the speed, transitions, and aesthetic elements of your animations, giving you full flexibility to highlight key points.
✔️ Engage Your Audience: Animated graphics make complex data easier to understand, keeping your audience engaged and helping them grasp insights faster.
✔️ Easy Integration with ggplot2: Works seamlessly with ggplot2, so you can animate your existing plots without needing to learn complex new syntax.
The example shown here is from the package website, illustrating how gganimate can transform typical plots into informative animations: gganimate.com/
Ready to master ggplot2 and its powerful extensions to make your visualizations stand out? Enroll in my online course, “Data Visualization in R Using ggplot2 & Friends,” starting on November 25, 2024!
See this link for additional information: statisticsglobe.com/online-c…
#VisualAnalytics #RStats #database #tidyverse
4
112
702
50,138
Daniel Tamarit retweeted

6 Nov 2024
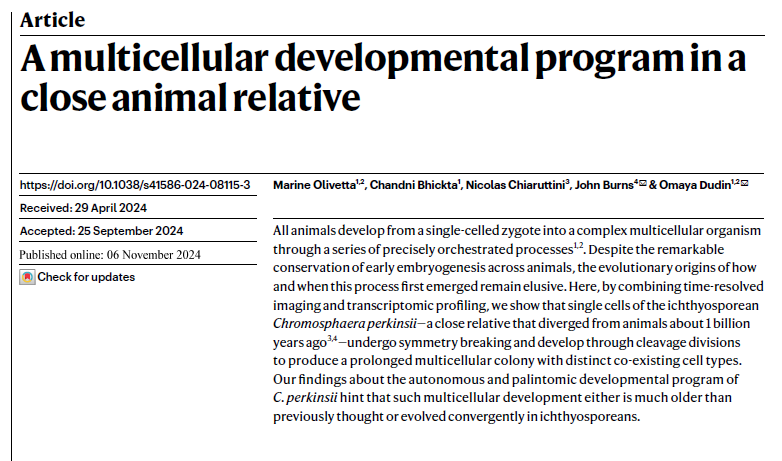
Our latest #Ichthyosporean #EvoDevo story, led by M. Olivetta @ChandniBhickta @NChiaruttini & in co. with
@burnsajohn is finally out @Nature .
Link⏩: nature.com/articles/s41586-0…
Preprint⏩: biorxiv.org/content/10.1101/…
1/5)
23
103
283
50,948
Daniel Tamarit retweeted

The ISME ECSC is spotlighting Carolina F. Cubillos (@CaroFCubillos), an Postdoctoral researcher from the Université Paris-Saclay, and her paper “Exploring the prokaryote-eukaryote interplay in microbial mats from an Andean athalassohaline wetland.”
doi.org/10.1128/spectrum.000…
(1/2)

2
8
21
3,485
Daniel Tamarit retweeted

4 Nov 2024
Exploring gene duplications! Our study reveals how duplicated genes diverge in function using structural and expression analysis across 36 species. Check out our paper: biorxiv.org/content/10.1101/…
Thanks to @the_alexwv, @Gloveface, Paul Thomas, @cdessimoz
#Genomics #Evolution
41
100
6,450
Daniel Tamarit retweeted

3 Nov 2024
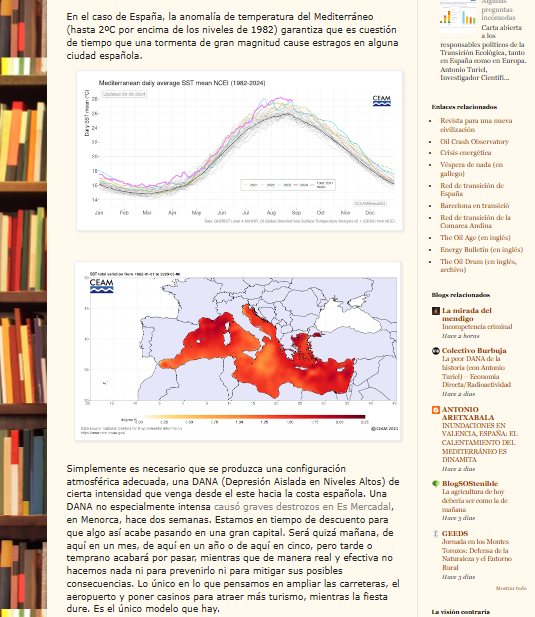
Madre mía. Releyendo otras cosas, me encuentro este texto de @amturiel escrito el 1 de septiembre de 2024. Parece que tiene una bola de cristal. Nada de eso. Lean y asómbrense.
crashoil.blogspot.com/2024/0…
@mitecogob @Teresaribera @casareal @desdelamoncloa @_minecogob @carlos_cuerpo @Freecanusa @carlossmato @xabierfortes @julia_otero @SIntxaurrondo @jordihereub @salvadorilla @joseluisescriva @Rub_dc @IsabelIsamoren @mbarreiro_tve @slaplana_tve @metbeni @glezjuanje @Divulgameteo @JavierBlas @aeberman12
31
800
1,453
95,093