
Revolutionizing data visualization since 2007, LightningChart developed Dashtera, an innovative charting technology, empowering you with next-level dashboards.
Joined July 2025
- Tweets 102
- Following 17
- Followers 8
- Likes 3
99 Photos and videos


Jun 12
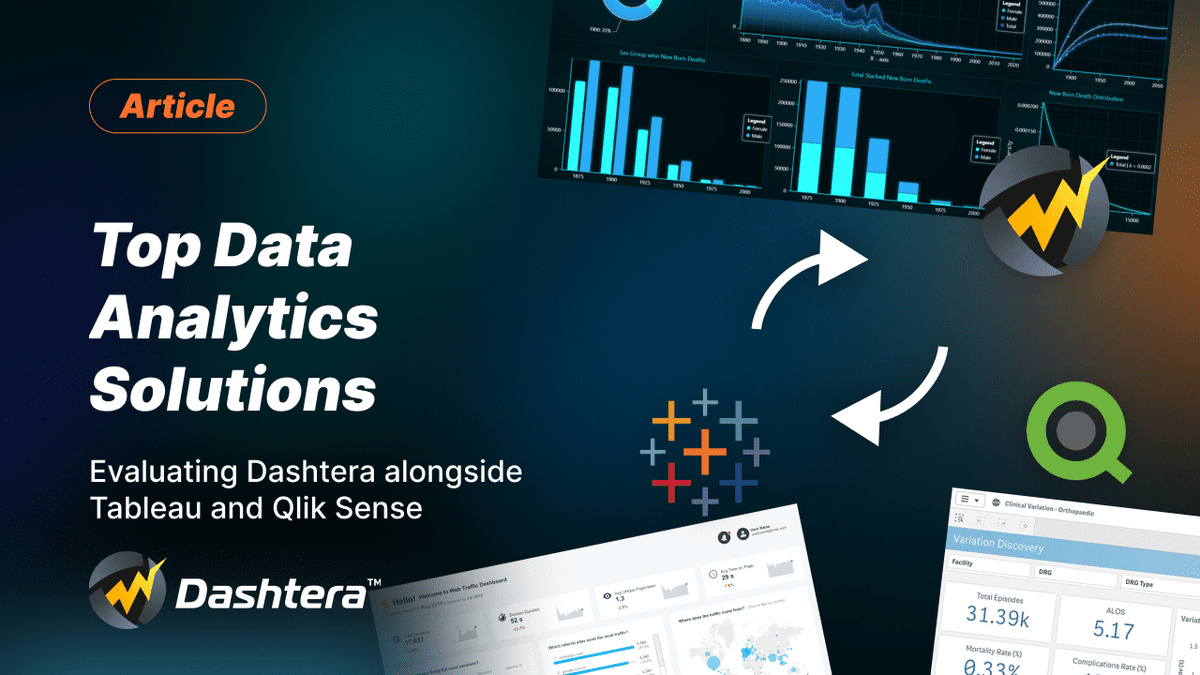
A recent comparison of Dashtera, Tableau, and Qlik Sense suggests the next battleground is:
⚡ Real-time data
📊 Massive datasets
🌐 True 3D visualization
📈 Advanced financial analytics
⚙️ Engineering & scientific workloads
hubs.la/Q04lbqbm0
2
Jun 11
We're at #GITEXAIEurope 🇩🇪
June 30 – July 1 | Messe Berlin 📍 Hall 2.2, Stand D135
Come see what happens when your charts render 10 million data points in real time. Live demos at the stand.
#LightningChart #DataViz #Berlin2026
3
Jun 10
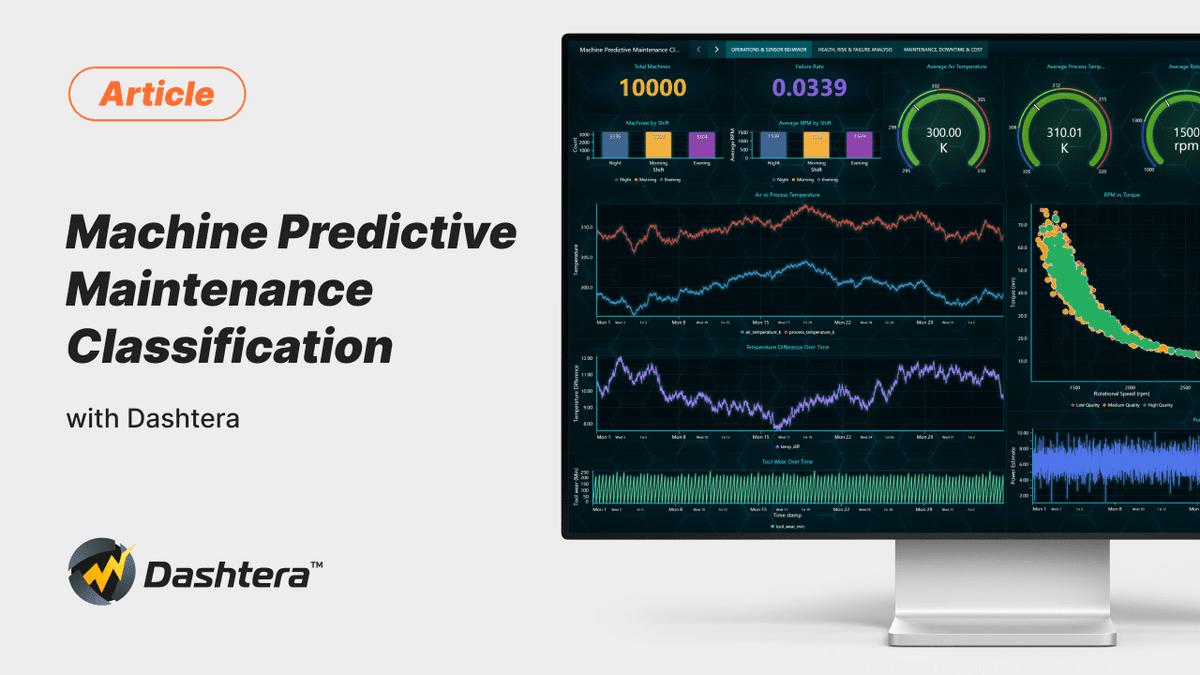
3.39% failure rate. 10,000 machines. Morning shift highest risk. Heat dissipation = top failure type.
All surfaced in a 3-page Predictive Maintenance Dashboard, built in Dashtera®. No code. 3D MLE, regression, Poisson modeling included.
→ hubs.la/Q04kTfP20
#Dashtera
1
Jun 8
Real LiDAR point cloud. Live in a browser. No code.
Dashtera® handling 3D spatial data the way it handles everything else — GPU-accelerated, smooth, no limits.
Try free → hubs.la/Q04ks1FD0
#Dashtera #LiDAR #3D #PointCloud #DataVisualization #NoCode
18
Jun 5
Movie dashboards: fake, outdated, dramatic.
Dashtera® dashboards: real, live, actually useful.
Yours could look better than Godzilla’s threat monitor. Just saying. 🦖
Try free → hubs.la/Q04kfVBd0
#Dashtera #DataVisualization #NoCode #RealTimeData
7
Jun 3
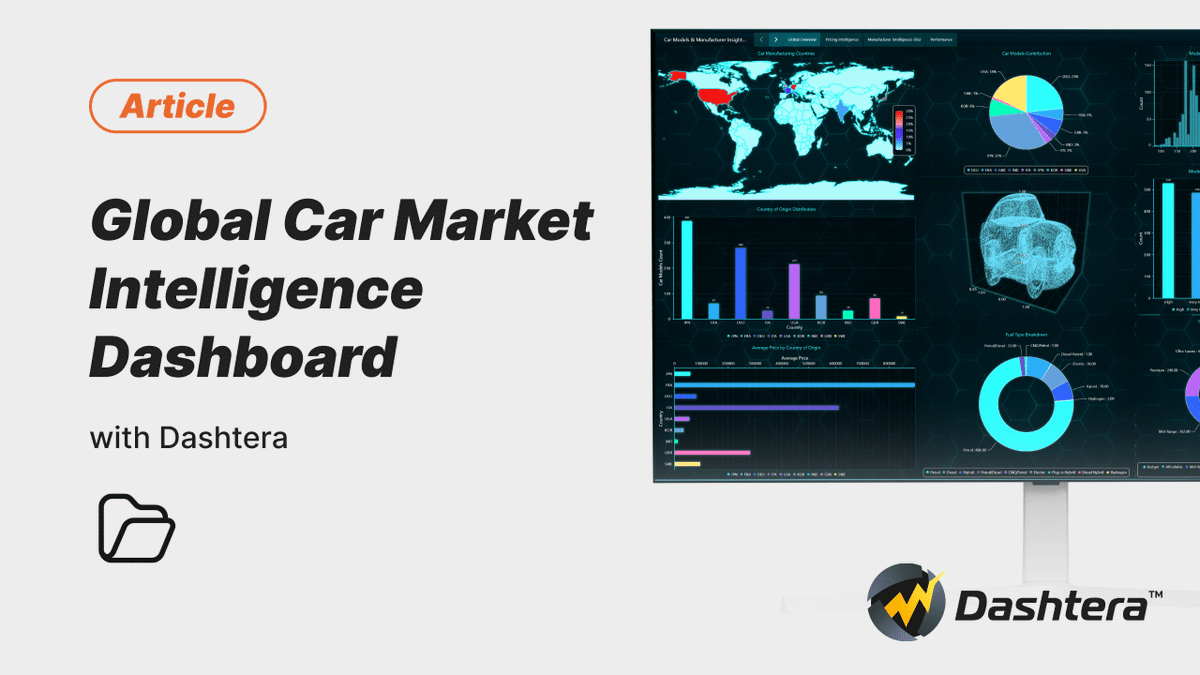
1,200 car models. 9 countries. One dashboard.
India avg price: $12,988. Porsche avg: $141,291. France & Italy highest by country. Japan, Germany, USA = 75% of all models.
Built in Dashtera® - no code.
→ hubs.la/Q04jTMdF0
#Dashtera #Automotive #MarketIntelligence
3
Jun 2
📊 Build dashboards in minutes
⚡ Visualize real-time data streams
🔍 Monitor hundreds of data feeds
🤝 Share interactive dashboards across teams
Dashtera helps organizations move from data to decisions faster.
hubs.la/Q04jJn130
2
Jun 1
Telemetry doesn’t wait. Your visualization shouldn’t either.
Dashtera®: millions of data points, GPU-accelerated, minimal lag. Live streaming historical session comparison. InfluxDB-native.
Aerospace. Manufacturing. Vehicles. Smart city.
→ hubs.la/Q04jxhGs0
2
May 29
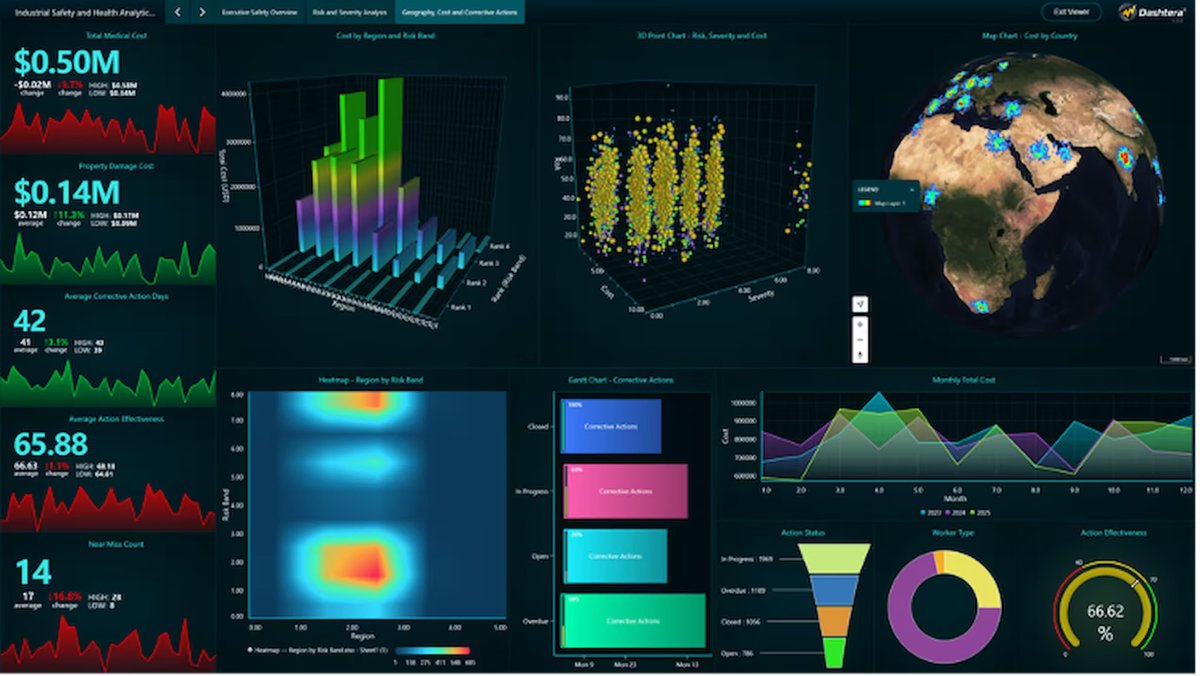
5,000 incidents. 1,189 overdue corrective actions. Lost time injuries up 13%.
All sitting in a database, invisible, until visualized.
Built a full Industrial Safety dashboard in Dashtera® MongoDB. No code. Gantt, 3D scatter, regression, heatmaps.
→ hubs.la/Q04jlQ_S0
9
May 28
959 MWh. 23 tCO2. 35,040 records. One steel plant. One dashboard.
Built in Dashtera® with MongoDB - no code. R² = 0.98 between energy use and emissions. Maximum load = nearly half of all consumption.
This is what industrial energy transparency looks like
hubs.la/Q04jckx-0
5
May 27
Most BI tools downsample your data to keep up. In ECG monitoring or vibration analysis, that missing peak is the whole point.
Dashtera® renders every single data point. GPU-accelerated. 60 FPS. No code.
hubs.la/Q04h_-VT0
#Dashtera #RealTimeData #NoCode #DataVisualization
12
May 26
Same 1M row dataset:
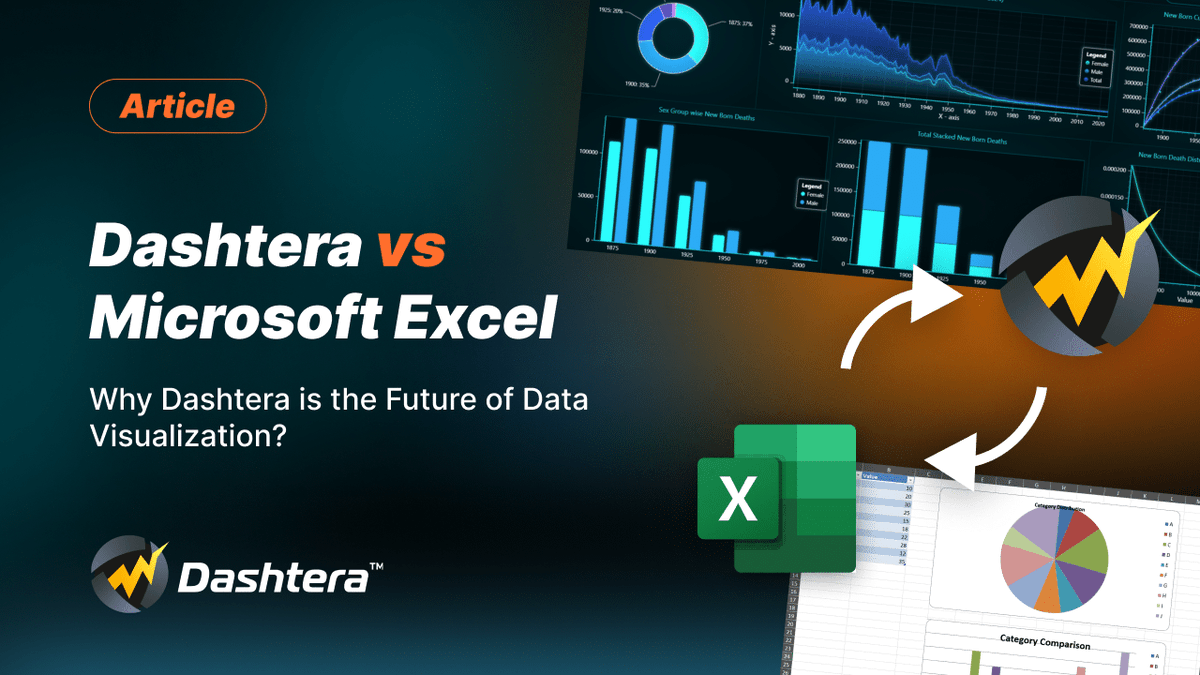
❌ Excel Desktop: 23s to open. No zoom. No pan.
❌ Excel Online: can’t visualize it.
✅ Dashtera®: 0.2s. Full interactivity.
Excel is a spreadsheet. Dashtera is built for data.
→ hubs.la/Q04hSHYX0
#Dashtera #Excel #DataVisualization #NoCode
5
May 22
Minute-level $TATAMOTORS NSE data — RSI, MACD, Bollinger Bands, EMA, Doji detection, 3D volume analysis — built in Dashtera®. No code.
This is what financial data exploration looks like in 2026.
@TataMotors
hubs.la/Q04hCLMV0
#Dashtera #TataMotors #NSE #TechnicalAnalysis
110
May 21
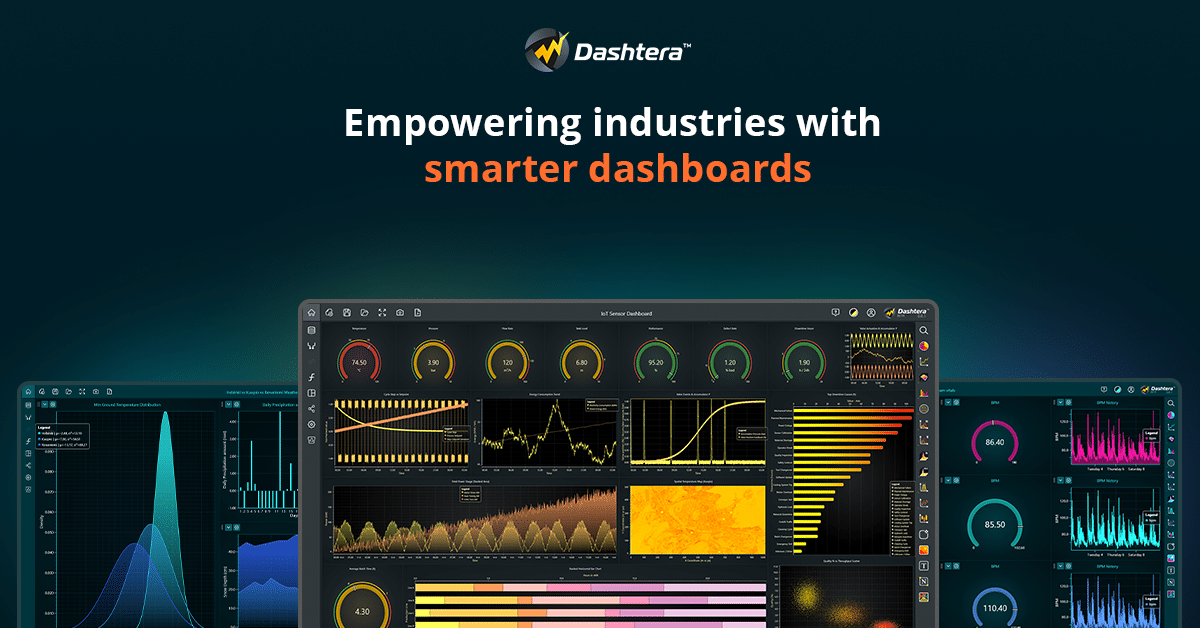
BI. IoT. Medical. Finance. Telemetry. Industrial.
Dashtera® handles them all, same GPU engine, sub-millisecond precision, no code.
Different industries. Same data problem. One platform.
→ hubs.la/Q04hsLM50
#Dashtera #DataVisualization #IoT #RealTimeData #NoCode
3
May 20
New in Dashtera®: Parquet support Custom Connectors.
Parquet for big data pipelines. Custom connectors for when your infra doesn't fit a standard mould.
Already supports PostgreSQL, Snowflake, MongoDB, InfluxDB, WebSockets and more.
→ hubs.la/Q04hgsYn0
#Dashtera
4
May 19
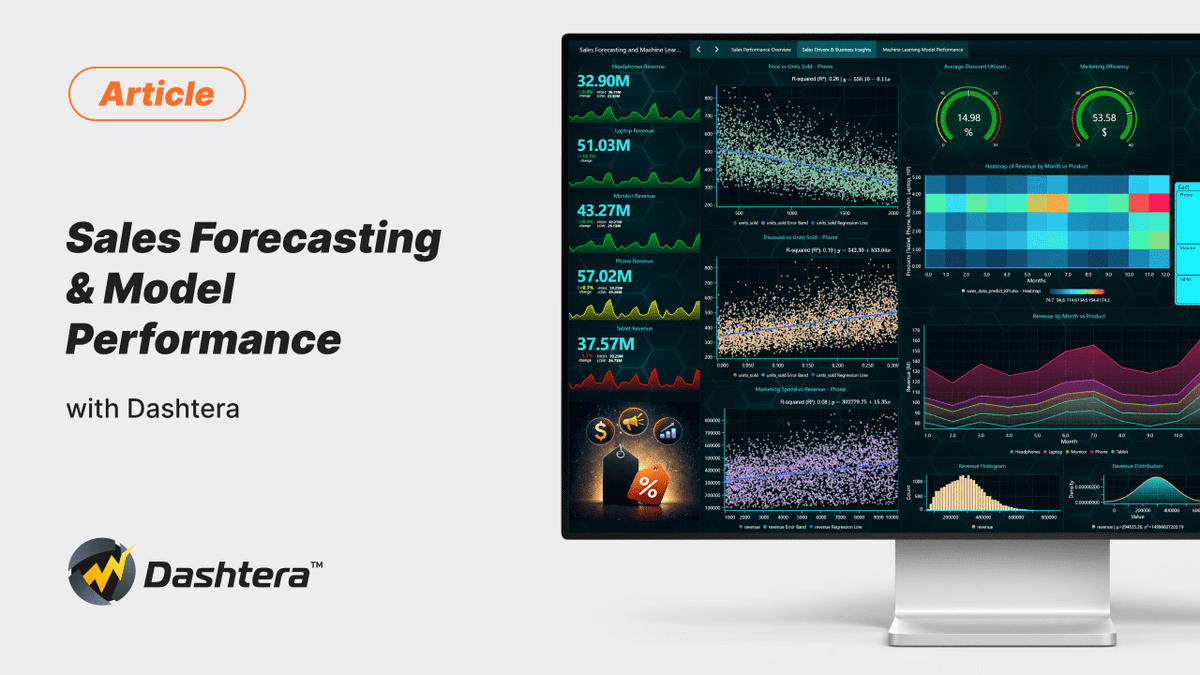
4 ML models. 3 years of data. Built in Dashtera® - no code, no external tools.
XGBoost won. $53 revenue per $1 marketing spend. 2025 forecast included.
→ hubs.ly/Q04h4NM60
#Dashtera #SalesForecasting #MachineLearning
2
May 18
✅ Dashtera - 6 charts × 5M pts, full interactivity, zero lag
⚠️ Qlik - ingested 5M, but static. No zoom, no pan
❌ Power BI - crashed with resource error at 5M
❌ Tableau - crashed at 500k, laggy at 100k
❌ Grafana - no local CSV support
See:
👉 hubs.la/Q04gYnrV0

31
May 15
We built a full manufacturing analytics dashboard in Dashtera® - 1,000 jobs, live PostgreSQL, zero code. Gantt, Pareto, 3D scatter, heatmaps. All in one platform.
👉 hubs.la/Q04gM3yR0
#Dashtera #Manufacturing #DataVisualization #NoCode #SmartManufacturing
13
May 13
By the time most dashboards show the problem, it’s already happened.
Dashtera®: hundreds of live charts, massive data flows, minimal latency. GPU-accelerated. No downsampling. No snapshots.
Real-time, for real.
👉 hubs.la/Q04gr0sX0
4
May 12
Your BI dashboard shouldn’t force you to choose between speed and depth.
Dashtera® connects SQL, real-time feeds & static files - unified in one dashboard. Millions of data points. Drill-downs. 3D charts. No code.
👉 hubs.la/Q04gcNjJ0
#Dashtera #BusinessIntelligence
13