
Data Storytelling | SQL • Excel • Power BI • Tableau | Python | From Data to Decisions
Joined August 2025
- Tweets 148
- Following 119
- Followers 280
- Likes 109
33 Photos and videos


Jun 15
YouTube channels to learn and masters data analytics
3
55
293
6,883
Jun 15
Data Analysis Roadmap that will guide your data journey.
7
46
240
4,786


Jun 13
Brilliant insight
Jun 13

At the end of every quarter, Sandra has the same challenge.
As the Commercial Analytics Lead at Nestlé Nigeria, she's responsible for preparing performance reports for management.
The problem isn't the reporting itself.
The problem is that the data comes from different regions.
For Q1, sales reports arrived from the North, South-West, and South-East regions as separate CSV files. Each region maintained its own report, which meant slight differences in formatting, naming conventions, and data quality.
Before management could answer questions like:
• Which region generated the most revenue?
• Which products performed best?
• Who were the top-performing sales representatives?
• How did revenue trend throughout the quarter?
The data first had to be prepared.
This project started with three regional sales datasets.
Using Power Query, I imported the files, standardized the structure, corrected data types, cleaned inconsistencies, and appended all three datasets into a single master table.
Once the foundation was in place, I created additional fields to support analysis, including:
• Revenue
• Profit
• Profit Margin
• Week Number
• Month Name
• Performance Indicators
With the transformed dataset ready, the next step was analysis.
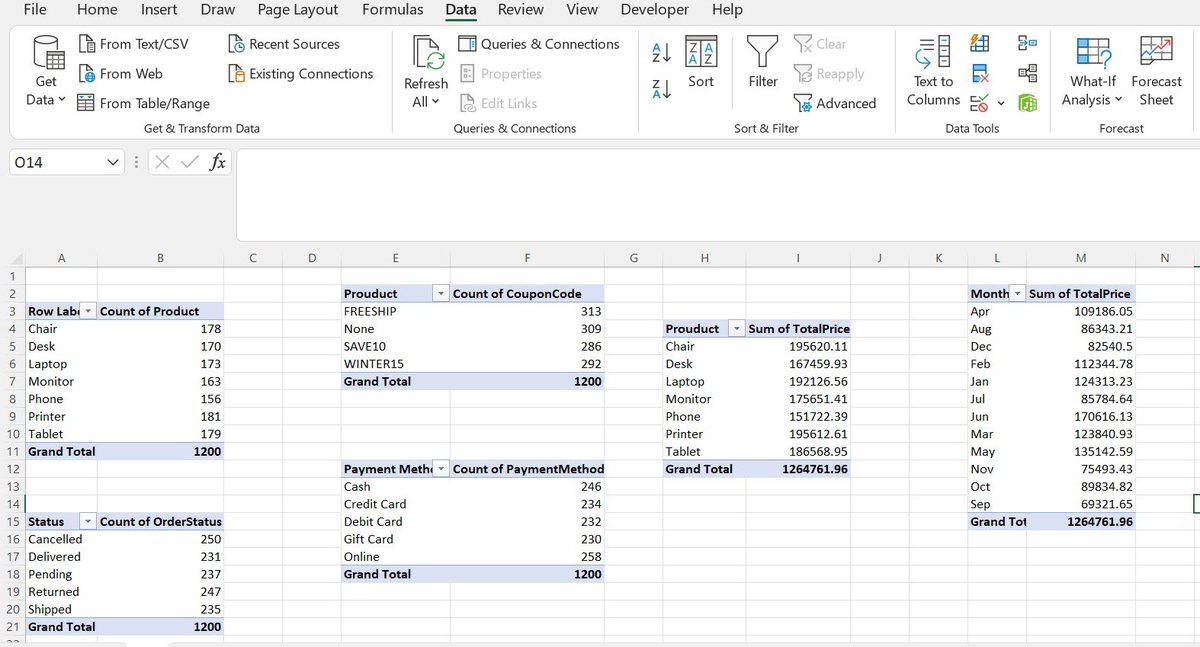
Before building any visuals, I summarized the data using PivotTables to identify the key insights and answer the business questions that mattered most.
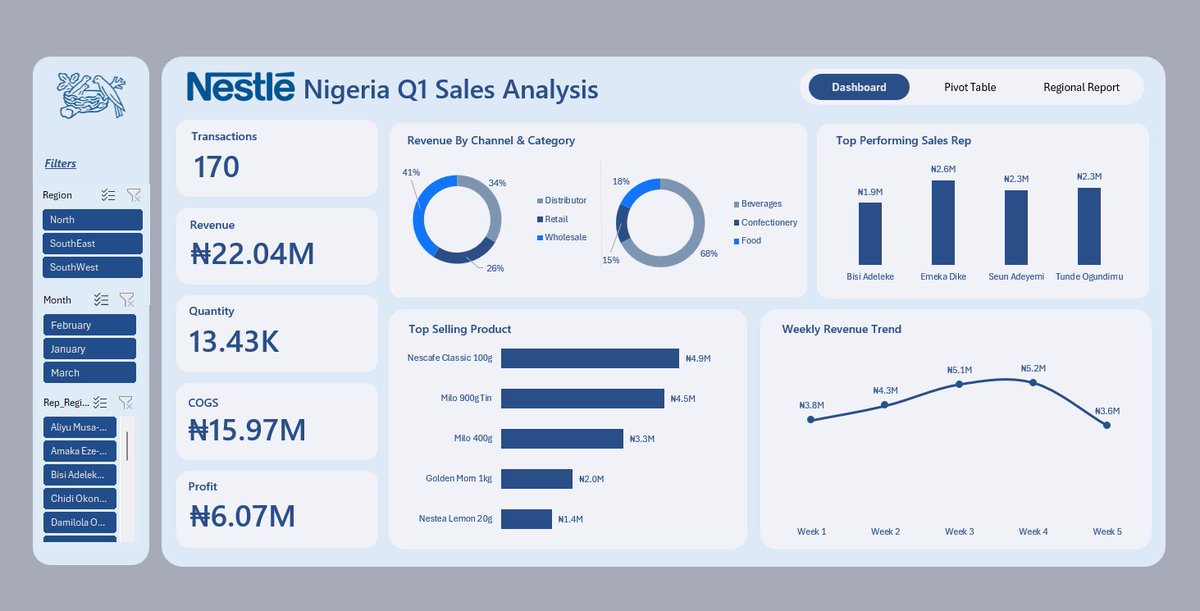
Only after the analysis phase did I move into dashboard design.
I wireframed the layout, defined the KPI structure, selected the appropriate visualizations, and built an interactive dashboard featuring:
• Revenue, Profit, Quantity, and Transaction KPIs
• Revenue by Channel and Category
• Top Performing Sales Representatives
• Best Selling Products
• Weekly Revenue Trends
• Interactive filters for Region, Month, and Sales Representative
What began as three separate CSV files became a centralized reporting solution capable of delivering insights in seconds.
One lesson I keep reinforcing in my classes:
Most people think dashboards start with charts.
They don't.
Dashboards start with clean data, a structured process, and the right business questions.
Tools Used: Excel, Power Query, PivotTables, PivotCharts, Slicers, Dashboard Design
#DataAnalytics #Excel #PowerQuery #BusinessIntelligence
2
1
24
1,195

Jun 12
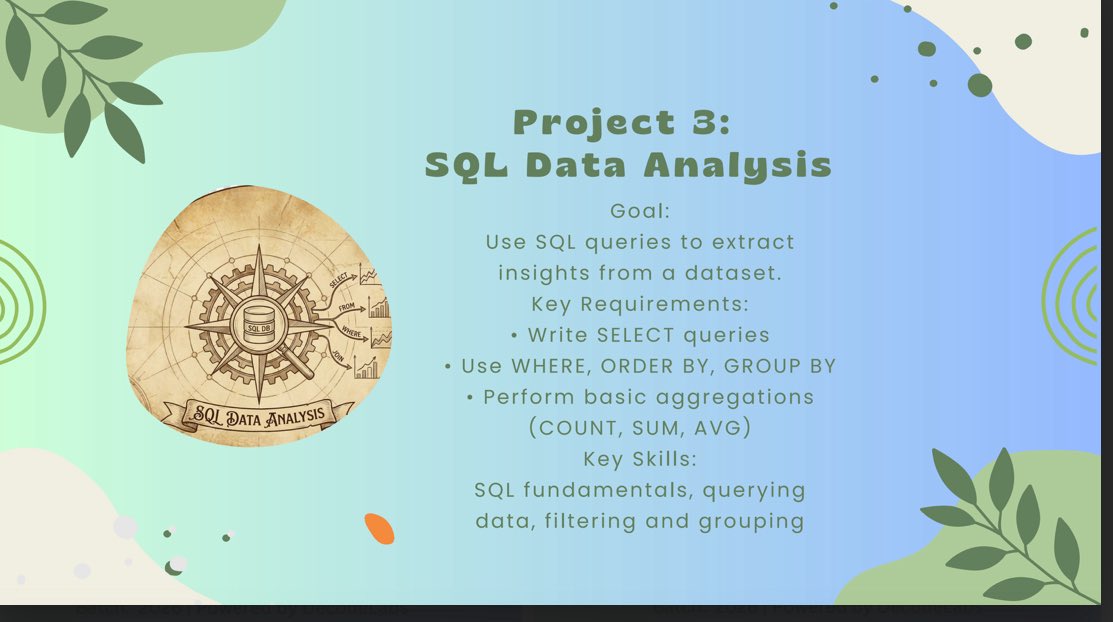
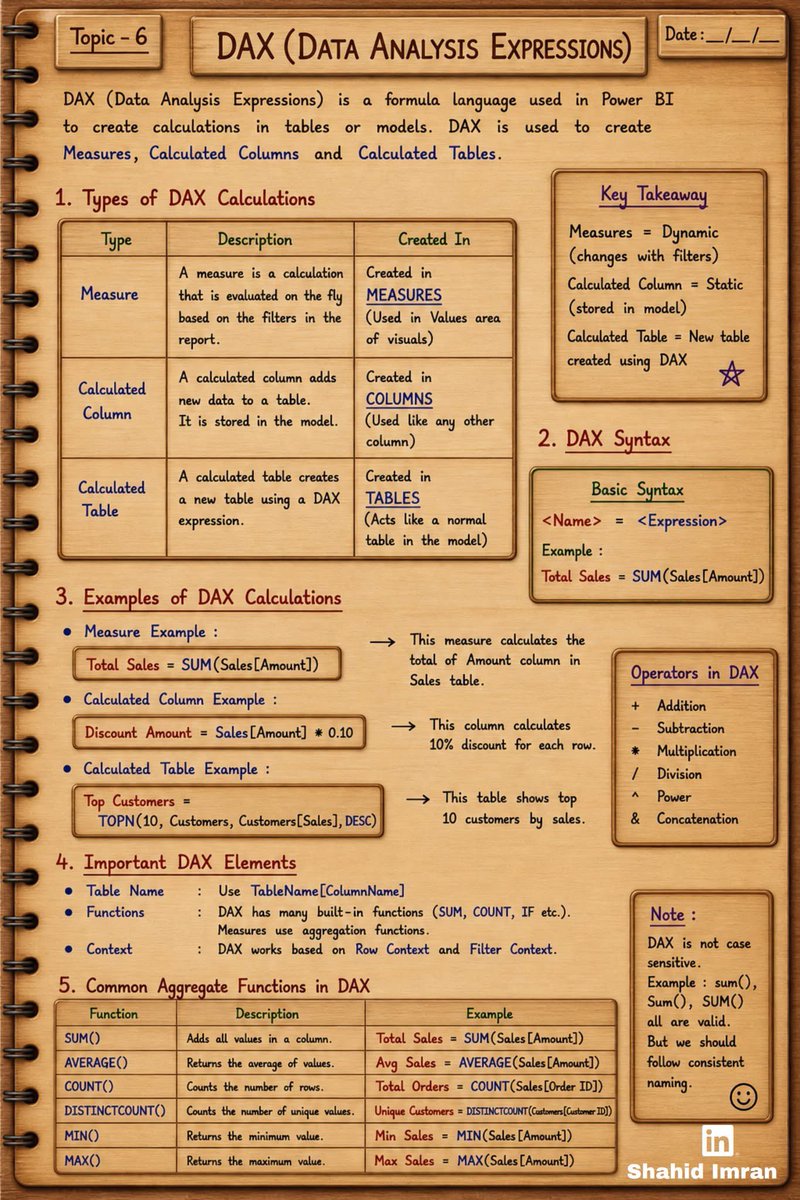
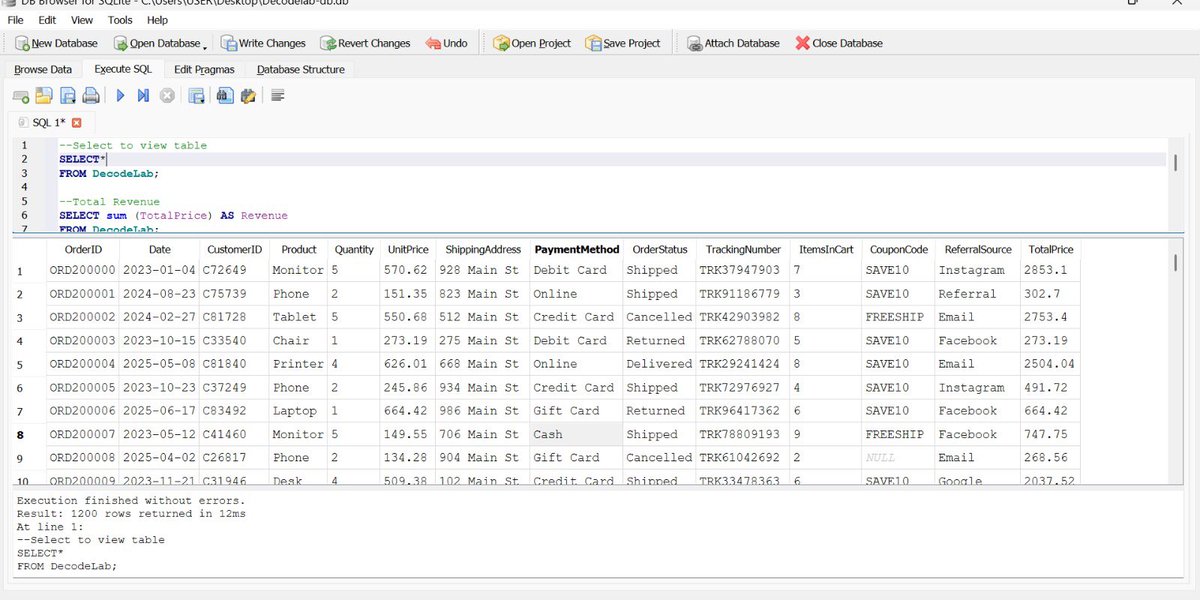
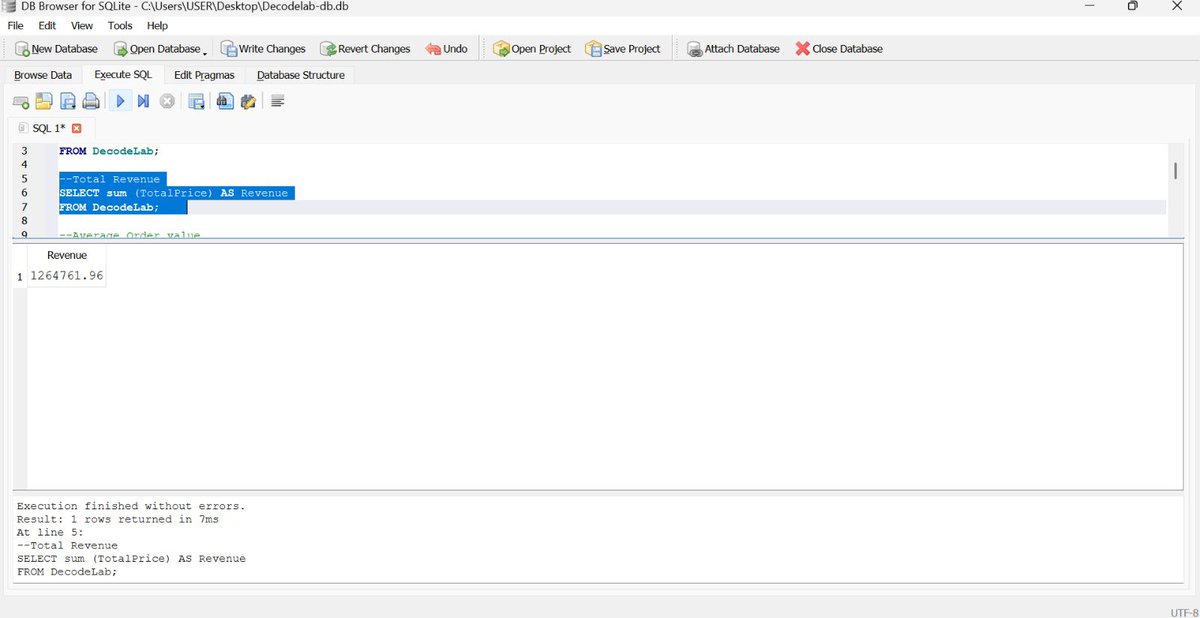
As part of my project with DecodeLab, I applied SQL to extract and analyze targeted data from our database. By leveraging SELECT, GROUP BY, ORDER BY, and HAVING, I focused on pulling only the metrics essential for analysis –revenue, order volume, and product performance.

1
1
10
317
Khadijat sadiq 📊 retweeted

🚚 Just completed my Capstone Project at @TechSphereAcad given by @ezekiel_aleke in the recently concluded Data Analytics cohort
Using Excel, SQL, and Power BI, I analyzed 14 logistics datasets and built 5 interactive dashboards covering:
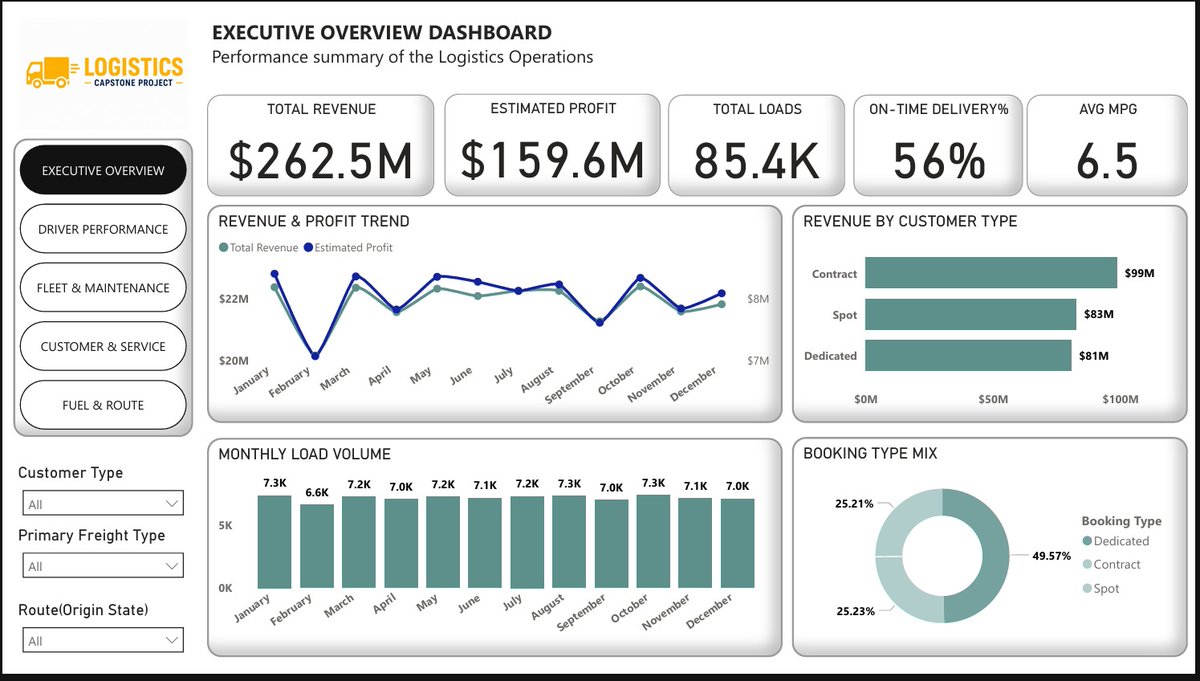
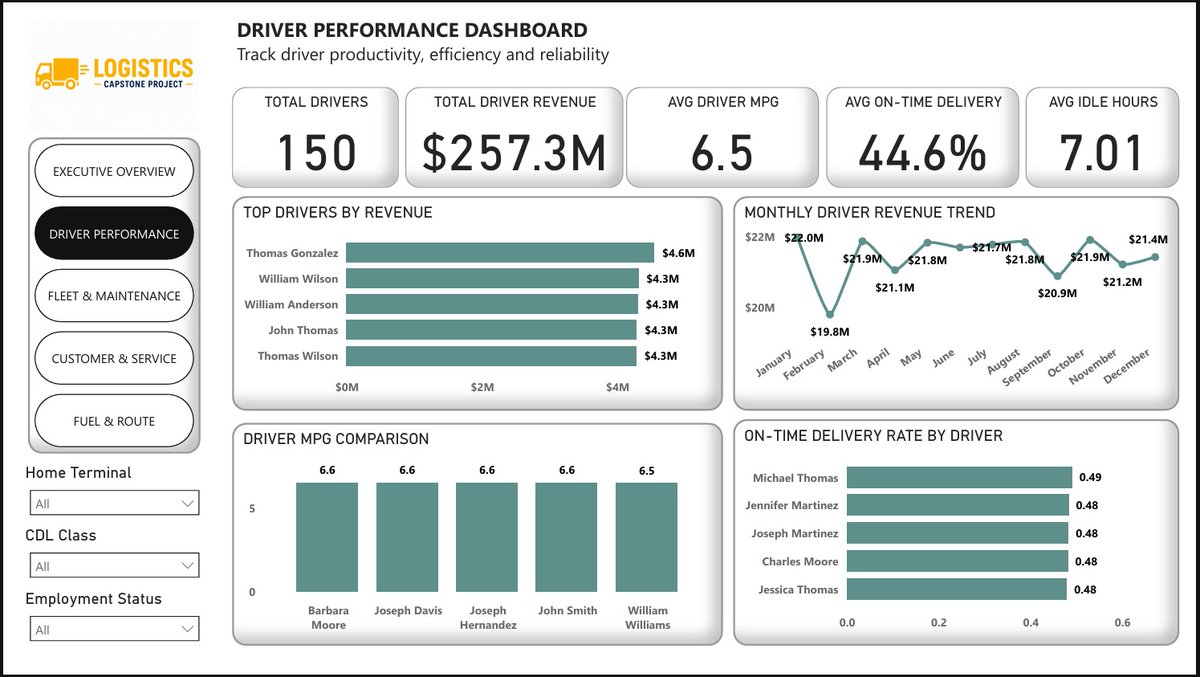
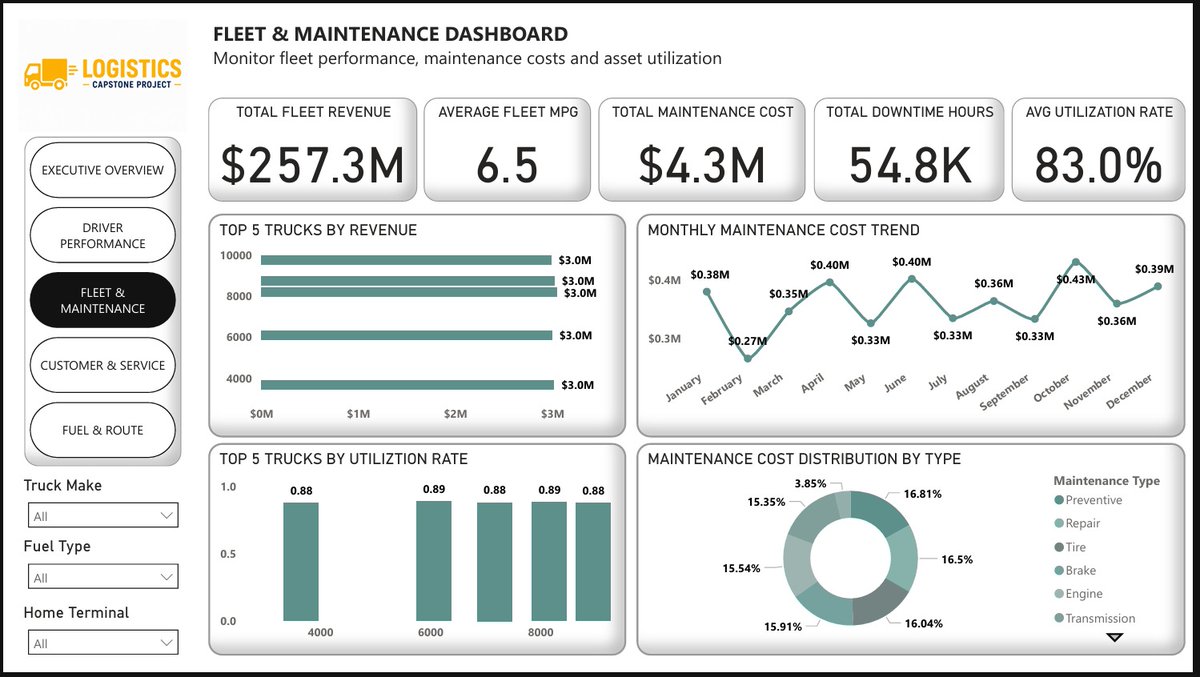
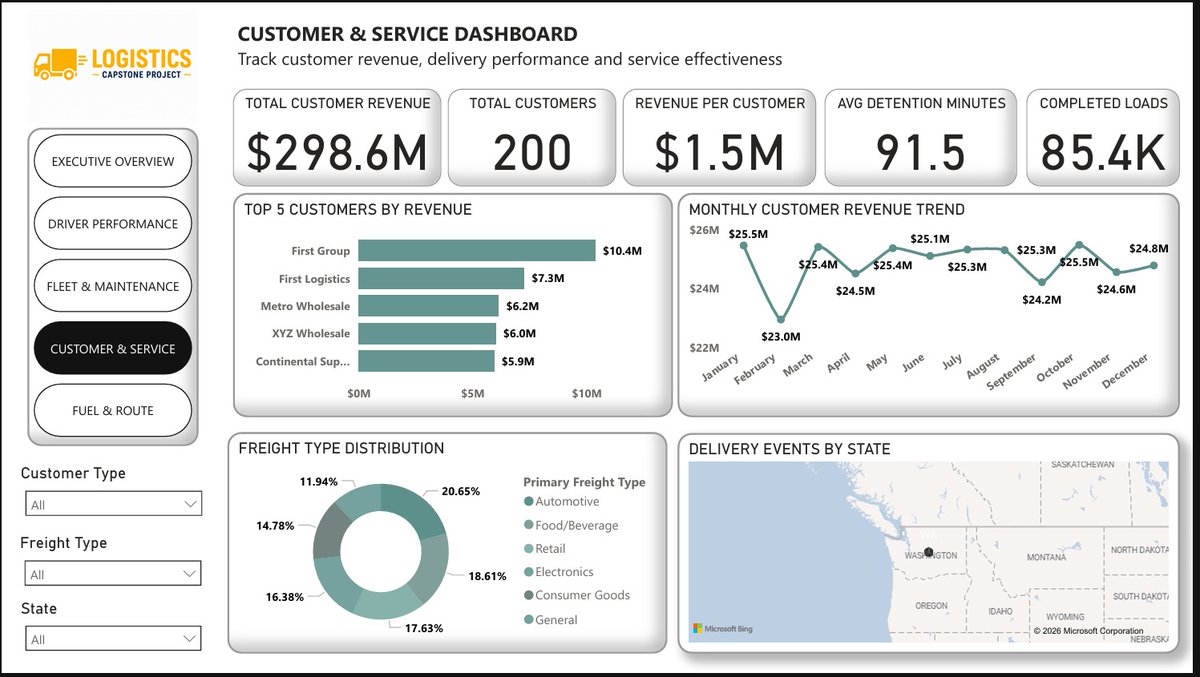
6
4
35
621
Congratulations Mariam you did it celebrate 🎉

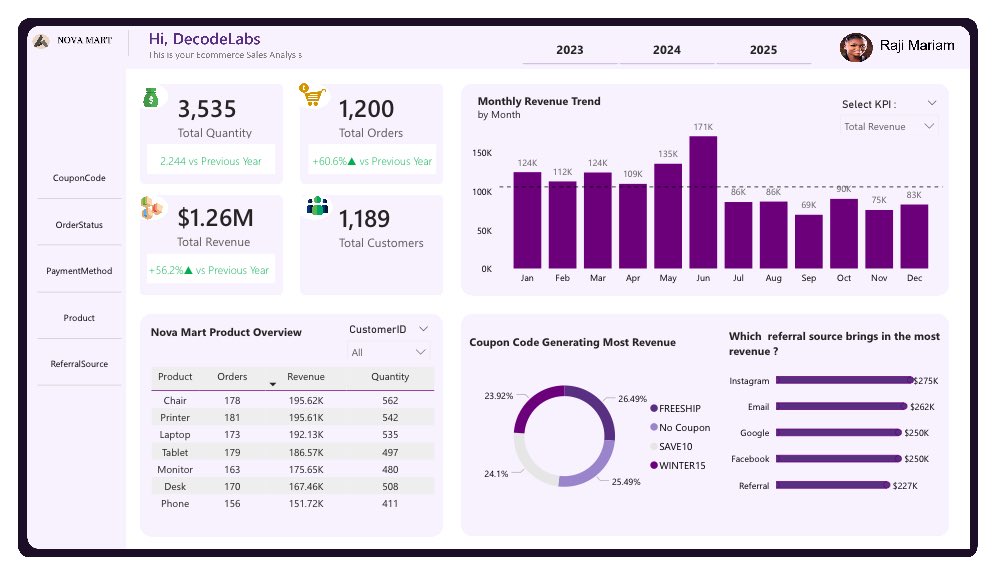
Just wrapped up my final project as a Data Analytics Intern at DecodeLabs,a fully interactive Power BI dashboard for Nova Mart e-comm sales.
From cleaning raw data, writing SQL queries, to building something dynamic and useful. Here’s what the numbers revealed:
2
6
257
Khadijat sadiq 📊 retweeted

Jun 7
It’s my birthday today.
Happy birthday to me 🎂🥰❤️

157
34
528
14,173
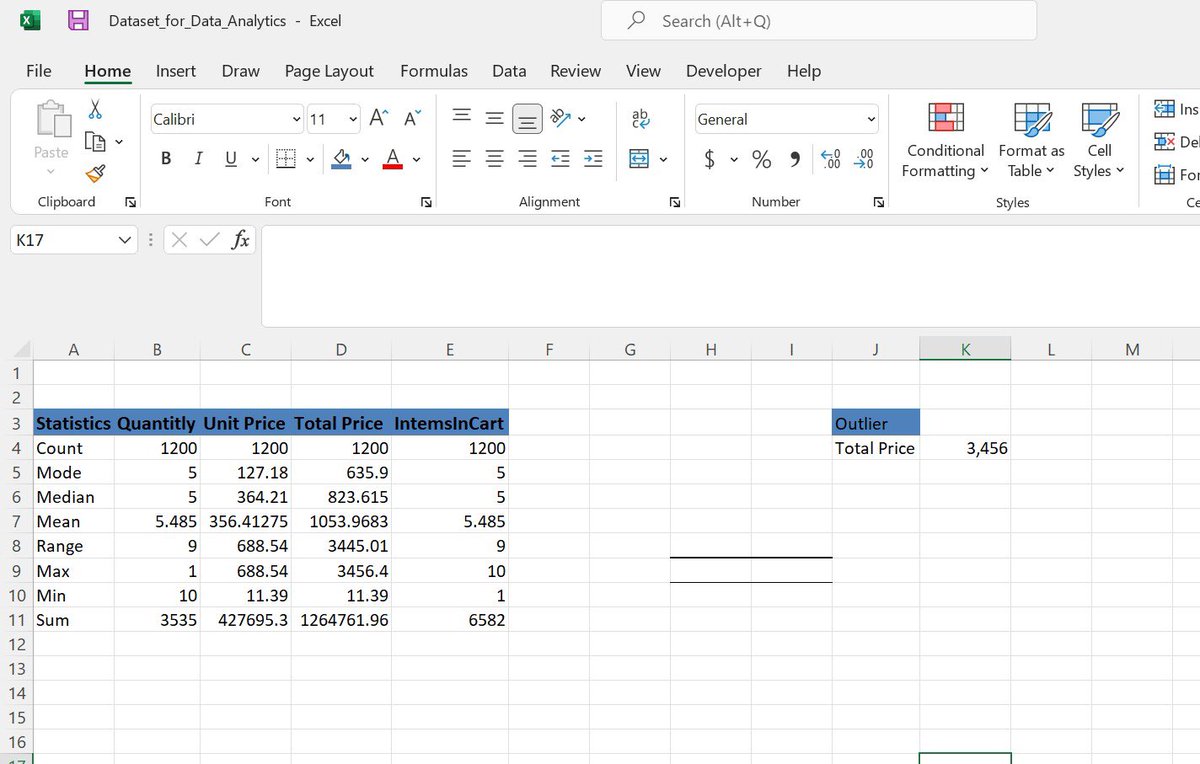
Did you know the importance of Data Analysis on excel Data tab?

1
1
5
174
Nice

After a few days away, I'm back and picking up right where I left off.
Honestly, this week has been really stressful but I finally have the chance to sit down and share this 😅
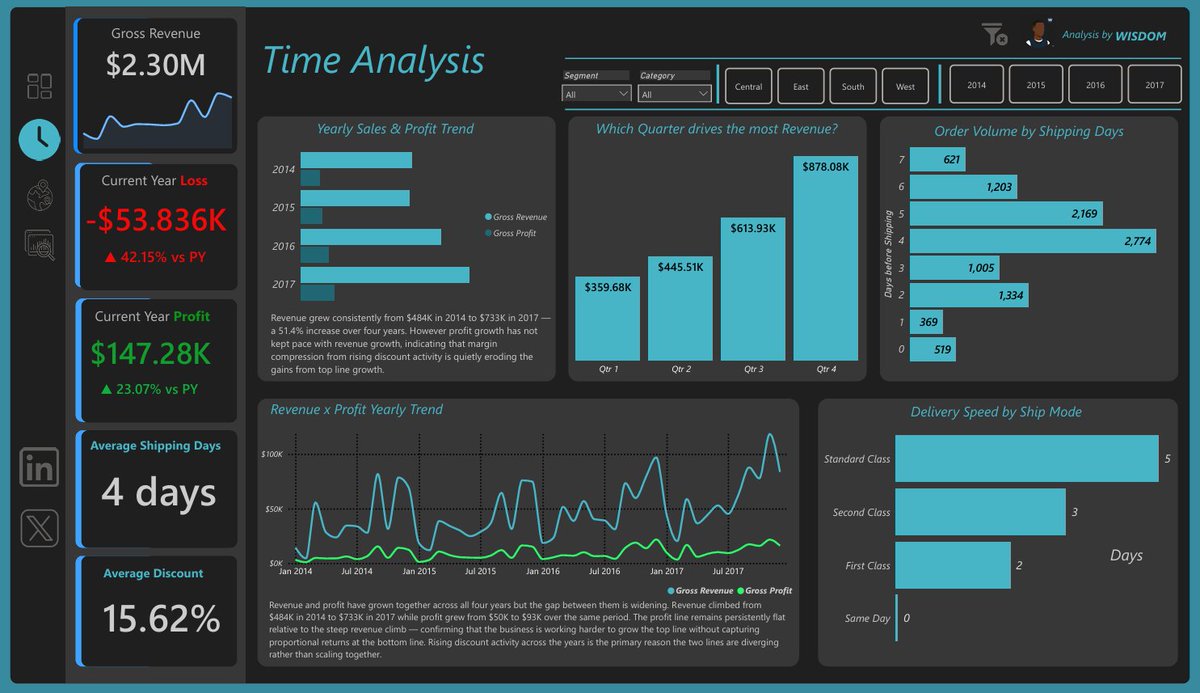
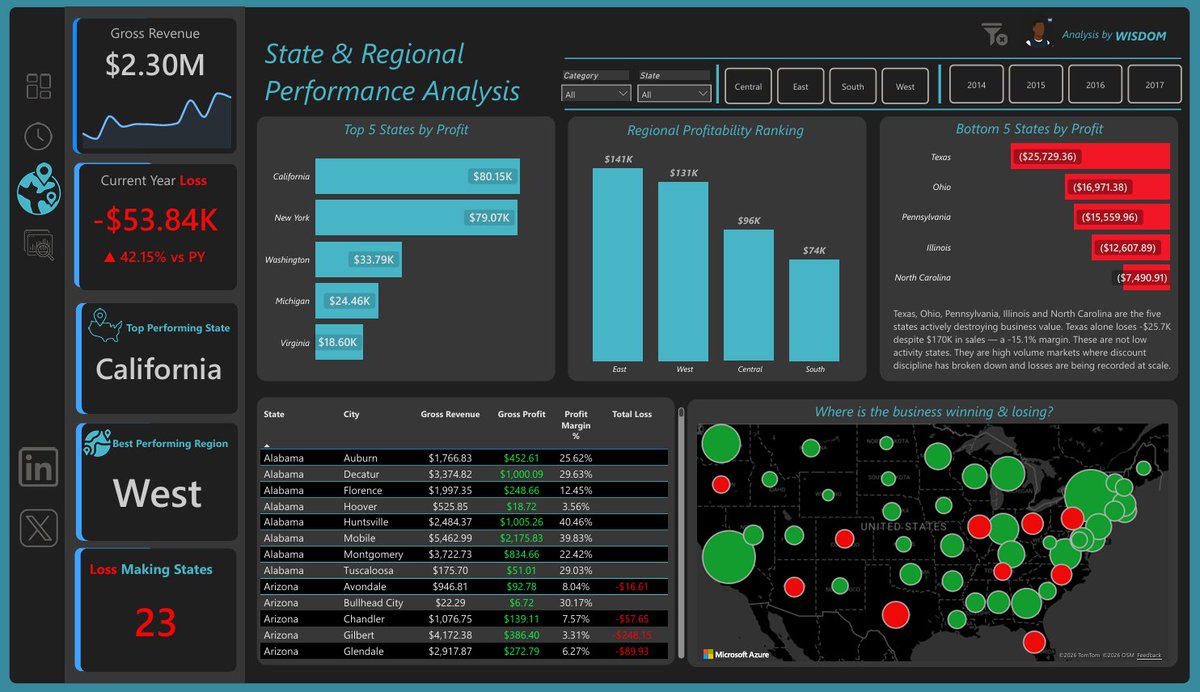
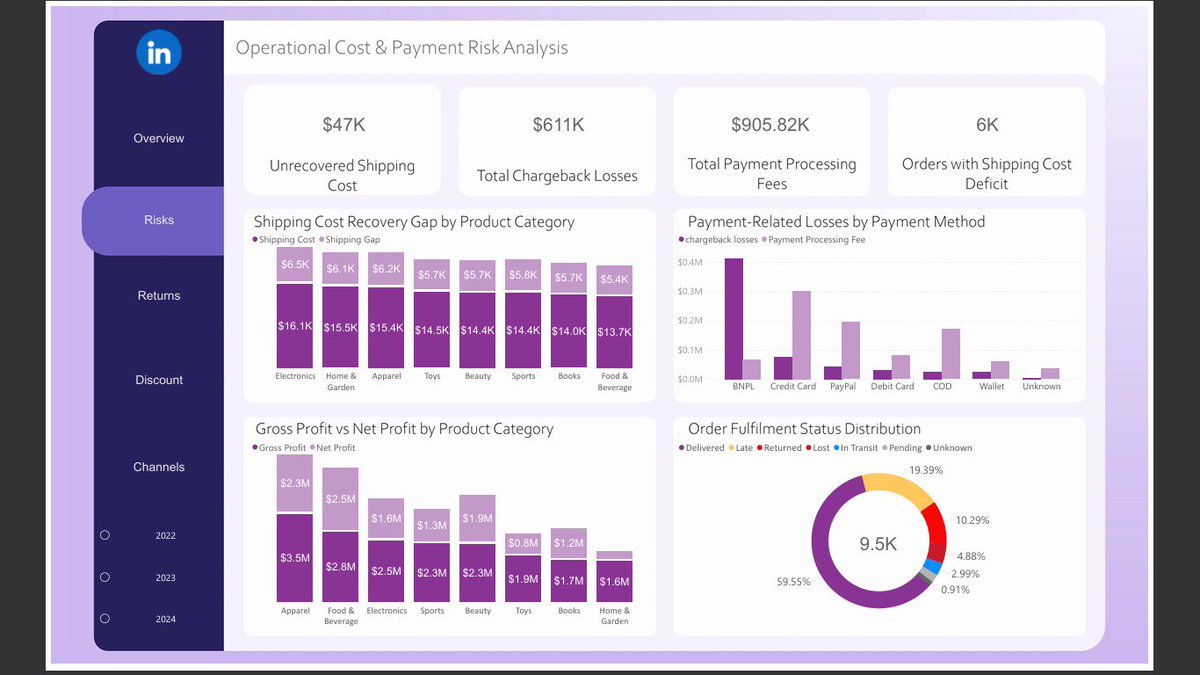
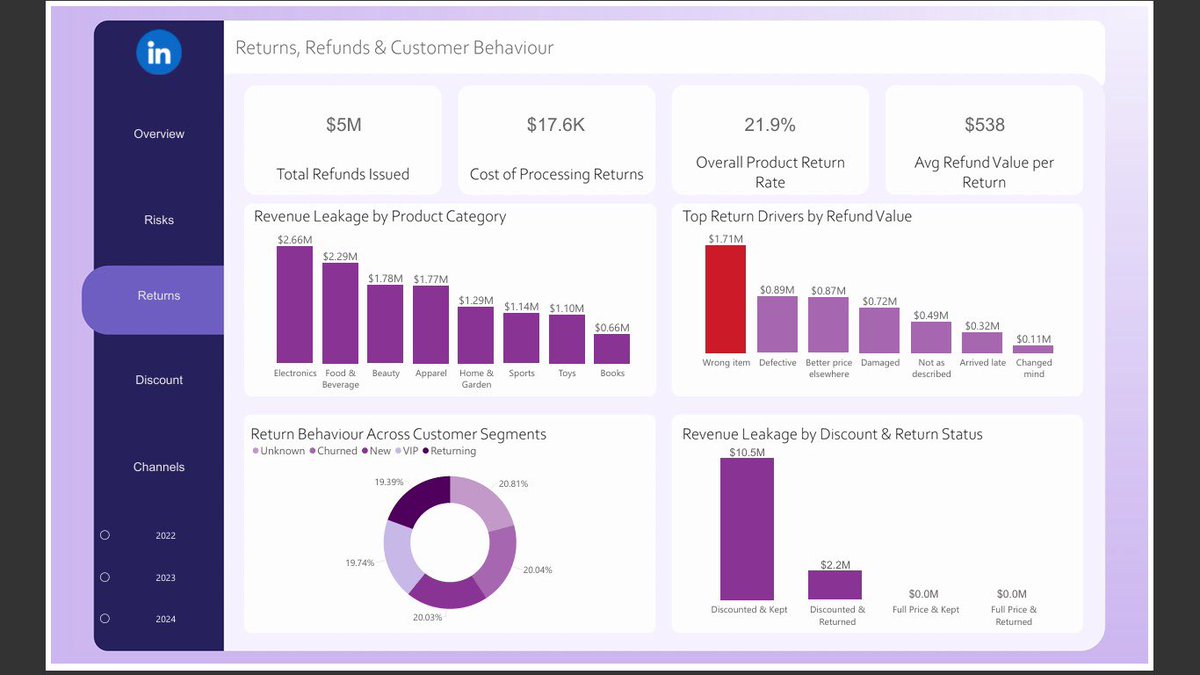
I completed a 4-page Power BI dashboard on the Sample Superstore dataset — and these are my findings👇

5
200
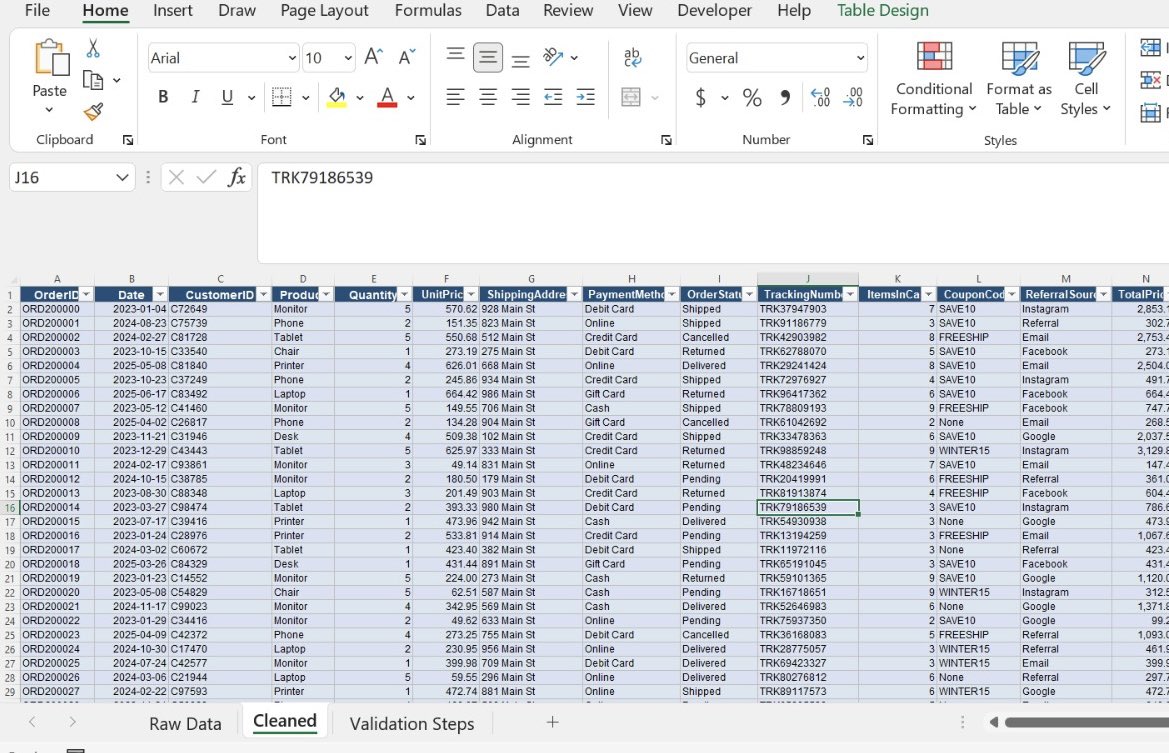
First internship task completed with @decodelab
The objectives was to manipulate the dataset from raw to ready for analysis.
=Remove duplicate values
=Resolve inconsistencies in data type and values
=Trim and clean
=Format Dates


1
7
205
Nice
Jun 4

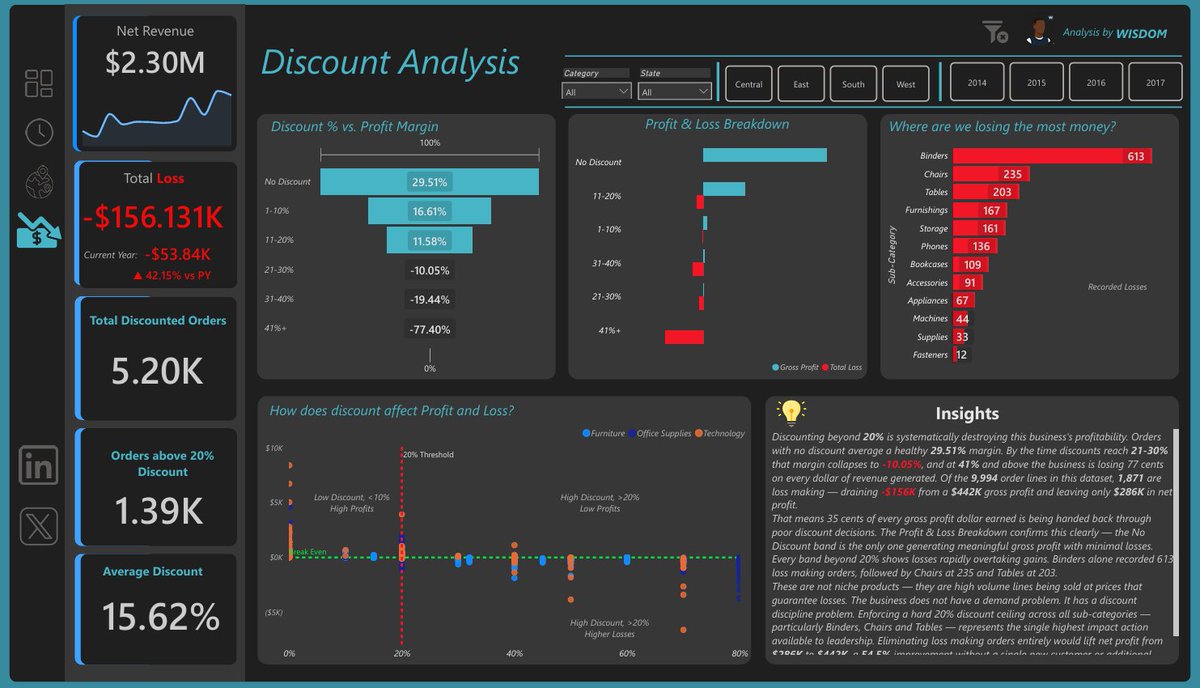
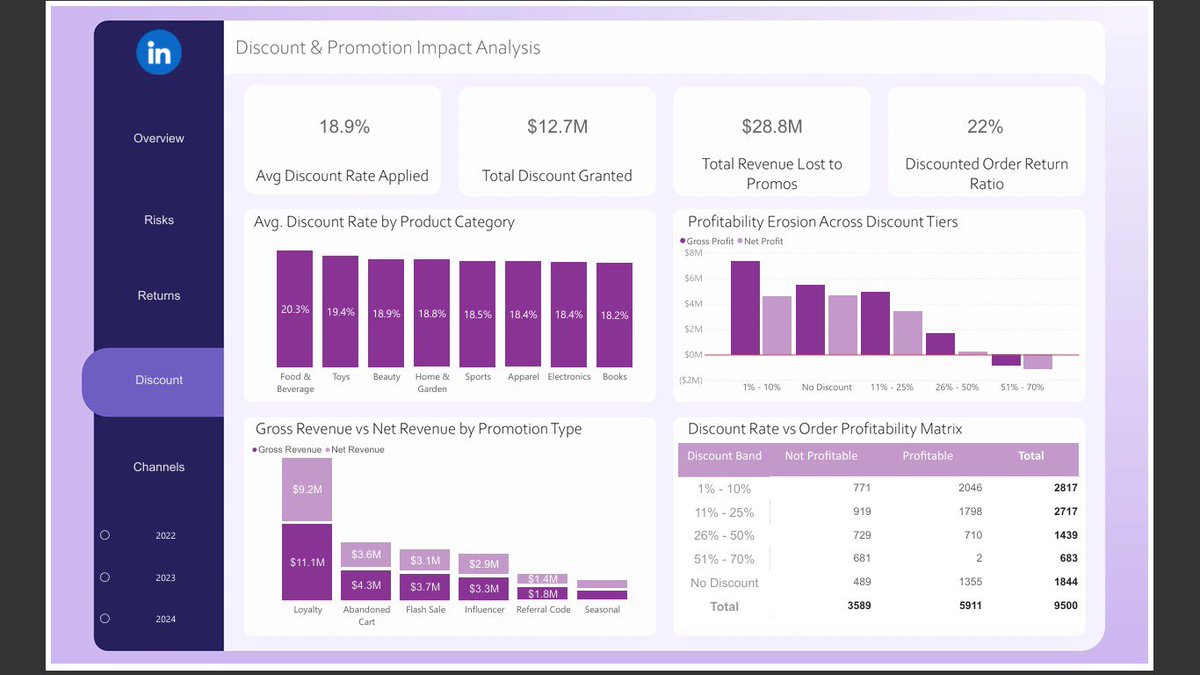
I just finished building a full end-to-end data analytics project and honestly, the messy part was the best part.
The project: E-Commerce Revenue Leakage & Profitability Audit The business question: Where is the company thinking it's making money but is actually losing it?

1
7
298
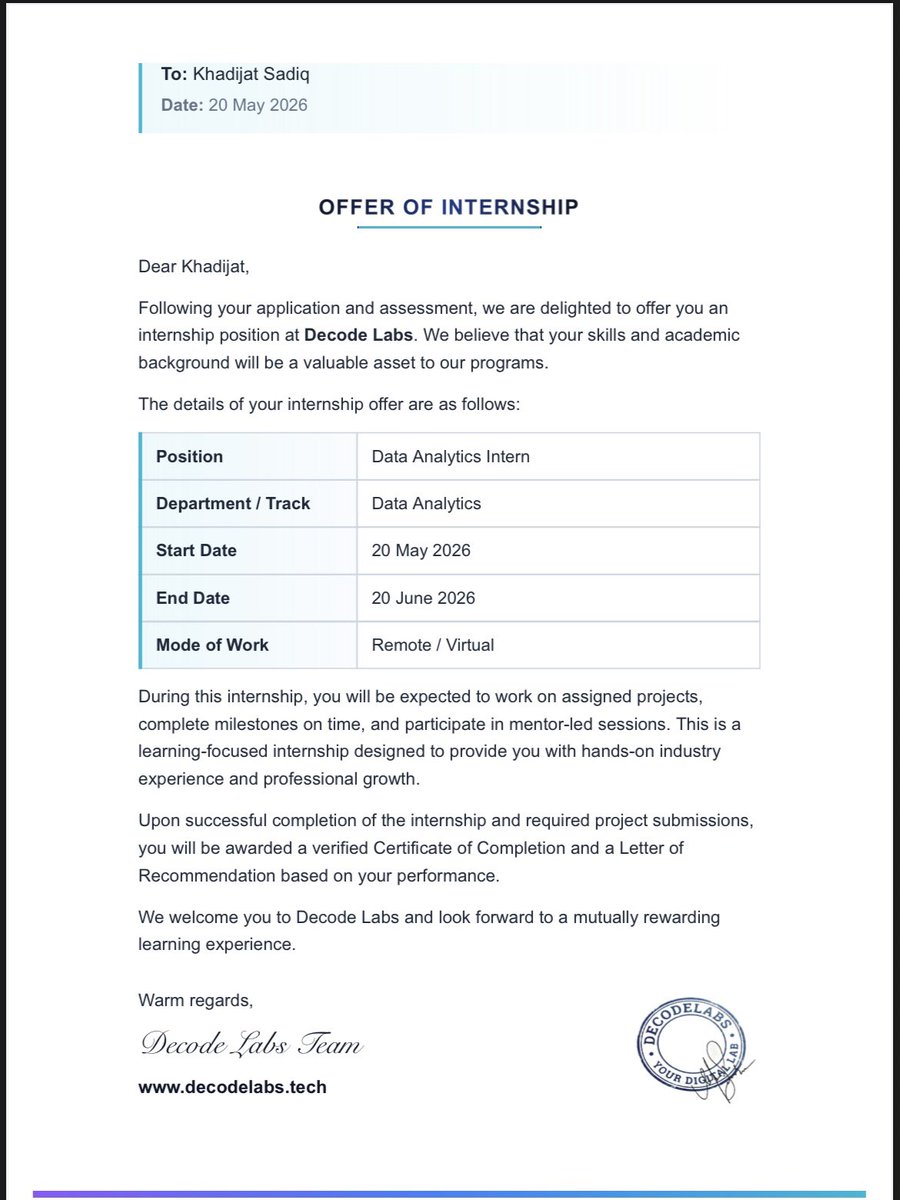
I’m excited to share that I’ve officially received an internship offer as a Data Analytics Intern with Decode Labs.
17
2
111
2,904