
Official statistics feed for the UK Department for Transport (DfT).
- Tweets 1,903
- Following 66
- Followers 4,379
- Likes 38

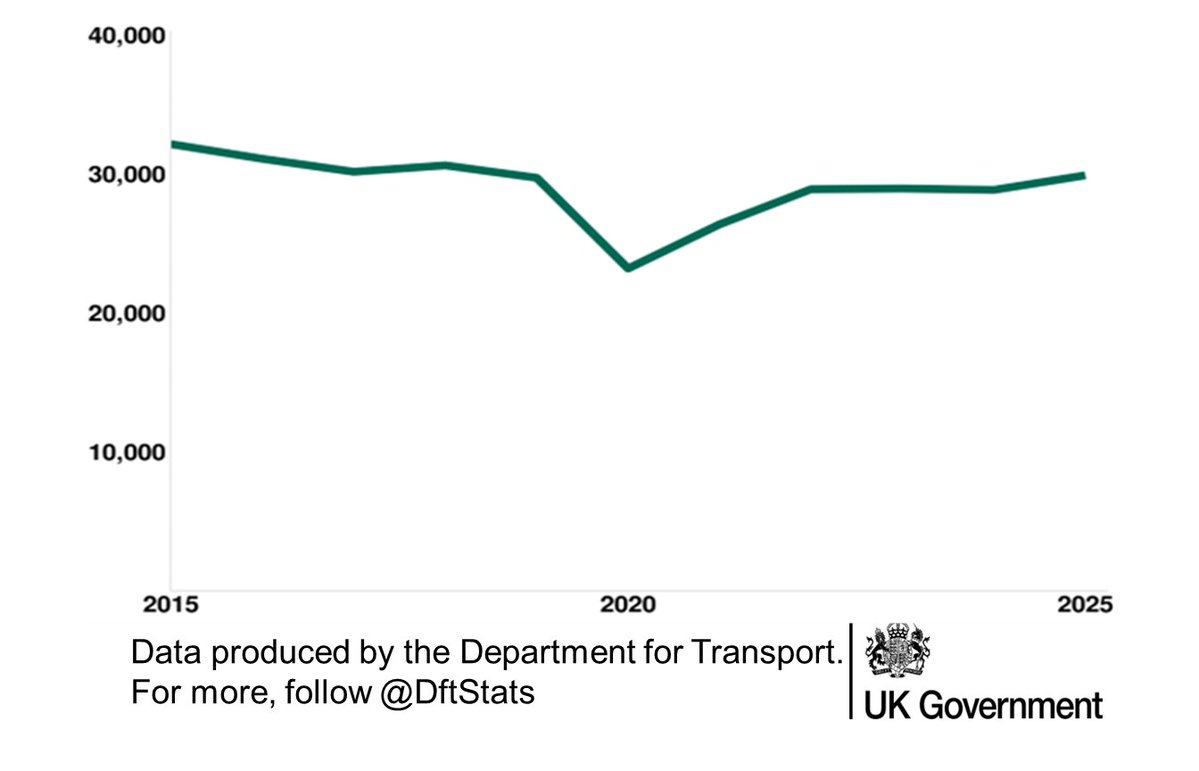


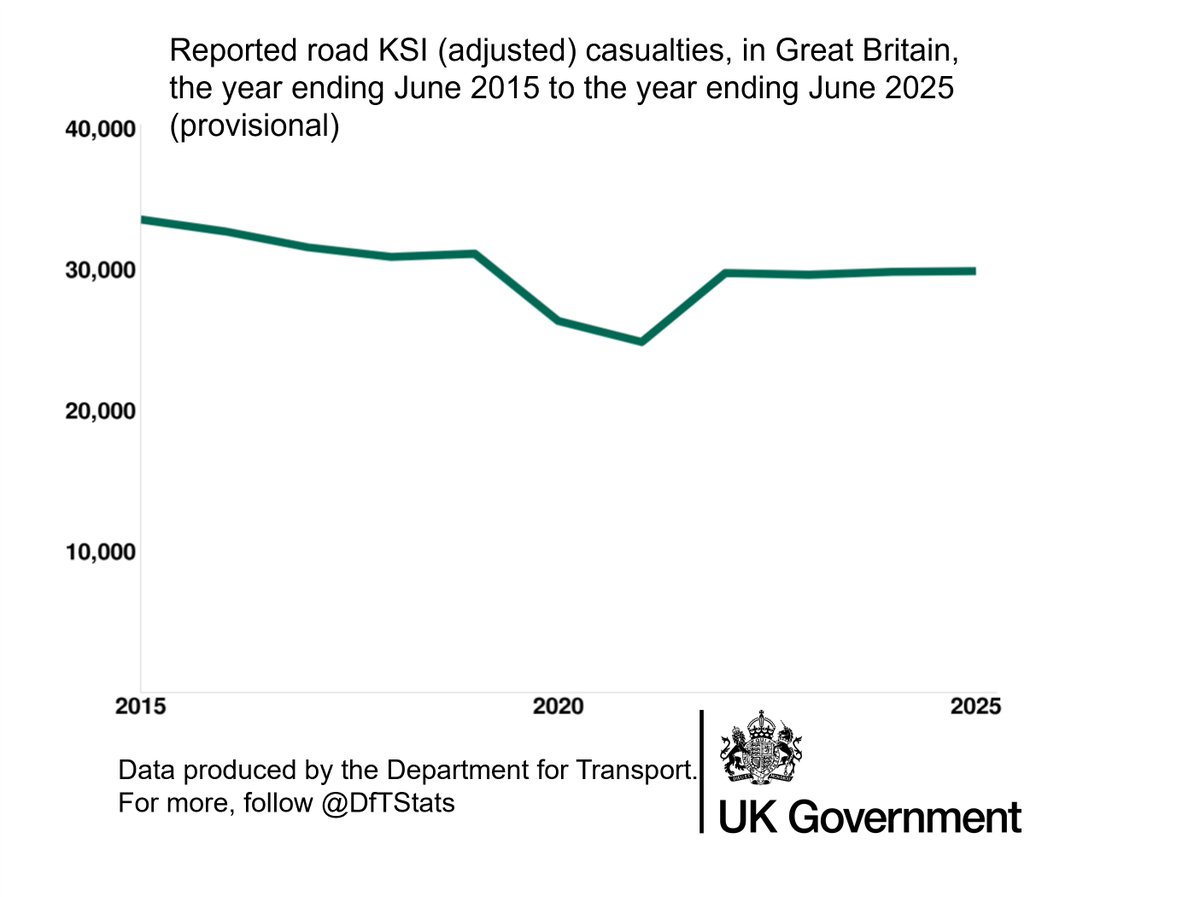


ALT The chart shows the number of killed or seriously injured (KSI) casualties in Road Traffic Collisions in Great Britain, each year from 2015 to 2025. KSI casualties have declined slightly from 32,157 in 2015 to 29,911 in 2025 (excluding the period impacted by COVID-19), with an increase from 28,864 in 2024 to 29,911 in 2025.
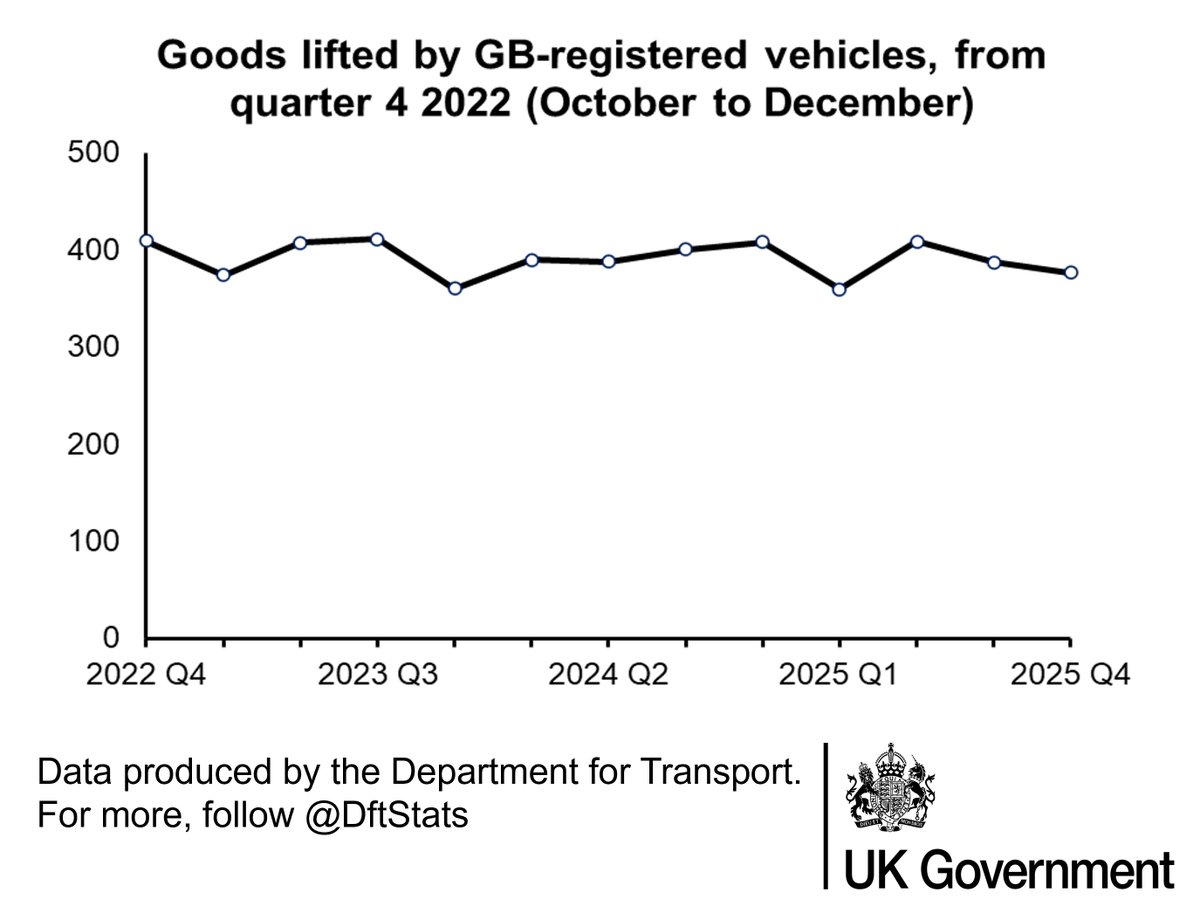
ALT A line chart that shows the quarterly trends of goods lifted by GB-registered vehicles. In 2025, 1.53 billion tonnes of goods were lifted, which is 3% lower than the previous year (1.59 billion tonnes).
ALT A line chart that shows the quarterly trends of goods lifted by GB-registered vehicles. In 2025, 1.53 billion tonnes of goods were lifted, which is 3% lower than the previous year (1.59 billion tonnes).
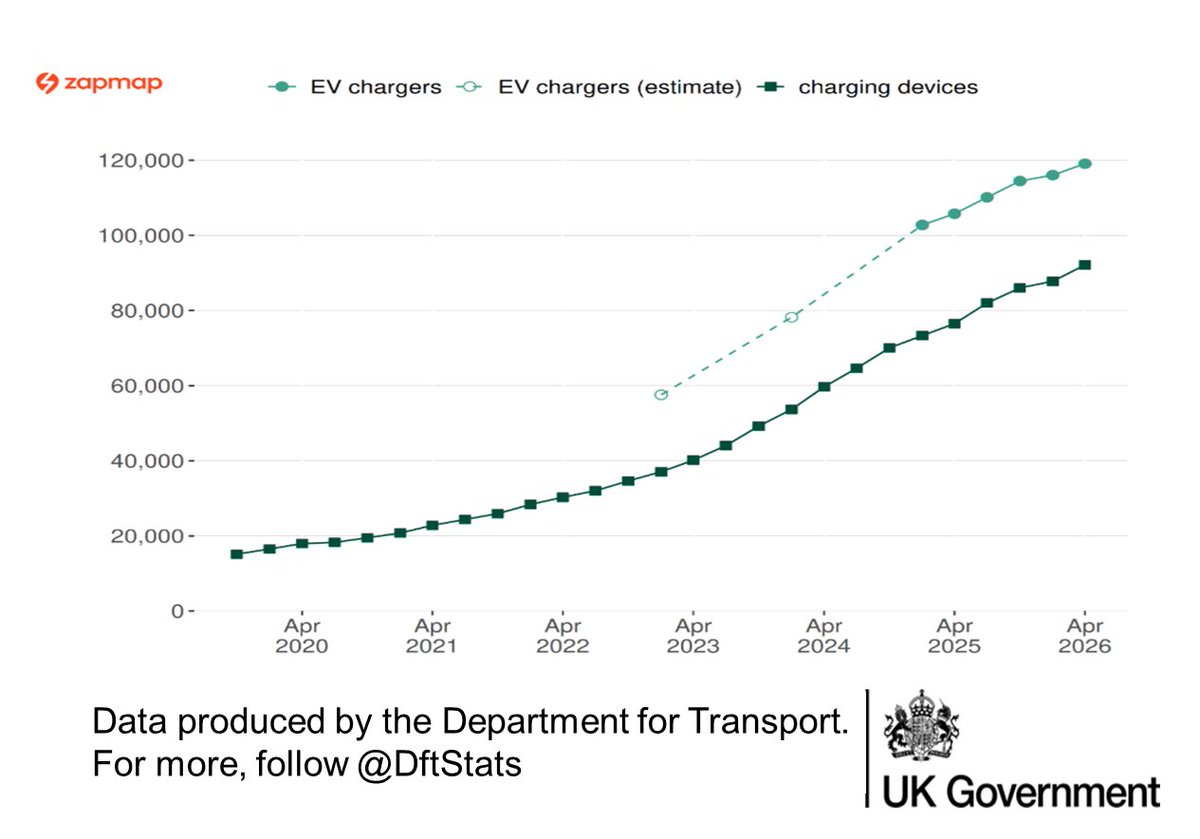
ALT A line chart showing the increase in public EV charging infrastructure over time. As of 1 April 2026 there were 119,080 public EV chargers in the UK.
ALT Stacked bar chart showing that the Electric Vehicle Chargepoint Grant Scheme has funded the installation of 32,451 sockets in the United Kingdom since the scheme was launched in 2022.
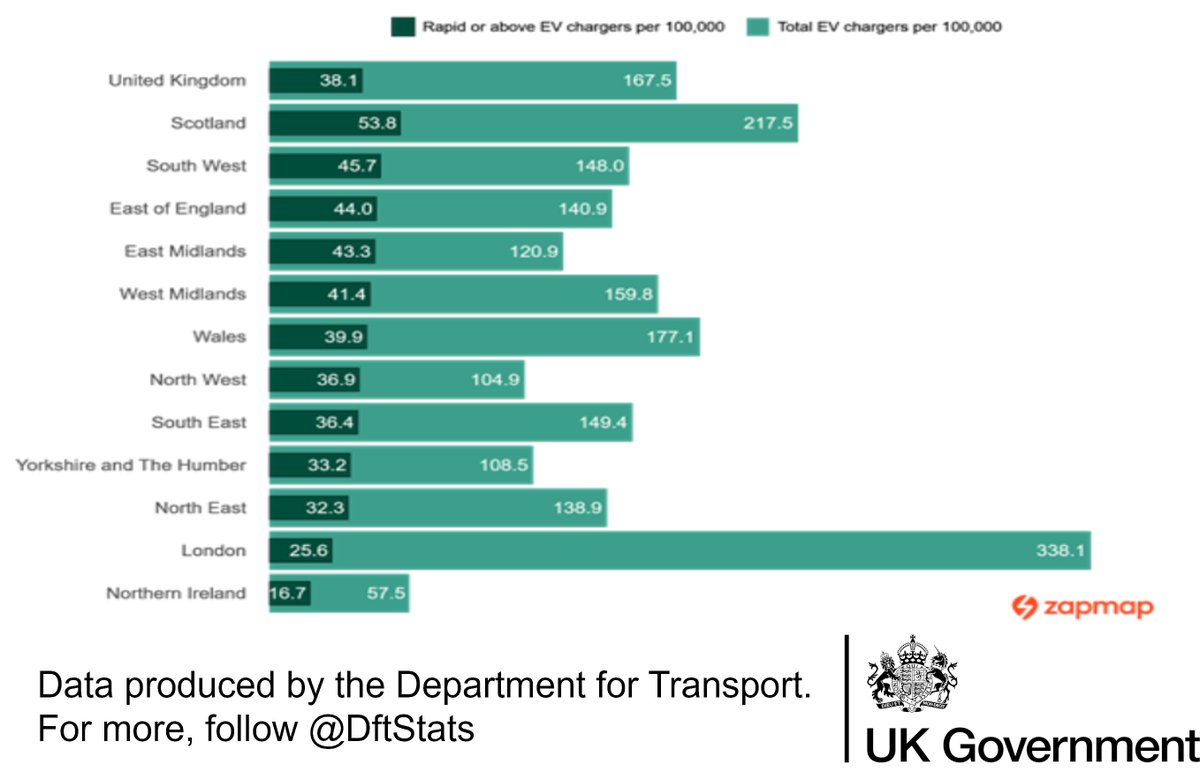
ALT A nested bar chart showing that as of 1 January 2026, across regions and countries of the United Kingdom, the distribution of rapid and above chargers is less variable than the total charger count. London had the most total EV chargers per capita with 338.1 per 100,000, yet the second lowest rated rapid or above, with 25.6 per 100,000.
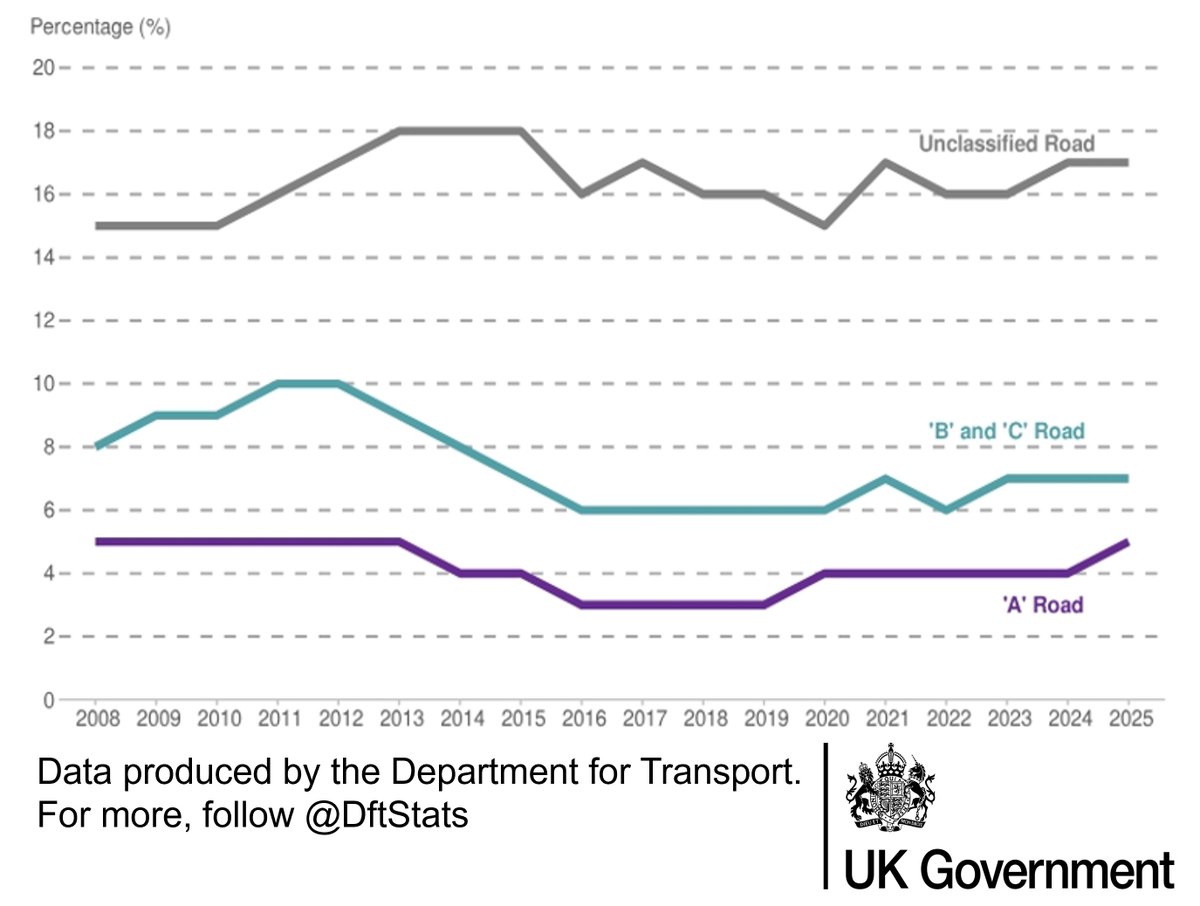
Road lengths in Great Britain: 2025
Road length estimates for Great Britain as of April 2025.
gov.uk