
Building on the back of successful investing strategies proven to outperform the SP500, this page will track 2 model portfolios based in those strategies.
Joined December 2022
- Tweets 517
- Following 458
- Followers 97
- Likes 15,801
436 Photos and videos


Pinned Tweet

15 Sep 2025
📌 READ FIRST — About This Page 📌
Hi, I’m running this project to show how everyday investors can potentially beat the market using quantitative, rules-based strategies — with minimal effort.
Over the past 2 years, I’ve backtested nearly 100 different quantitative strategies used over the last two decades. From there, I focus only on those that are:
✅ Consistently successful
✅ Still working in today’s market
✅ Showing recent momentum (because what’s working now often keeps working in the short term)
That research led to two portfolios I now track publicly:
🌊 Water Portfolio → built only from the very best performing quant strategies.
🌞 Sun Portfolio → a diversified mix of proven quant approaches, weighted toward those showing recent outperformance.
Both are rebalanced just once per month. In the age of $0 commission trading, especially for Canadians using a TFSA (tax-free investing), these kinds of strategies can be followed with little cost and no tax drag — showing that long-term outperformance doesn’t have to be complicated.
⚠️ Important: Investing always involves risk. This page is for educational purposes only — nothing here is financial advice. I’m not an advisor, broker, or analyst, and I can’t tell you what’s right for your personal situation. Please always do your own research and consult with a licensed professional before making investment decisions.
I’ll continue sharing monthly updates on both performance and new stock picks here. If you’re curious how Factor Momentum and quant strategies can outperform the benchmarks, follow along! 🚀
#Investing #QuantStrategies #FactorMomentum #TFSA
2
228
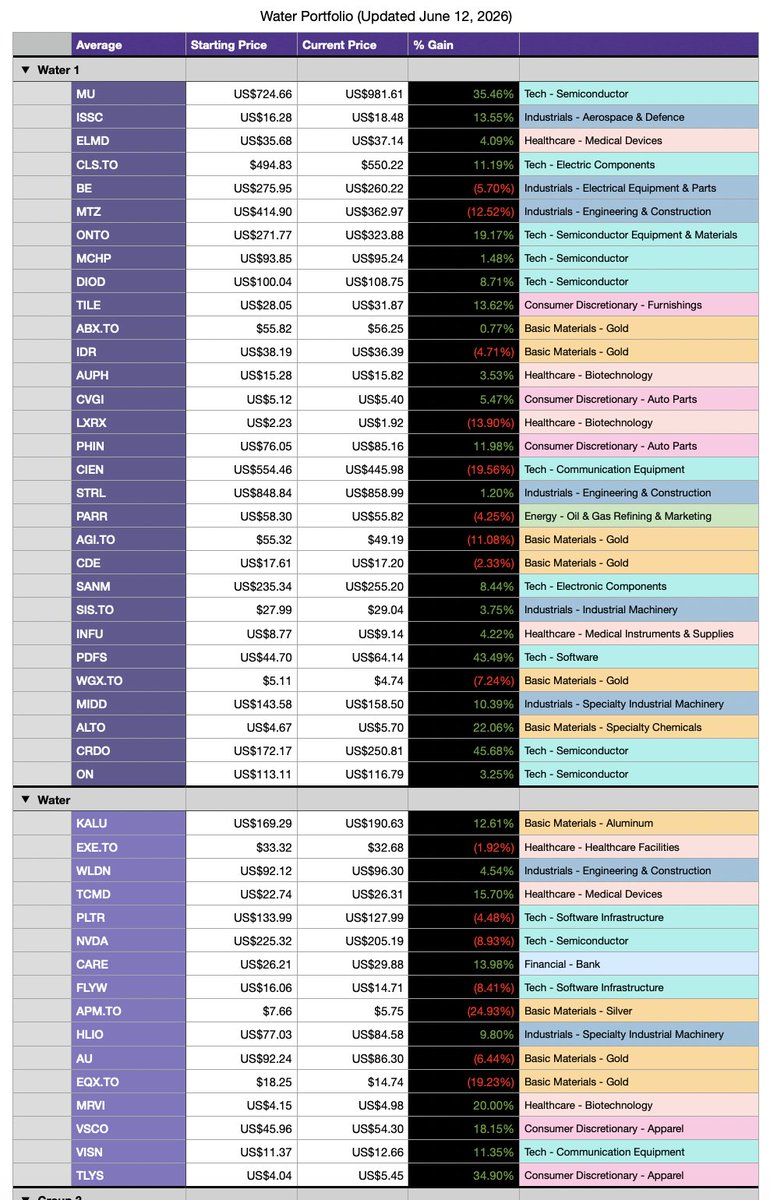
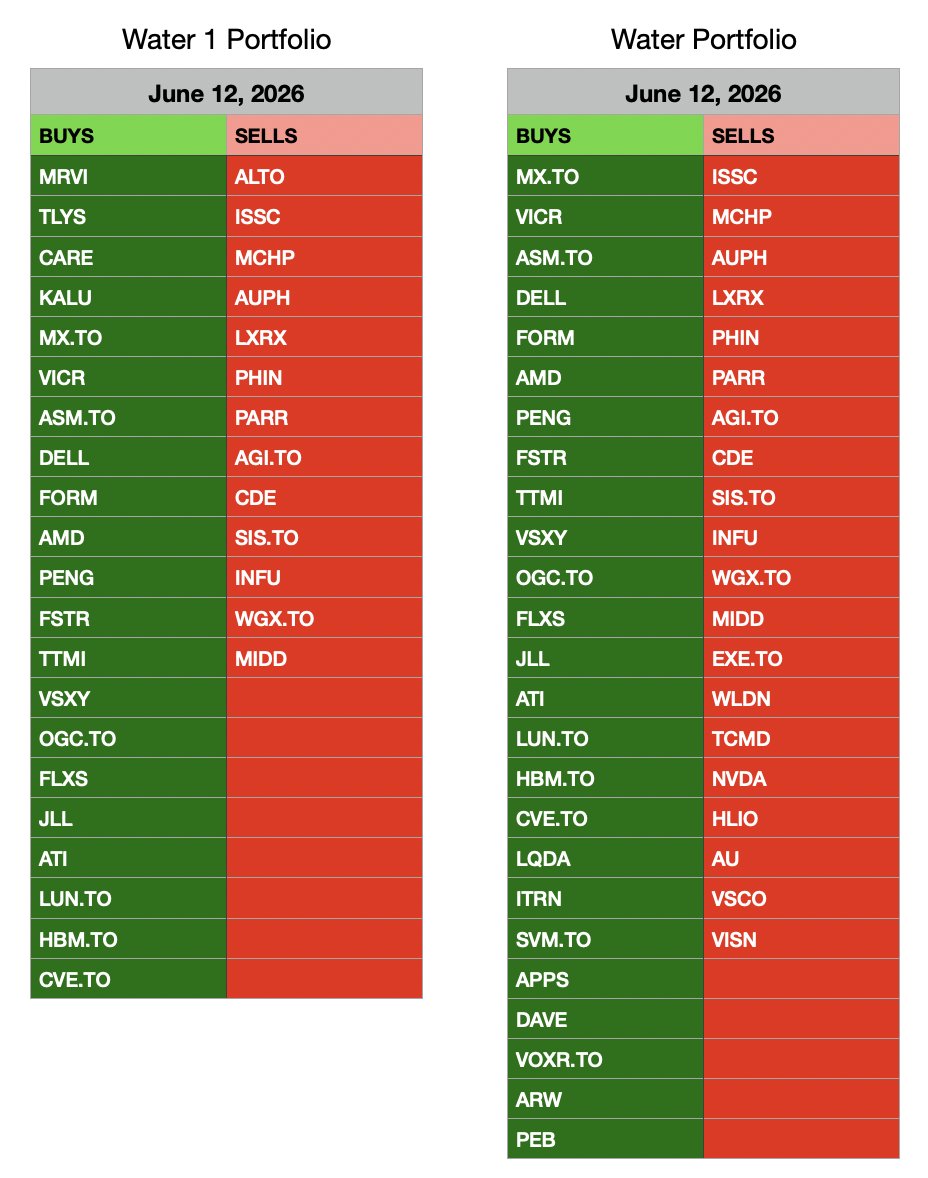
Water Portfolio Update 🌊 (June 12, 2026)
Fresh picks are now live for the next 30-day cycle.
Markets remained constructive this period, with strength broadening beyond the largest technology names. Small caps, industrials, materials, and cyclical sectors generally outperformed, creating a favorable environment for systematic stock selection and momentum-driven strategies.
The Water models benefited from this broader participation, delivering strong returns and outperforming both the S&P 500 and TSX 60 while keeping pace with a strong Russell 2000 benchmark.
Performance (May 15 → June 12):
🌊 Water 1: 6.34%
🌊 Water Portfolio: 5.58%
vs.
S&P 500: 0.35%
Russell 2000: 5.53%
TSX 60: 3.87%
Strong performance across both portfolios this cycle.
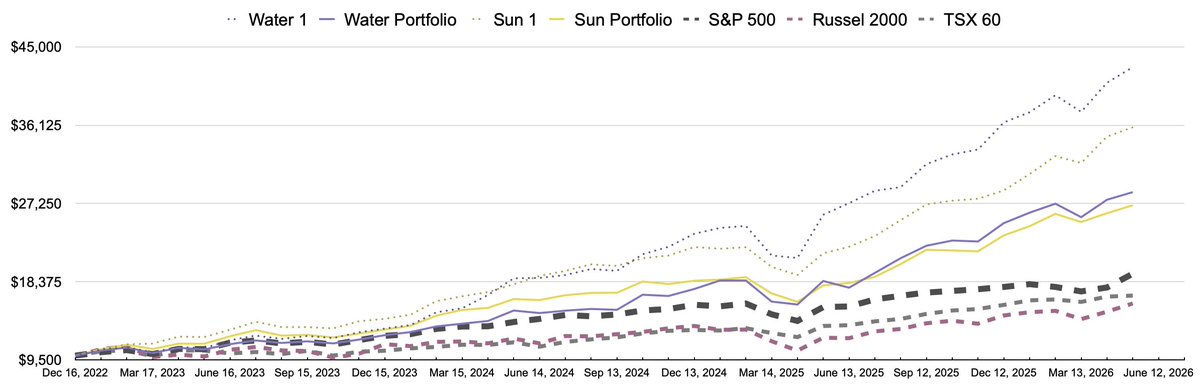
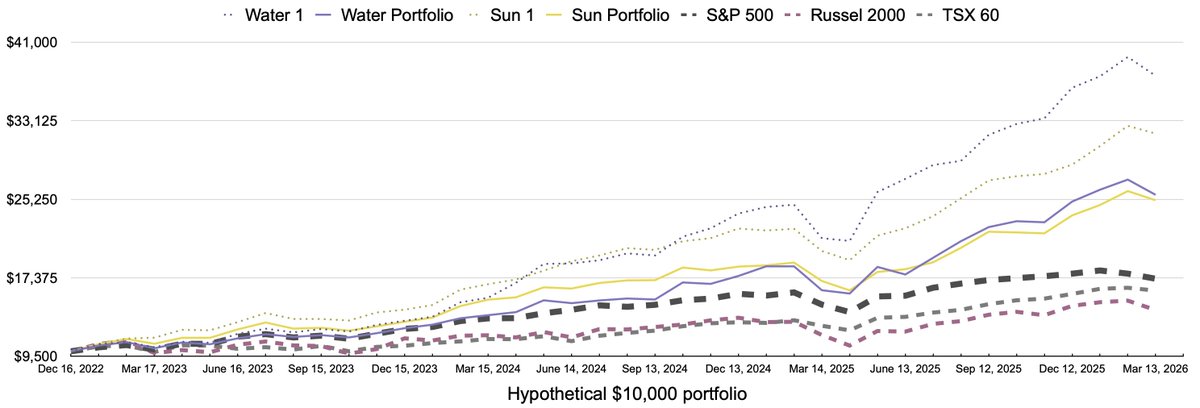
Track Record (Since Dec 2022):
🌊 Water 1: $10,000 → $45,419 (354%)
🌊 Water Portfolio: $10,000 → $30,134 (201%)
📊 S&P 500: $10,000 → $19,353 (93%)
A highly selective, rules-based process designed to identify the strongest opportunities across changing market environments.
How the Water portfolios are built:
Water uses only the highest-performing strategies from a ~100 model universe.
Unlike Sun, there is no averaging:
• Stocks either pass or fail each strategy
• Each pass earns a score relative to that strategies performance
• Scores are added together
🌊 Water 1 → Highest-scoring stocks (strict threshold)
🌊 Water Portfolio → All stocks above the core threshold
Because of this structure, portfolio size changes each month depending on how many names qualify.
Current Water 1 Holdings:
$MU
$CRDO
$ONTO
$MX.TO
$VICR
$ASM.TO
$BE
$MRVI
$STRL
$CIEN
$CLS.TO
$DELL
$FORM
$AMD
$DIOD
$ON
$PENG
$TILE
$ABX.TO
$ELMD
$IDR
$CVGI
$FSTR
$TLYS
$CARE
$MTZ
$TTMI
$VSXY
$OGC.TO
$FLXS
$JLL
$ATI
$LUN.TO
$HBM.TO
$KALU
$SANM
$PDFS
$CVE.TO
Current Water Portfolio:
Water 1
$LQDA
$PLTR
$ITRN
$SVM.TO
$APPS
$APM.TO
$DAVE
EQX.TO
ALTO
VOXR.TO
FLYW
ARW
PEB
Changes This Period:
Water 1 Buys:
MRVI TLYS CARE KALU
MX.TO VICR ASM.TO DELL FORM AMD PENG FSTR TTMI VSXY OGC.TO FLXS JLL ATI LUN.TO HBM.TO CVE.TO
Water 1 Sells:
ALTO ISSC MCHP AUPH LXRX PHIN PARR AGI.TO CDE
SIS.TO INFU WGX.TO MIDD
Water Portfolio Buys:
MX.TO VICR ASM.TO DELL FORM AMD PENG FSTR TTMI VSXY OGC.TO FLXS JLL ATI LUN.TO HBM.TO CVE.TO
LQDA ITRN SVM.TO APPS DAVE VOXR.TO ARW PEB
Water Portfolio Sells:
ISSC MCHP AUPH LXRX PHIN PARR AGI.TO CDE
SIS.TO INFU WGX.TO MIDD EXE.TO WLDN TCMD NVDA HLIO AU VSCO VISN
Positioning remains broadly diversified across technology infrastructure, industrials, materials, energy, and selective growth opportunities, reflecting the wider market participation seen over the past month.
Full portfolio, buys & sells in the visuals below.
#QuantInvesting #FactorMomentum #PortfolioUpdate
1
104
Sun Portfolio Update ☀️ (June 12, 2026)
Fresh picks are now live for the next 30-day cycle.
Markets remained constructive this period, though leadership broadened beyond the mega-cap names that dominated earlier in the year. Small caps, industrials, select cyclicals, and infrastructure-related themes continued to attract capital, creating a more favorable backdrop for systematic stock selection.
This environment proved beneficial for the Sun models, which outperformed all major benchmarks and benefited from strength across a diverse group of momentum-driven holdings.
Performance (May 15 → June 12):
☀️ Sun 1: 7.68%
☀️ Sun Portfolio: 5.19%
vs.
S&P 500: 0.35%
Russell 2000: 5.53%
TSX 60: 3.87%
Strong relative performance from both portfolios this cycle.
Track Record (Since Dec 2022):
☀️ Sun 1: $10,000 → $38,643 (286%)
☀️ Sun Portfolio: $10,000 → $28,453 (184%)
📊 S&P 500: $10,000 → $$19,353 (93%)
Built across multiple market environments — inflation shocks, aggressive rate hikes, regional banking stress, geopolitical uncertainty, and shifting factor leadership — using a fully systematic process.
How the Sun portfolios are built:
☀️ Sun Portfolio (25 stocks)
- Top 25 stocks ranked by weighted average score across ~100 quantitative strategies.
☀️ Sun 1 (13 stocks)
- A concentrated subset containing the top 13 ranked names.
Each stock is evaluated across a large library of proven strategies. Higher weight is assigned to the models currently producing the strongest performance.
Current Sun 1 Holdings:
$MU
$ASM.TO
$CRDO
$TILE
$DELL
$STRL
$OGC.TO
$BE
$ONTO
$AMD
$VICR
$TER
$IDR
Current Sun Portfolio (25):
Sun 1
$ELMD
$NVDA
$JLL
$FIVE
$VSXY
$MRVI
$CIEN
$ON
$ARW
$ITRN
$MTZ
$NBIX
Changes This Period:
Sun 1 Buys:
ASM.TO CRDO DELL OGC.TO AMD VICR TER
Sun 1 Sells:
ISSC ELMD SANM CLS.TO NVDA DIOD SIS.TO
Sun Portfolio Buys:
ASM.TO CRDO DELL VICR
JLL FIVE VSXY MRVI CIEN ARW ITRN NBIX
Sun Portfolio Sells:
ISSC SANM CLS.TO DIOD SIS.TO
AUPH MCHP PPIH TCMD NUE INFU TOT.TO
Positioning continues to emphasize technology infrastructure, semiconductors, industrial momentum, and select cyclical growth opportunities heading into the next rebalance period.
Full breakdowns and charts in the visuals below.
#QuantInvesting #FactorMomentum #PortfolioUpdate

81
1/3
📊 RESULTS: May 15 – June 12, 2026
Markets were mixed this period as early strength in equities gave way to more rotational conditions. Small caps and select cyclical areas outperformed, while large-cap leadership was less consistent compared to the prior month. Overall momentum remained positive, but dispersion across sectors increased.
Against this backdrop, factor-driven strategies showed stronger relative performance versus the prior cycle, with both Sun and Water models outperforming broader benchmarks.
🌊 Water 1: 6.34%
🌊 Water Portfolio: 5.58%
☀️ Sun 1: 7.68%
☀️ Sun Portfolio: 5.19%
vs. Benchmarks:
#SP500: 0.35%
#Russell2000: 5.53%
#TSX60: 3.87%
More details below. Monthly portfolio updates for both Sun and Water models will be shared later today.
#QuantInvesting #FactorMomentum #PortfolioUpdate
1
20
2/3
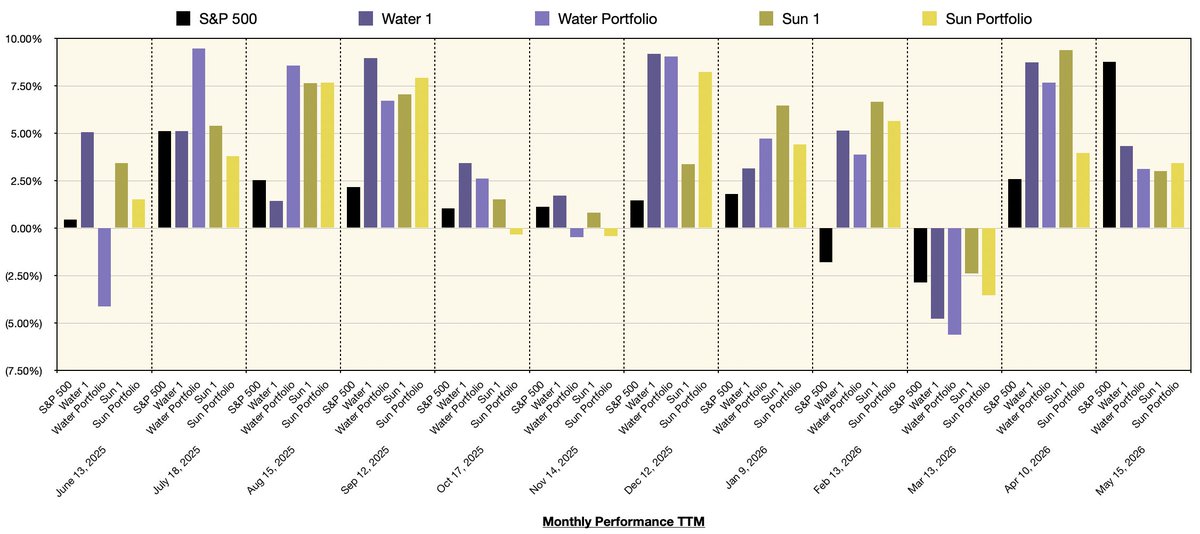
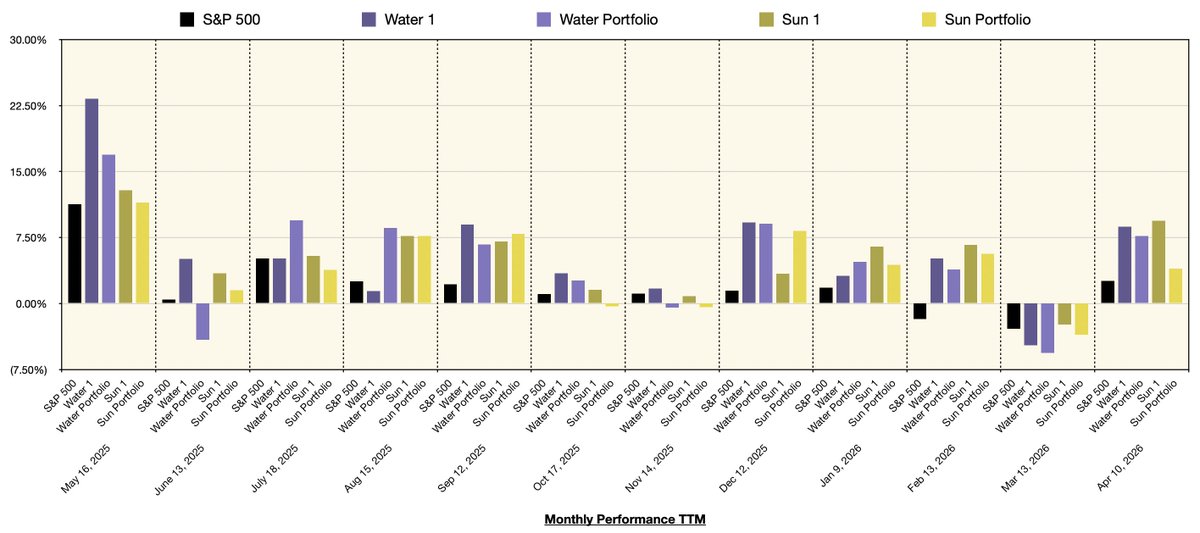
📊Detailed ~30 day performance data for the most recent trailing twelve ~30 day periods
1
1
13
3/3
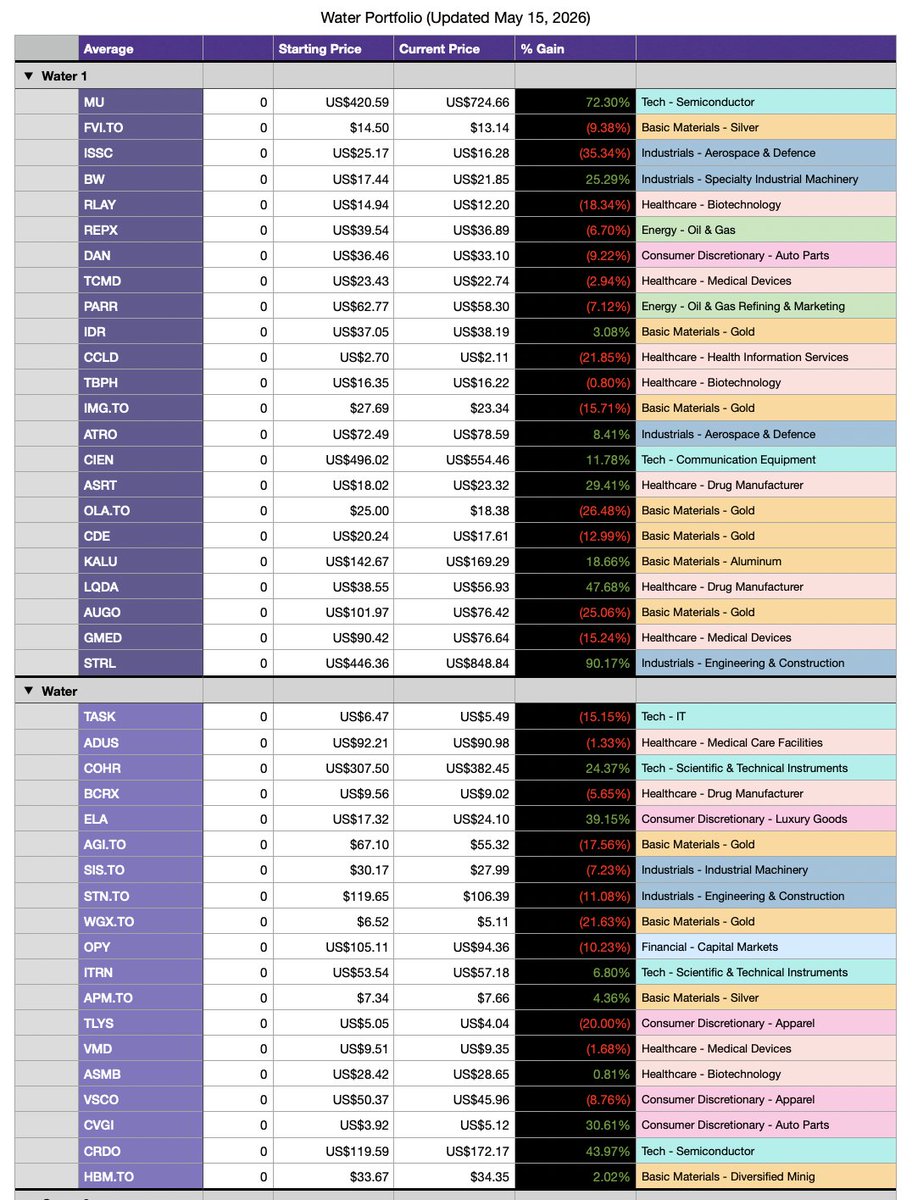
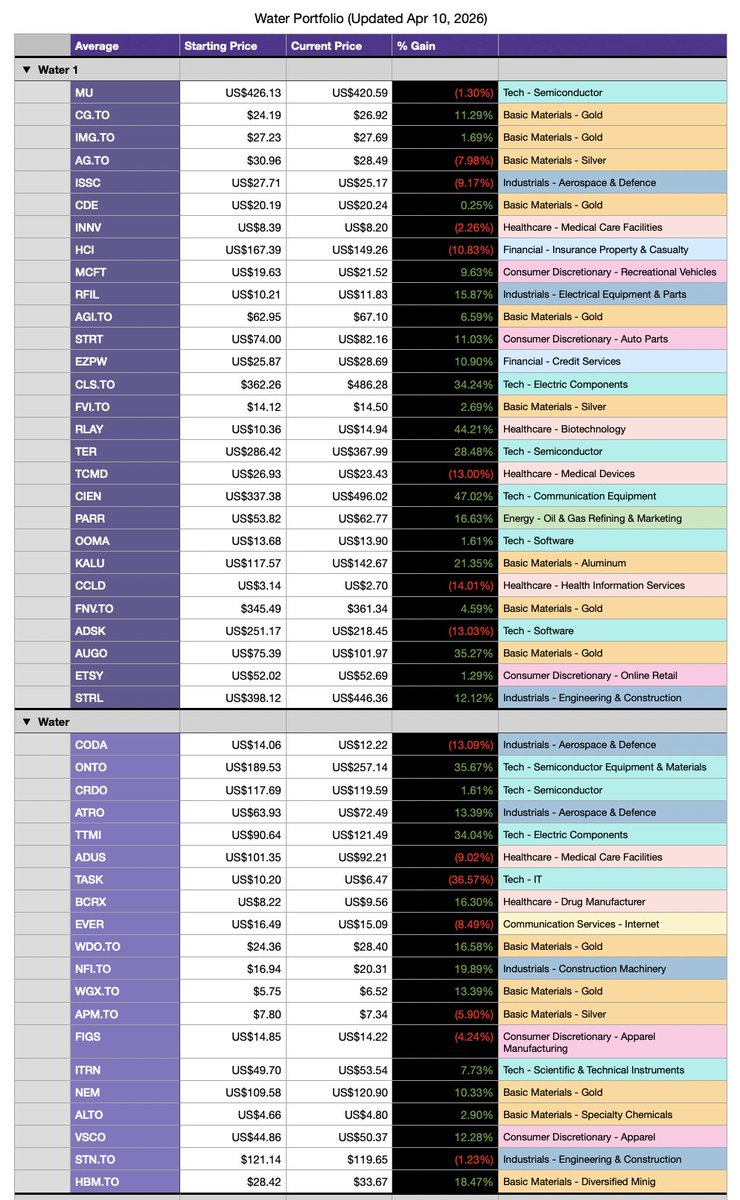
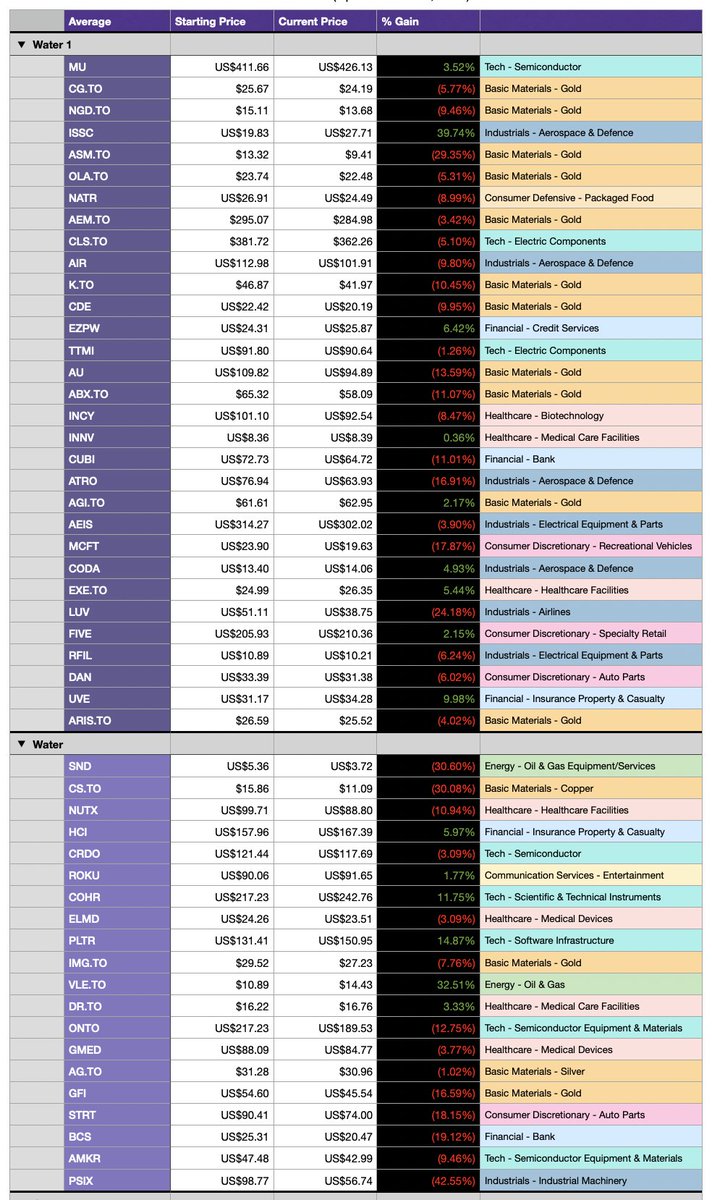
Detailed stock performance for both Water & Sun portfolios.
*Note that the darker shaded cells in both tables denote the Water 1 & Sun 1 portfolios, while the entire table represents the Water & Sun portfolios.

13
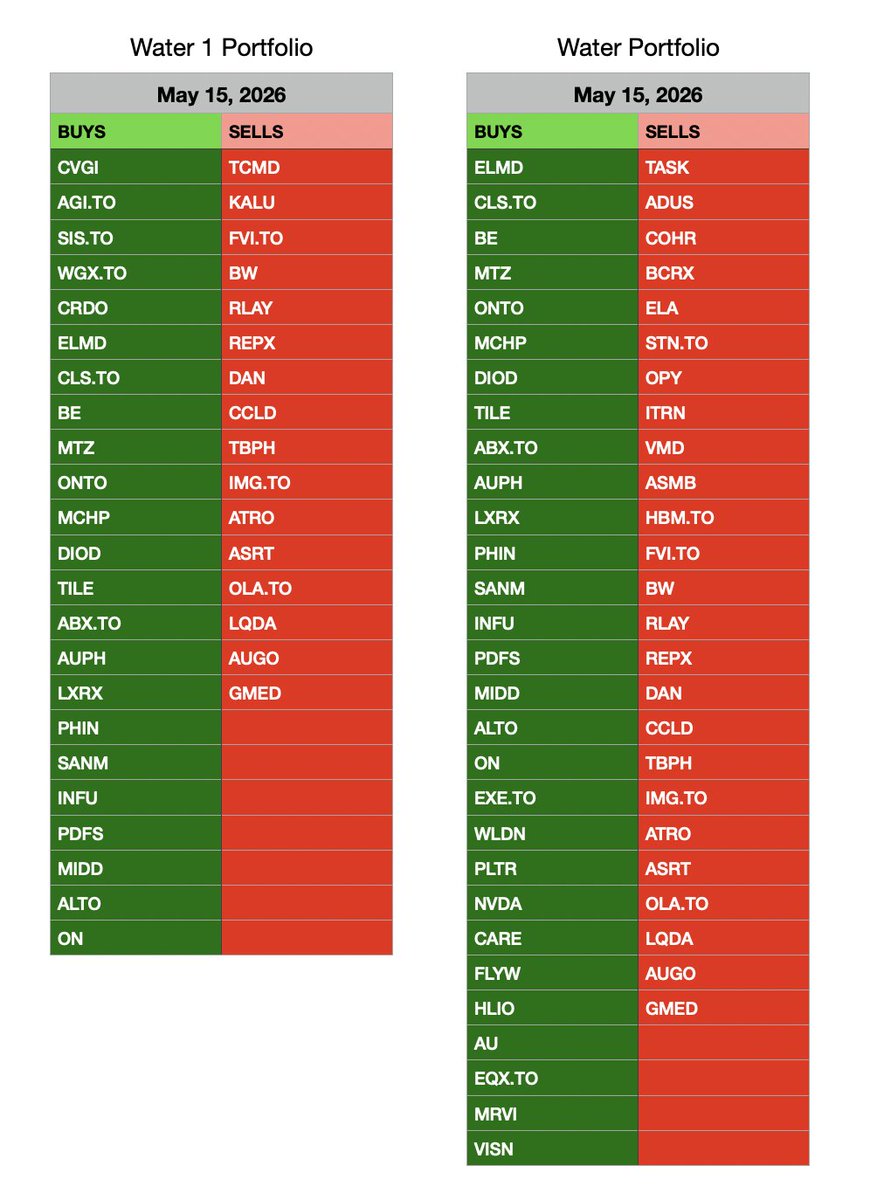
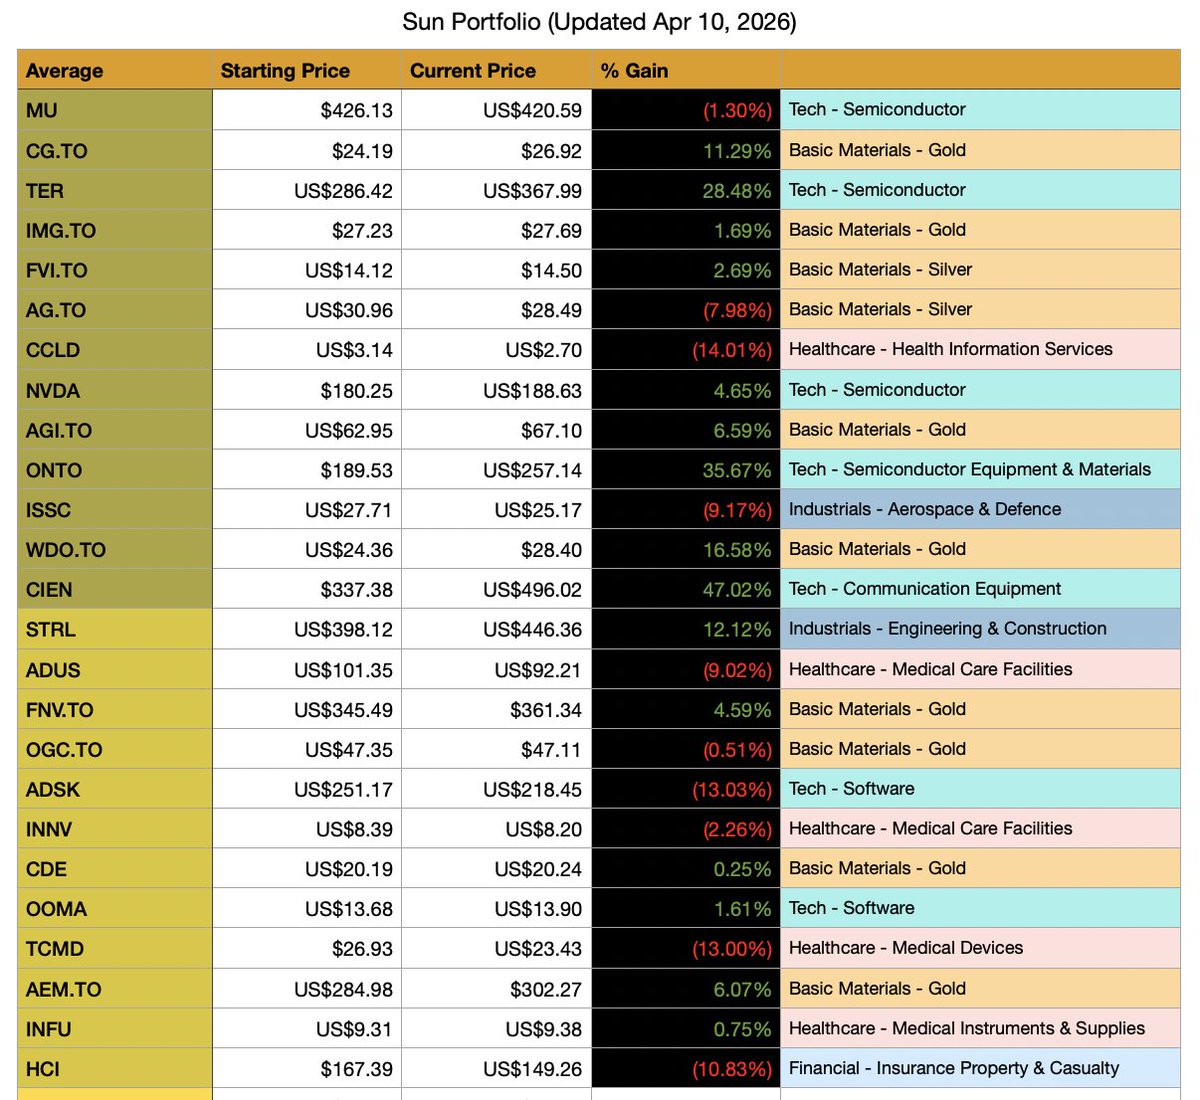
Water Portfolio Update 🌊 (May 15, 2026)
Fresh picks are now live for the next 30-day cycle.
Markets continued pushing higher this period, led by large-cap U.S. equities, semiconductors, and AI infrastructure names. Breadth improved overall, though performance remained strongest in a relatively narrow group of mega-cap leaders.
The Water models remained constructive on momentum and cyclical growth exposure, though the more concentrated and selective structure lagged the broader index rally this cycle.
Performance (Apr 10 → May 15):
🌊 Water 1: 4.33%
🌊 Water Portfolio: 3.13%
vs.
S&P 500: 8.79%
Russell 2000: 6.24%
TSX 60: 0.69%
Track Record (Since Dec 2022):
🌊 Water 1: $10,000 → $42,711
🌊 Water Portfolio: $10,000 → $28,540
A highly selective, rules-based process designed to identify the strongest opportunities across changing market environments.
How the Water portfolios are built:
Water uses only the highest-performing strategies from a ~100 model universe.
Unlike Sun, there is no averaging:
• Stocks either pass or fail each strategy
• Each pass earns a score
• Scores are added together
🌊 Water 1 → Highest-scoring stocks (strict threshold)
🌊 Water Portfolio → All stocks above the core threshold
Because of this structure, portfolio size changes each month depending on how many names qualify.
Current Water 1 Holdings:
$MU
$ISSC
$ELMD
$CLS.TO
$BE
$MTZ
$ONTO
$MCHP
$DIOD
$TILE
$ABX.TO
$IDR
$AUPH
$CVGI
$LXRX
$PHIN
$CIEN
$STRL
$PARR
$AGI.TO
$CDE
$SANM
$SIS.TO
$INFU
$PDFS
$WGX.TO
$MIDD
$ALTO
$CRDO
$ON
Current Water Portfolio:
Water 1
$KALU
$EXE.TO
$WLDN
$TCMD
$PLTR
$NVDA
$CARE
$FLYW
$APM.TO
$HLIO
$AU
$EQX.TO
$MRVI
$VSCO
$VISN
$TLYS
Changes This Period:
Water 1 Buys:
CVGI AGI.TO SIS.TO WGX.TO CRDO ELMD CLS.TO BE MTZ ONTO MCHP DIOD TILE ABX.TO AUPH LXRX PHIN SANM INFU PDFS MIDD ALTO ON
Water 1 Sells:
TCMD KALU FVI.TO BW RLAY REPX DAN CCLD TBPH
IMG.TO ATRO ASRT OLA.TO LQDA AUGO GMED
Water Portfolio Buys:
ELMD CLS.TO BE MTZ ONTO MCHP DIOD TILE
ABX.TO AUPH LXRX PHIN SANM INFU PDFS MIDD ALTO ON EXE.TO WLDN PLTR NVDA CARE FLYW HLIO AU EQX.TO MRVI VISN
Water Portfolio Sells:
TASK ADUS COHR BCRX ELA STN.TO OPY ITRN VMD ASMB HBM.TO FVI.TO BW RLAY REPX DAN CCLD TBPH IMG.TO ATRO ASRT OLA.TO LQDA AUGO GMED
Positioning remains tilted toward semiconductors, industrial momentum, selective resource exposure, and higher-scoring growth names heading into the next rebalance.
Full breakdowns and charts in the visuals below.
#QuantInvesting #FactorMomentum #PortfolioUpdate
49
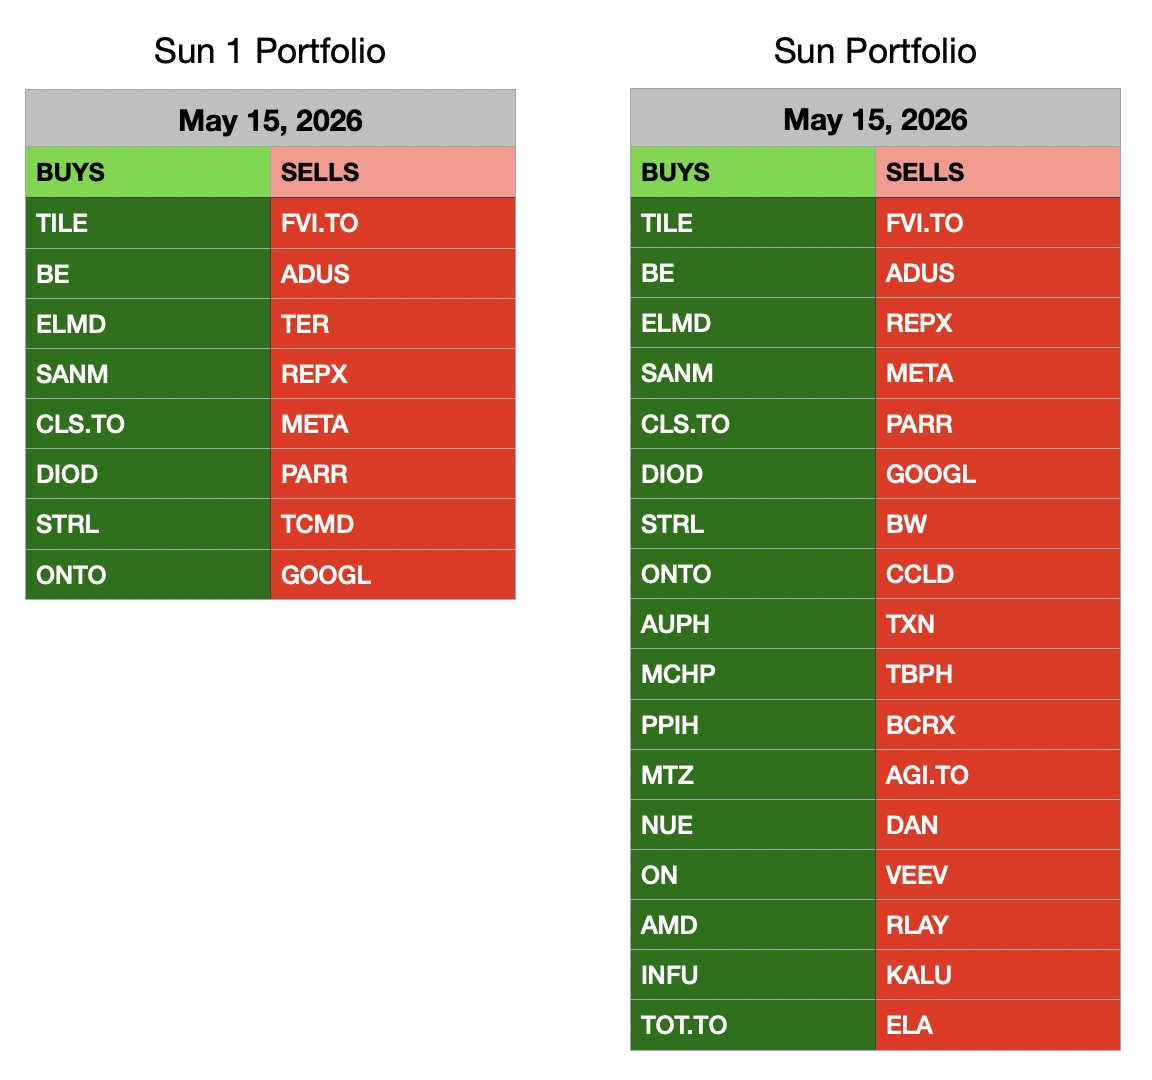
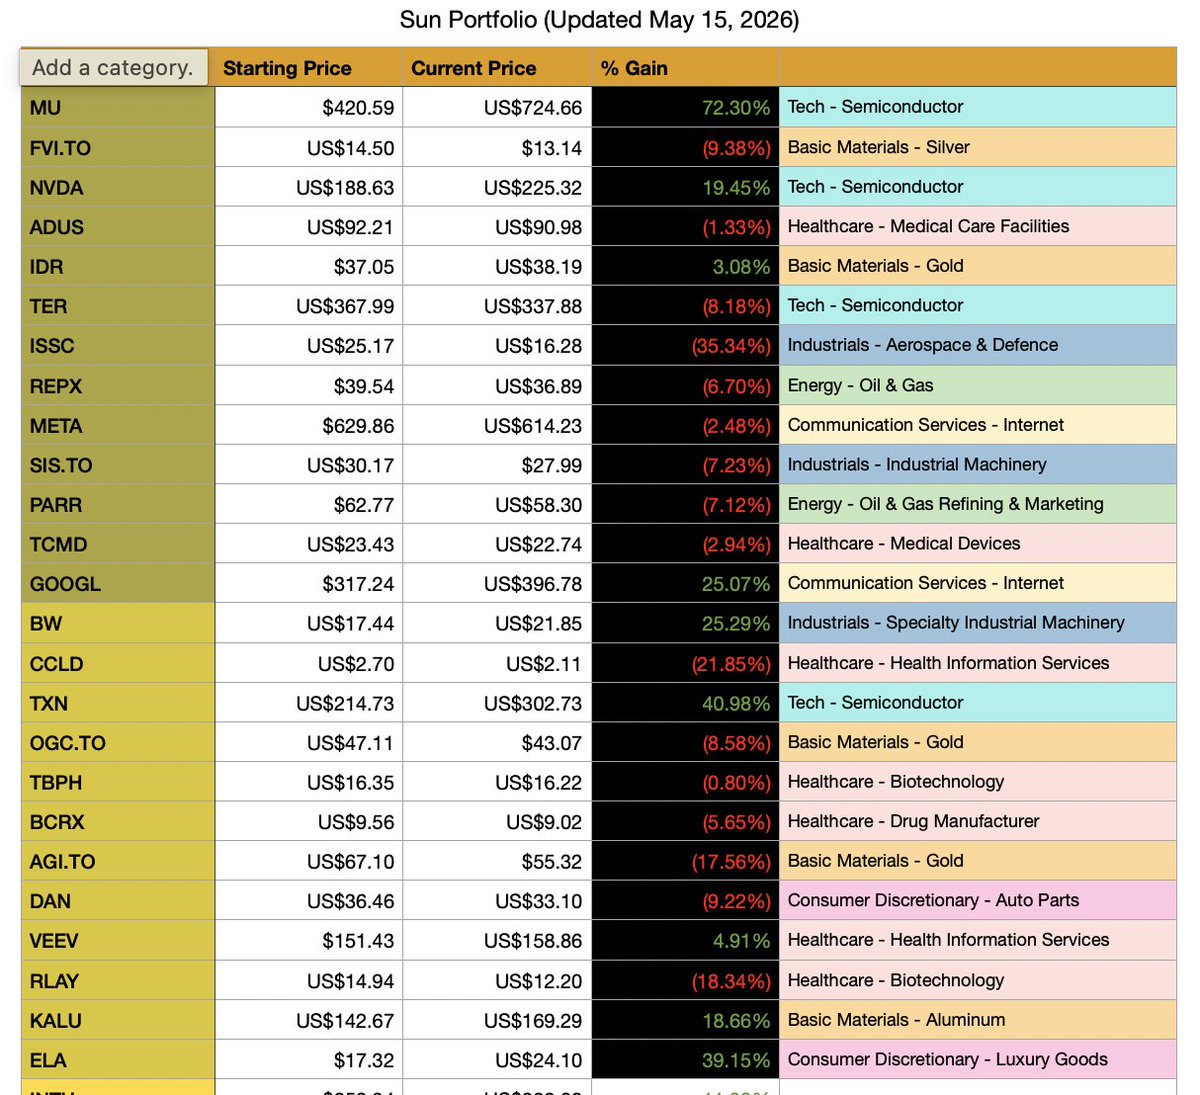
Sun Portfolio Update ☀️ (May 15, 2026)
Fresh picks are now live for the next 30-day cycle.
Markets extended their rally this period, driven primarily by strength in large-cap U.S. equities and continued momentum in semiconductors, industrials, and AI-linked infrastructure plays. Breadth improved overall, though leadership remained concentrated in select areas of the market.
Despite strong absolute gains across equities, the Sun models lagged the major benchmarks this cycle as index-heavy mega caps outperformed many of the smaller and mid-cap momentum names held within the portfolios.
Performance (Apr 10 → May 15):
☀️ Sun 1: 3.01%
☀️ Sun Portfolio: 3.45%
vs.
S&P 500: 8.79%
Russell 2000: 6.24%
TSX 60: 0.69%
Track Record (Since Dec 2022):
☀️ Sun 1: $10,000 → $35,887
☀️ Sun Portfolio: $10,000 → $27,050
Built across multiple market environments — inflation shocks, aggressive rate hikes, regional banking stress, and shifting factor leadership — using a fully systematic process.
How the Sun portfolios are built:
☀️ Sun Portfolio (25 stocks)
Top 25 stocks ranked by weighted average score across ~100 quantitative strategies.
☀️ Sun 1 (13 stocks)
A concentrated subset containing the top 13 ranked names.
Each stock is evaluated across a large library of proven strategies. Higher weight is assigned to the models currently producing the strongest performance.
Current Sun 1 Holdings:
$MU
$ISSC
$TILE
$BE
$ELMD
$SANM
$CLS.TO
$NVDA
$IDR
$DIOD
$SIS.TO
$STRL
$ONTO
Current Sun Portfolio (25):
Sun 1
$AUPH
$TER
$OGC.TO
$MCHP
$PPIH
$MTZ
$TCMD
$NUE
$ON
$AMD
$INFU
$TOT.TO
Changes This Period:
Sun 1 Buys:
TILE BE ELMD SANM CLS.TO DIOD STRL ONTO
Sun 1 Sells:
FVI.TO ADUS TER REPX META PARR TCMD GOOGL
Sun Portfolio Buys:
TILE BE ELMD SANM CLS.TO DIOD STRL ONTO
AUPH MCHP PPIH MTZ NUE ON AMD INFU TOT.TO
Sun Portfolio Sells:
FVI.TO ADUS REPX META PARR GOOGL
BW CCLD TXN TBPH BCRX AGI.TO DAN VEEV RLAY KALU ELA
Positioning continues to favor cyclical growth, semiconductors, industrial momentum, and selective resource exposure heading into the next rebalance period.
Full breakdowns and charts in the visuals below.
#QuantInvesting #FactorMomentum #PortfolioUpdate
40
1/3
📊 RESULTS: Apr 10 – May 15, 2026
Markets moved sharply higher this period as equities continued to rally on easing macro concerns, resilient economic data, and improving investor sentiment. Large-cap U.S. equities led the advance, with broad market participation strengthening throughout the month.
This environment proved more favorable for major US index exposure than for the concentrated factor models, though all four portfolios still finished positive on the period.
🌊 Water 1: 4.33%
🌊 Water Portfolio: 3.13%
☀️ Sun 1: 3.01%
☀️ Sun Portfolio: 3.45%
vs. Benchmarks:
#SP500: 8.79%
#Russell2000: 6.24%
#TSX60: 0.69%
More details below. Monthly portfolio updates for both the Sun and Water models will be shared later this weekend.
#QuantInvesting #FactorMomentum #PortfolioUpdate
1
1
32
2/3
📊Detailed ~30 day performance data for the most recent trailing twelve ~30 day periods
1
14
3/3
Detailed stock performance for both Water & Sun portfolios.
*Note that the darker shaded cells in both tables denote the Water 1 & Sun 1 portfolios, while the entire table represents the Water & Sun portfolios.
16
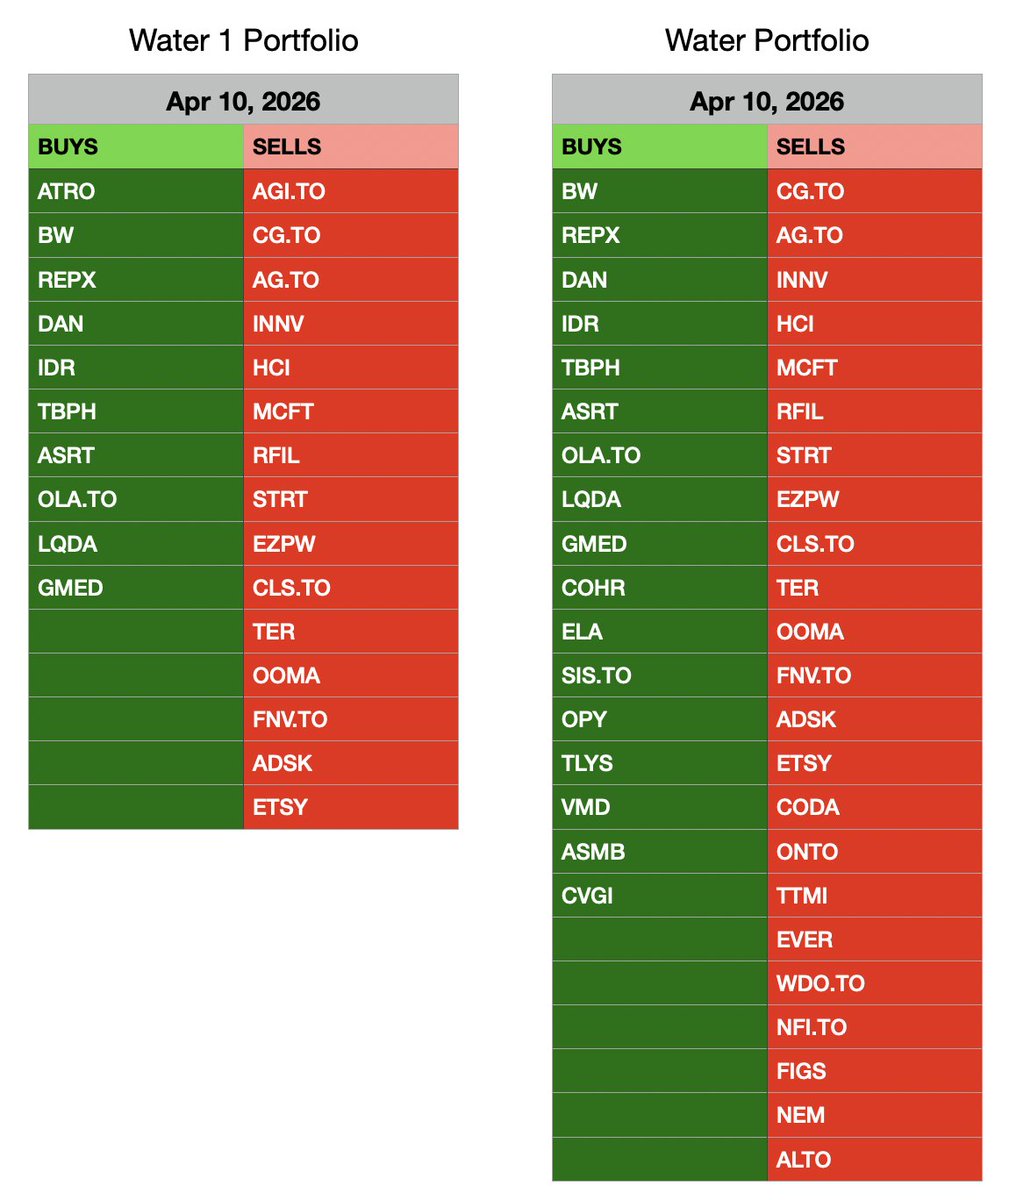
Water Portfolio Update 🌊 (Apr 10, 2026)
Fresh picks are live for the next 30-day cycle.
Markets rebounded strongly this period, with high-beta and momentum names leading the move. Small caps outperformed large caps, and leadership broadened beyond mega-cap defensiveness.
At the same time, software and cybersecurity continued to lag, as capital rotated toward AI-adjacent winners and more speculative areas of the market.
Performance (Mar 13 → Apr 10):
🌊 Water 1: 8.76%
🌊 Water Portfolio: 7.69%
vs.
S&P 500: 2.59%
Russell 2000: 5.97%
TSX 60: 3.73%
Strong performance across both portfolios, benefiting from exposure to momentum and higher-beta names.
Track Record (Since Dec 2022):
🌊 Water 1: $10,000 → $40,938
🌊 Water Portfolio: $10,000 → $27,674
A more selective, high-conviction approach that has delivered strong results across changing market conditions.
How the Water portfolios are built:
Water uses only the top-performing strategies from a ~100 model universe.
Unlike Sun, there is no averaging:
• Stocks either pass or fail each strategy
• Each pass earns a score
• Scores are added together
🌊 Water 1 → Highest-scoring stocks (strict threshold)
🌊 Water Portfolio → All stocks above the core threshold
Because of this structure, portfolio size varies each month depending on how many stocks qualify.
Current Water 1 Holdings:
$MU $FVI.TO $ISSC $BW $RLAY $REPX $DAN $TCMD $PARR $IDR $CCLD $TBPH $IMG.TO $ATRO $CIEN $ASRT $OLA.TO $CDE $KALU $LQDA $AUGO $GMED $STRL
Current Water Portfolio:
Water 1
$TASK $ADUS $COHR $BCRX $ELA $AGI.TO $SIS.TO $STN.TO $WGX.TO $OPY $ITRN $APM.TO $TLYS $VMD $ASMB $VSCO $CVGI $CRDO $HBM.TO
Changes This Period:
Water 1 Buys:
ATRO BW REPX DAN IDR TBPH ASRT OLA.TO LQDA GMED
Water 1 Sells:
AGI.TO CG.TO AG.TO INNV HCI MCFT RFIL STRT EZPW CLS.TO
TER OOMA FNV.TO ADSK ETSY
Water Portfolio Buys:
BW REPX DAN IDR TBPH ASRT OLA.TO LQDA GMED
COHR ELA SIS.TO OPY TLYS VMD ASMB CVGI
Water Portfolio Sells:
CG.TO AG.TO INNV HCI MCFT RFIL STRT EZPW CLS.TO
TER OOMA FNV.TO ADSK ETSY CODA ONTO TTMI
EVER WDO.TO NFI.TO FIGS NEM ALTO
Positioning continues to emphasize high-scoring momentum names, with broad participation across sectors.
Full breakdowns in the visuals below.
53
Sun Portfolio Update ☀️ (Apr 10, 2026)
Fresh picks are live for the next 30-day cycle.
Markets saw a strong rebound this period, with high-beta and momentum names leading. Small caps continued their resurgence vs large caps, while leadership broadened beyond mega-cap tech.
At the same time, software and cybersecurity remained under pressure, continuing their relative underperformance as capital rotated toward AI-adjacent winners and more speculative momentum trades.
Performance (Mar 13 → Apr 10):
☀️ Sun 1: 9.40%
☀️ Sun Portfolio: 3.96%
vs.
S&P 500: 2.59%
Russell 2000: 5.97%
TSX 60: 3.73%
Strong outperformance from Sun 1 this cycle.
Track Record (Since Dec 2022):
☀️ Sun 1: $10,000 → $34,837
☀️ Sun Portfolio: $10,000 → $26,148
Built across multiple market regimes — rate hikes, inflation shocks, and shifting leadership — using a fully systematic approach.
How the Sun portfolios are built:
☀️ Sun Portfolio (25 stocks)
Top 25 stocks ranked by weighted average score across ~100 quantitative strategies.
☀️ Sun 1 (13 stocks)
A concentrated subset of the top 13 ranked names.
Each stock is scored across a large library of proven strategies. Only the best-performing models are used, with higher weight given to those currently outperforming.
Current Sun 1 Holdings:
$MU $FVI.TO $NVDA $ADUS $IDR $TER $ISSC $REPX $META $SIS.TO $PARR $TCMD $GOOGL
Current Sun Portfolio (25):
Sun 1
$BW $CCLD $TXN $OGC.TO $TBPH $BCRX $AGI.TO $DAN $VEEV $RLAY $KALU $ELA
Changes This Period:
Sun 1 Buys:
ADUS TCMD OGC.TO IDR REPX META
Sun 1 Sells:
CG.TO IMG.TO AG.TO ONTO WDO.TO CIEN
Sun Portfolio Buys:
IDR REPX META SIS.TO PARR GOOGL
BW TXN TBPH BCRX DAN VEEV RLAY KALU ELA
Sun Portfolio Sells:
CG.TO IMG.TO AG.TO ONTO WDO.TO CIEN
STRL FNV.TO ADSK INNV CDE OOMA AEM.TO INFU HCI
Positioning continues to lean into momentum and high-beta exposure with a few mega caps in the fold.
Full breakdowns and charts in the visuals below.

67
1/3
📊 RESULTS: Mar 13 – Apr 10, 2026
Markets rebounded strongly this period, with sentiment improving following developments around a potential Iran ceasefire. Risk appetite returned and momentum factors reasserted themselves across equities with high beta names vastly outperforming.
Amid this backdrop, both core strategies delivered exceptional performance.
🌊 Water 1: 8.76%
🌊 Water Portfolio: 7.69%
☀️ Sun 1: 9.40%
☀️ Sun Portfolio: 3.96%
vs. Benchmarks:
#SP500: 2.59%
#Russell2000: 5.97%
#TSX60: 3.73%
More details below. Monthly portfolio updates will be shared later today. Follow for all quant strategy updates and see how these models continue to outperform the market with just one rebalance per month.
#QuantInvesting #FactorMomentum #PortfolioUpdate
1
43
2/3
📊Detailed ~30 day performance data for the most recent trailing twelve ~30 day periods
1
15
3/3
Detailed stock performance for both Water & Sun portfolios.
*Note that the darker shaded cells in both tables denote the Water 1 & Sun 1 portfolios, while the entire table represents the Water & Sun portfolios.
13
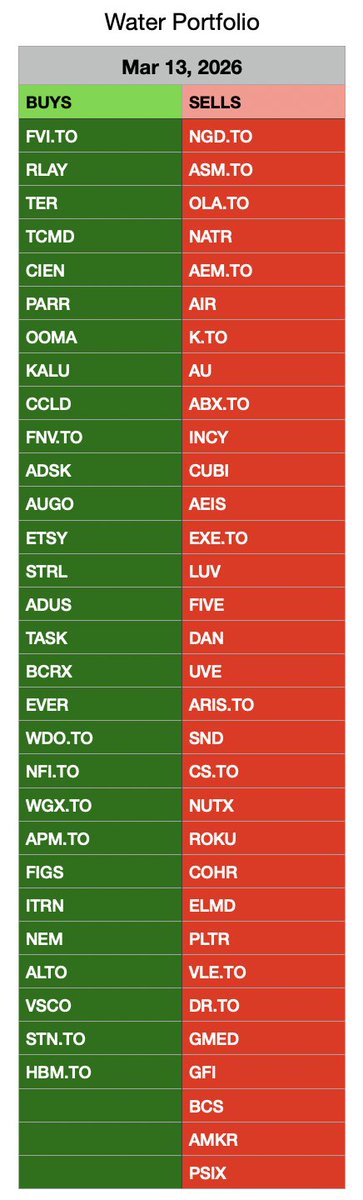
Water Portfolio Update 🌊 (Mar 13, 2026)
Fresh picks are live for the next 30-day cycle.
Markets faced a difficult environment this period following a sudden escalation in global conflict, which drove a spike in oil prices and increased volatility across equities.
Performance (Feb 13 → Mar 13):
🌊 Water 1: −4.76%
🌊 Water Portfolio: −5.61%
vs.
S&P 500: −2.85%
Russell 2000: −6.23%
TSX 60: −1.71%
How the Water portfolios are built:
Water uses only the very best-performing strategies from my ~100 model universe.
Instead of averaging scores like the Sun portfolio, stocks either pass or fail each strategy.
When a stock passes a strategy it earns a score, and these scores are added together.
Stocks that clear a benchmark threshold are included in the portfolios.
Water 1 → Highest-scoring stocks clearing the upper benchmark.
Water Portfolio → All stocks that pass the core benchmark.
Because stocks simply accumulate passing scores, the number of holdings changes each month depending on how many qualify.
Current Water Portfolio holdings:
$MU, $CG.TO, $IMG.TO, $AG.TO, $ISSC, $CDE, $INNV, $HCI, $MCFT, $RFIL, $AGI.TO, $STRT, $EZPW, $CLS.TO, $FVI.TO, $RLAY, $TER, $TCMD, $CIEN, $PARR, $OOMA, $KALU, $CCLD, $FNV.TO, $ADSK, $AUGO, $ETSY, $STRL,
$CODA, $ONTO, $CRDO, $ATRO, $TTMI, $ADUS, $TASK, $BCRX, $EVER, $WDO.TO, $NFI.TO, $WGX.TO, $APM.TO, $FIGS, $ITRN, $NEM, $ALTO, $VSCO, $STN.TO, $HBM.TO
Current portfolio picks plus Buys & Sells for this period are shown in the images below
47
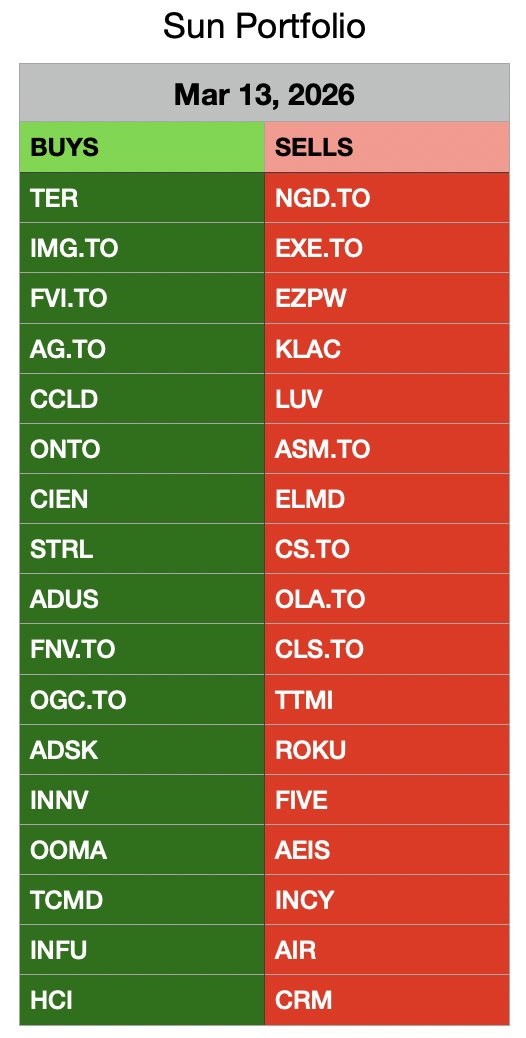
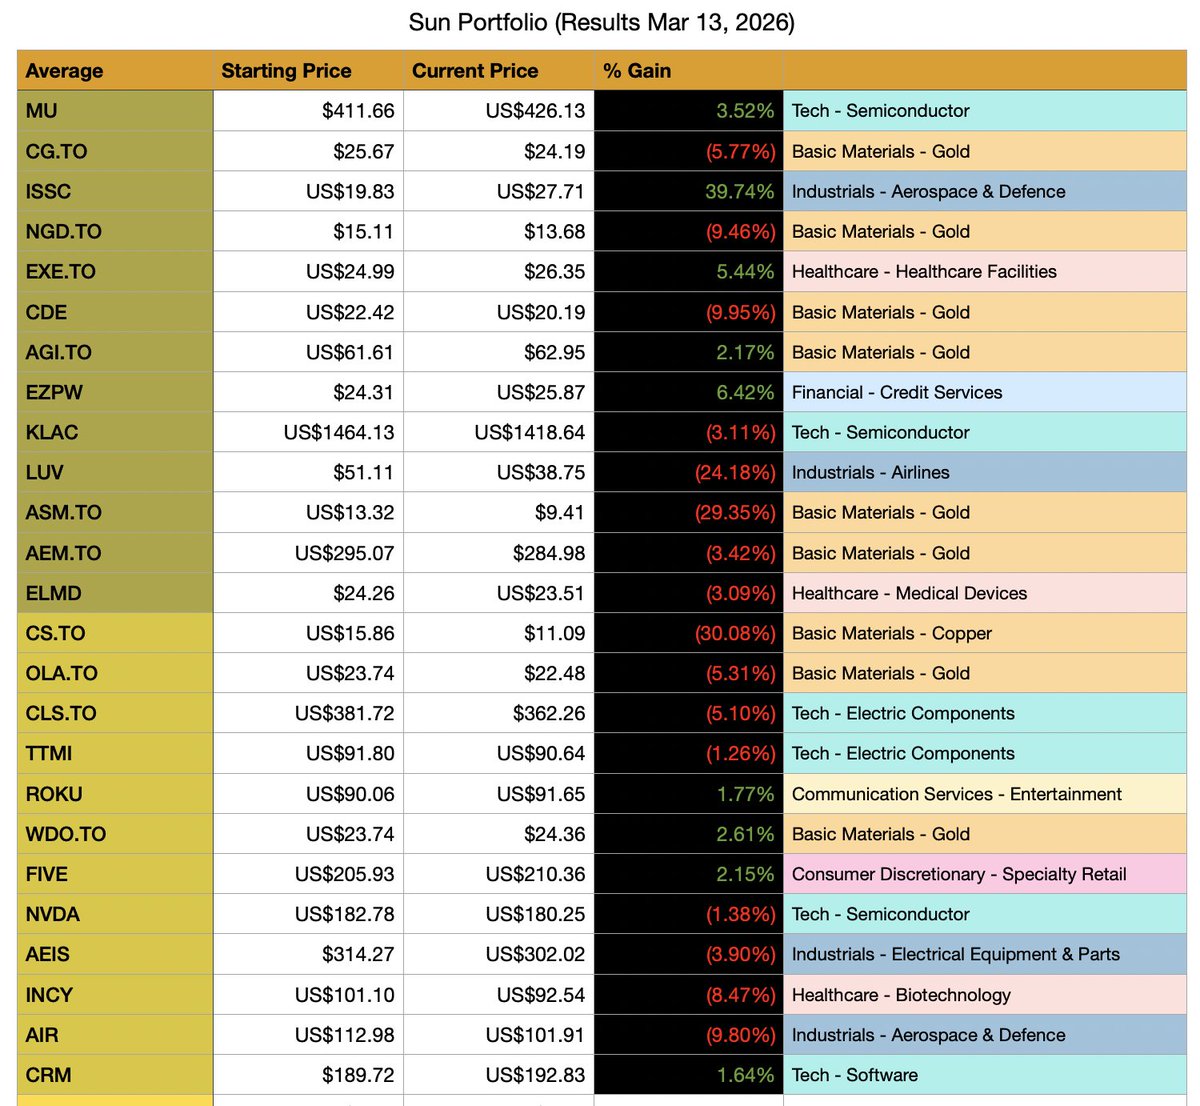
Sun Portfolio Update ☀️ (Mar 13, 2026)
Fresh picks are live for the next 30-day cycle!
Markets faced a difficult environment this period following a sudden escalation in global conflict, which drove a spike in oil prices and increased volatility across equities.
Performance (Feb 13 → Mar 13):
☀️ Sun 1: −2.39%
☀️ Sun Portfolio: −3.53%
vs.
S&P 500: −2.85%
Russell 2000: −6.23%
TSX 60: −1.71%
How the Sun portfolios are built:
☀️ Sun Portfolio → Top 25 stocks ranked by weighted average score across the best-performing quant strategies.
☀️ Sun 1 → A concentrated subset containing the top 13 ranked stocks from the Sun Portfolio.
Each stock is scored across a large library of proven quantitative strategies. Only the models showing the strongest recent performance are used, and the best-performing ones receive higher weight in the scoring process.
Current Sun Portfolio holdings:
$MU, $CG.TO, $TER, $IMG.TO, $FVI.TO, $AG.TO, $CCLD, $NVDA, $AGI.TO, $ONTO, $ISSC, $WDO.TO, $CIEN, $STRL, $ADUS, $FNV.TO, $OGC.TO, $ADSK, $INNV, $CDE, $OOMA, $TCMD, $AEM.TO, $INFU, $HCI
Current portfolio picks plus Buys & Sells for this period are shown in the images below.

44
1/3
📊 RESULTS: Feb 13 – Mar 13, 2026
This period was marked by a sudden escalation in global conflict, sending shockwaves through markets. Oil prices surged and risk sentiment deteriorated rapidly as investors reacted to the geopolitical uncertainty.
First and foremost, our thoughts are with everyone affected by the conflict. Events like this are a sobering reminder that real-world consequences matter far more than portfolio returns.
Against that difficult backdrop, equity markets broadly sold off — with small caps hit particularly hard.
🌊 Water 1: −4.76%
🌊 Water Portfolio: −5.61%
☀️ Sun 1: −2.39%
☀️ Sun Portfolio: −3.53%
vs. Benchmarks:
#SP500: −2.85%
#Russell2000: −6.23%
#TSX60: −1.71%
More details and portfolio updates to follow 👇
#QuantInvesting #FactorMomentum #PortfolioUpdate
1
35
2/3
📊Detailed ~30 day performance data for the most recent trailing twelve ~30 day periods
1
23
Detailed stock performance for both Water & Sun portfolios.
*Note that the darker shaded cells in both tables denote the Water 1 & Sun 1 portfolios, while the entire table represents the Water & Sun portfolios.
1
25