
Passionate about blending Technical and Fundamental analysis in stock markets. Navigating through market chaos with my own charts.📈🔍Opinions are solely mine!
Joined February 2013
- Tweets 1,318
- Following 319
- Followers 2,765
- Likes 256
550 Photos and videos


Pinned Tweet

The bond market already told you why it didn't believe the SBP cuts. This chart explains it.
April 2026 oil import bill: $1.93bn — nearly double March, highest single-month since the 2022 war spike.
CAD pressure returns. PKR risk back on the table. SBP rate-cut path effectively capped.
Equity rotation: OMCs & refineries lead. Industrials, autos & power consumers take the hit.
9
674
THCCL
Last Close: PKR 59.74 | 52w: 46.03 – 103.50
THCCL crashed from ~103 to 46 (–55%), and is now in a recovery phase. Price is above both EMA20 (54.63) and EMA50 (56.01) — the first bullish EMA signal seen in months. However it remains well below EMA200 (69.04), meaning the bigger trend is still bearish.
Price broke above two Bearish OBs (55.80–57) — bullish sign. Two Bullish OBs at 52–54 now act as a solid floor. MACD just crossed positive (histogram green, 0.66). RSI at 67 — approaching overbought but not there yet.
🟡 CAUTIOUS BUY / HOLD
The bounce is real and technically valid. Entry zone: 56–58 pullback (retest of broken Bear OB = now support). Stop: 51.50 (below Bull OBs). Target 1: 62 | Target 2: 72.80. Don't chase the current candle — wait for a dip to 56–58 for better risk/reward. A close above 62 with volume would confirm the next leg up.
#psx #kse100
#THCCL
12
883
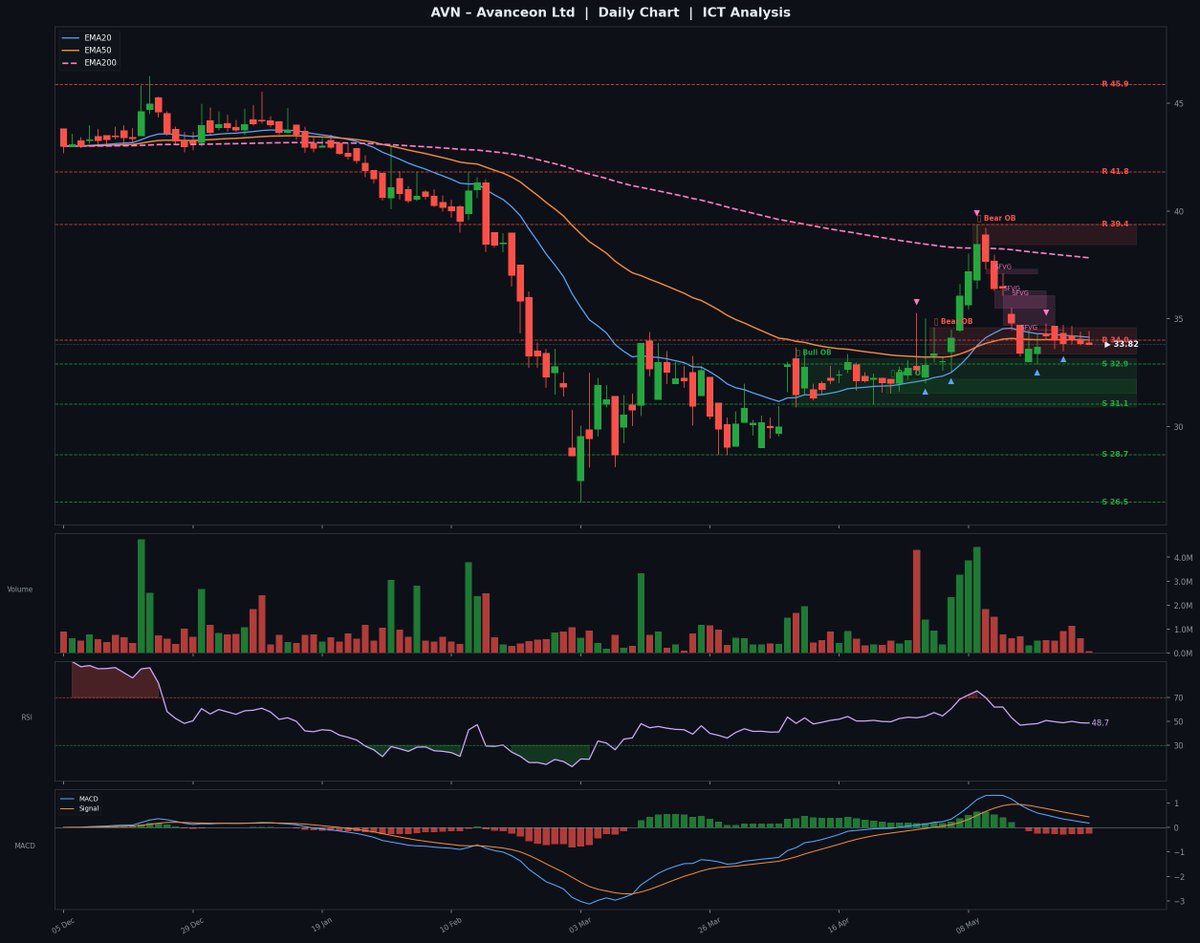
AVN — Avanceon |
Last Close: PKR 33.82 | 52w: 26.50 – 54.30
Price crashed 52% from the year high and the bounce to 39 has already failed. Currently sitting inside a Bearish Order Block (33.38–34.59) — a supply zone where institutions sell. Full bear EMA stack (price below EMA20/50/200), MACD just crossed bearish, RSI at 48.7 with room to fall further.
LevelType38.45 – 39.38Strong Resistance (Bear OB)34.01 – 34.59Immediate Resistance32.90 / 31.05First / Second Support26.5052w Low
🔴 SELL / AVOID
Stop if holding: 35.00. Only consider buying at 26.50 sweep reversal or a strong close above 36 with volume. Neither is happening now.
2
332
📊 NML — Senior Technical Analysis Report
Last Close: PKR 142.39 | 52w Range: 120.00 – 208.40
🏗️ Market Structure (ICT)
NML is in a confirmed downtrend from its 52-week high of 208.40. The stock has carved out a clear series of Lower Highs Lower Lows from the Feb–Mar peak. It recently made a structural low near 120 (April) and has been attempting a recovery — but that recovery has stalled and is now rolling over again, signaling weakness.
BOS (Break of Structure) confirmed bearish at ~180 when price broke below the prior consolidation range
CHoCH attempted near 145–153 zone but failed to hold — price is back below EMA20 and EMA50
📦 ICT Order Blocks
TypeZoneStatus🟢 Bullish OB141 – 143.90 (22 May)Price sitting right on it — critical test🟢 Bullish OB148.50 – 156 (20 Apr)Now acting as overhead resistance🔴 Bearish OB157 – 163 (21–24 Apr)Strong supply zone, will cap any rally
The current price (142.39) is sitting directly on the recent Bullish OB (141–144). This is a key decision zone.
💧 Fair Value Gaps (FVGs)
Bearish FVGs exist in the 148–157 region left over from the April breakdown. These unmitigated gaps act as magnet zones for a short-term bounce attempt — but also as ceiling for any rally unless strong volume pushes through.
📈 Indicators
IndicatorValueReadingEMA20144.65Price BELOW — bearishEMA50147.93Price BELOW — bearishEMA200155.82Price well BELOW — bearish trendRSI46.7Neutral — not oversold yetMACD-1.42 vs Signal -1.21Bearish, histogram still redATR144.72Moderate volatility
The EMA stack is fully bearish (price < EMA20 < EMA50 < EMA200). RSI at 46.7 means there's room to fall further before reaching oversold — not a bounce signal yet.
🎯 Support & Resistance Levels
LevelType162–163Strong Resistance (Bearish OB old S/R)156–157Resistance (FVG prior S/R)145–148Immediate Resistance (EMA20 50, Bullish OB)141–143Current Support (Bullish OB) ← price is here135–136Key Support (prior consolidation low)129–130Strong Support12052w Low / Last resort support
⚖️ Verdict
🔴 SELL / AVOID — Do NOT Buy here
Reasoning:
Price is in a confirmed bearish trend — below all major EMAs
MACD still negative, no crossover
RSI at 46 means it's not oversold — plenty of downside room
The stock has lost ~32% from its high (208 → 142) and the recovery has failed
The Bullish OB at 141–144 might cause a short bounce to 148–153, but is unlikely to reverse the larger trend
Next major support is 135, then 129, then 120 — these are realistic targets if 141 breaks
If you already hold: Consider a STOP at 139 (below the Bullish OB). A break below 140 confirms the OB is invalidated and next stop is 135–129.
If you want to buy: Wait for price to either (a) reach 120–129 and show a clear bullish CHoCH with volume, OR (b) reclaim 148 with strong volume and close above EMA50
#NML #PSX
19
1,617
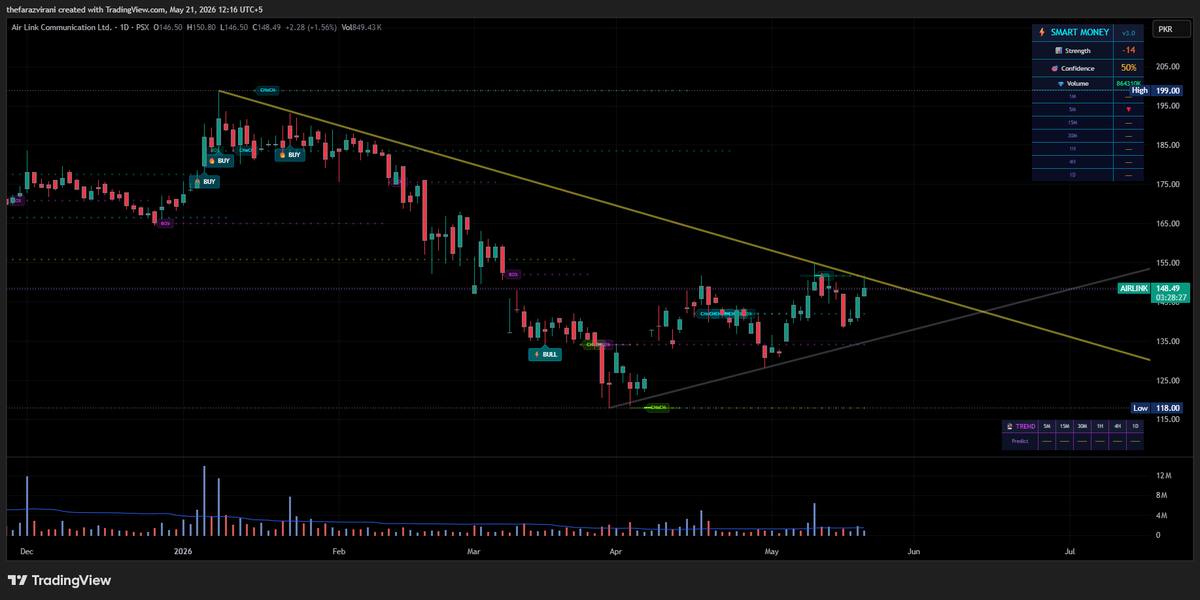
#AIRLINK | The triangle is real — and so is the resistance.
The 199 → 118 range compressed into the apex. Today: tested 150.80.
The descending trendline from 199 is doing its job. Right level, wrong day.
Plan unchanged: daily close > 152 = trigger, < 140 = invalidation. No break, no trade.
Best traders don't predict. They wait for permission.
1
16
1,183
A country that doesn't invest can't compound. A household that doesn't invest can't escape.
Pakistan: ~270K active PSX investors. India: 150M retail demat accounts.
Pakistan: 270K investors / 240M population = 1 in 900 people
India: 150M demat accounts / 1.4B population = 1 in 9 people
India's per-capita penetration is still 100x ours.
The gap isn't capital. It isn't intelligence. It's literacy.
And literacy is the single highest-ROI investment we still don't make.
#PSX
7
8
59
5,700
The IMF wants Petroleum Levy at Rs100/litre by FY27 — up from under Rs10 a decade ago.
That's not a tax policy. It's a structural inflation regime baked into every transaction. SBP can't cut its way out of arithmetic like that.
Equity tape priced it months ago: → Autos & discretionary capped despite rate cuts → Cement under pressure as transport costs compound → Solar & electrical names leading as the math forces switching
Charts knew. The IMF just made it official.

Pakistan’s fiscal dependence on petroleum consumers is no longer cyclical. It is becoming structural.
The latest IMF country report lays bare the scale of that dependence. By FY27, cumulative revenues from Petroleum Levy (PL), and the newly introduced carbon levy (CL) are projected to touch nearly Rs1.8 trillion, more than six times the level seen just five years ago. Excluding customs duties and import-stage taxes, petroleum products are quietly turning into one of the federal government’s most reliable revenue engines.
The shift has been dramatic. A decade ago, the petroleum levy averaged less than Rs10/litre on motor gasoline and high-speed diesel (HSD). Today, the IMF framework effectively envisages PL averaging close to Rs100/litre by FY27. Add the carbon levy, expected to rise to Rs5/litre from the current Rs2.5/litre, and the tax burden embedded in fuel prices becomes difficult to ignore.
7
1,075
A week where the yield curve steepened, the oil bill nearly doubled, and the Test team got swept 2-0 in Bangladesh.
Pakistan losing on every chart this week.
Hopefully next week the structure improves — in something.
x.com/i/trending/20567211091…

3
281
The PSX has been pricing this for two years:
→ IPP stocks trade below book as capacity payments aren't trusted
→ Industrials priced on captive power as grid demand has left
→ Solar & electrical names lead as that's where cash flow migrated
Power policy is the lagging indicator. The tape is the leading one.
May 20

This is a serious failure of power policy. Both in terms of capacity set up but especially in terms of current pricing policy. We need two-part tariffs and much lower electricity charges, closer to both the variable cost and the cost of solar power consumers can produce themselves.
3
532
The 12M cut-off jumped 110bps in one auction. That's not a cut cycle as that's the market telling SBP it doesn't believe one.
The equity tape reads it too: → Banks bid as they earn the higher spread → Cement & infra capped as dev spending is the first cut → Dividend payers & exporters lead as cash flow > duration
The market isn't laughing. It's repricing.
May 20

When your borrowing rate runs 210 bps above your policy rate and debt servicing already eats 60% of revenues, you are in a fiscal trap.
The SBP cuts. The government borrows above it. The market laughs at both.
4
523
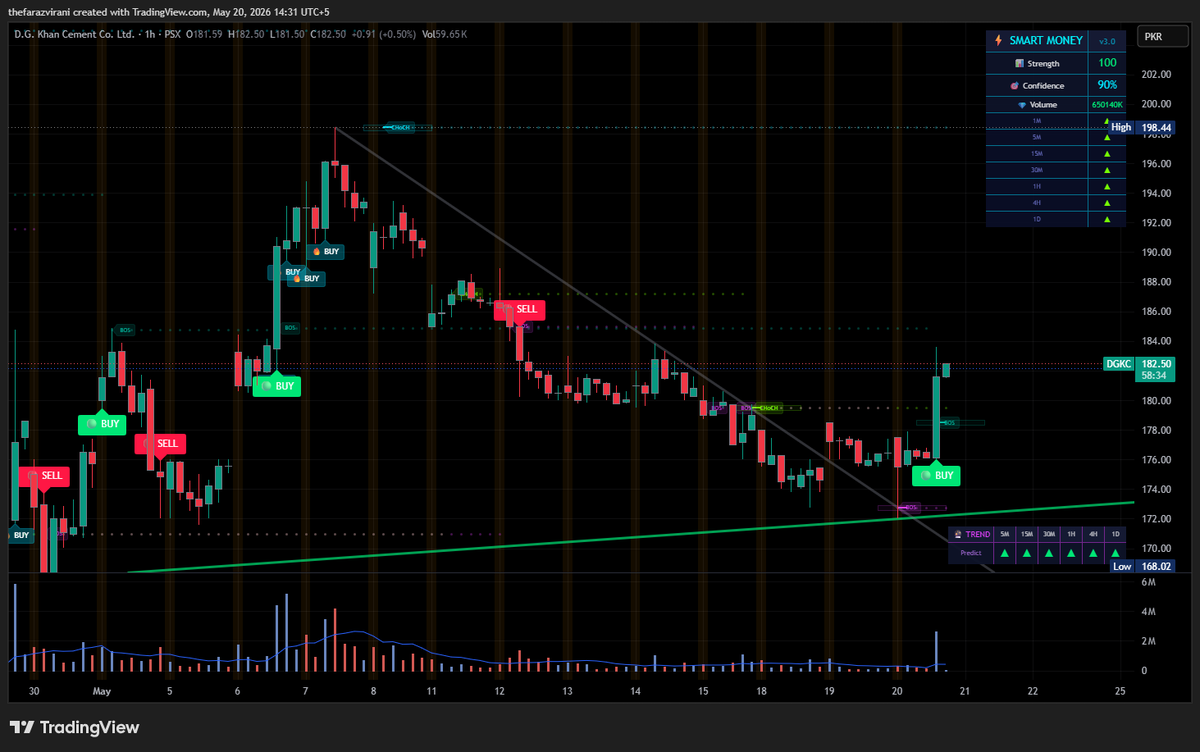
DGKC | 1H — Reversal Confirmed
After 9 sessions of grinding sells from the May 7 high (198.44), structure has finally turned on the 1-hour chart. First session where the bears have lost control of the tape.
What changed today:
✓ Descending trendline from 198.44 broken cleanly ✓ Bullish CHoCH printed ✓ BOS above the 178 prior swing ✓ Breakout candle is the heaviest 1H volume bar of the last two weeks (~2M vs. 200–400K avg) ✓ Higher low established at 173 — swing-low sequence has flipped up
Multi-TF read:
1H: bullish — fresh trigger today
4H: bullish bias, awaiting close confirmation
1D: still inside the broader 140–198 base; daily close > 188 needed to graduate the signal
Levels:
Resistance — 188 (first reaction high) / 194.07 (upper CB — expect friction) / 198.44 (major swing; daily close above = trend reversal confirmed on the higher TF)
Support — 178–180 (breakout zone / retest target) / 173 (higher low — hard invalidation) / 168 → 160–150 if structure fails
Plan:
→ Preferred entry: 178–180 retest, SL < 173. R:R ~1:3 into T2. → Aggressive entry: at market ~182.50, SL < 173, smaller size. → Targets: 188 → 194 → 198. → Invalidation: 1H close below 173.
What earns conviction to hold past 188:
Two consecutive 1H closes above 188 on above-average volume, and/or a daily close > 188. Until then, treat the move as a counter-trend bounce inside a larger base.
Setup is clean. The longer-term tape from 275 → 140 was brutal, so size for survival and let the levels do the work. The upper circuit at 194.07 is real friction — don't chase into it.
Views personal · Not investment advice · DYOR
#PSX #DGKC #PakistanStocks #Cement #TechnicalAnalysis
3
287
Pakistan’s market leadership is becoming increasingly concentrated, and the latest report from JS Investments on the JS Momentum Factor ETF gives a strong indication of where institutional momentum is currently flowing.
The most important takeaway is that JSMFETF has effectively become a major play on Pakistan’s ongoing energy cycle. Nearly half of the portfolio is now allocated to Oil & Gas Exploration companies, with key holdings including Oil & Gas Development Company Limited, Pakistan Petroleum Limited, Mari Energies, and Attock Refinery Limited. Alongside this, the fund also maintains exposure to strong financial and tech names like Meezan Bank and Systems Limited.
What makes this interesting is that momentum investing is completely rules based. It does not follow emotions or headlines. It rotates toward stocks already showing relative strength and institutional accumulation. Right now, the model is clearly favoring energy and selective financials.
The long term performance has also been impressive. Since launch in 2022, the ETF has delivered cumulative returns of nearly 264%, despite Pakistan going through inflation shocks, currency devaluation, IMF pressure, and political instability.
At the same time, investors should understand the risk profile. Momentum strategies perform best in trending bull markets but can reverse sharply during corrections. Current positioning is also heavily concentrated in commodities, which increases sensitivity to the global oil cycle.
Big picture, this ETF reflects an important shift in PSX where capital continues moving toward sectors with dollar linked earnings, pricing power, and balance sheet resilience rather than speculative narratives.
#PSX #KSE100 #ETF #Investing #PakistanStockMarket
1
364
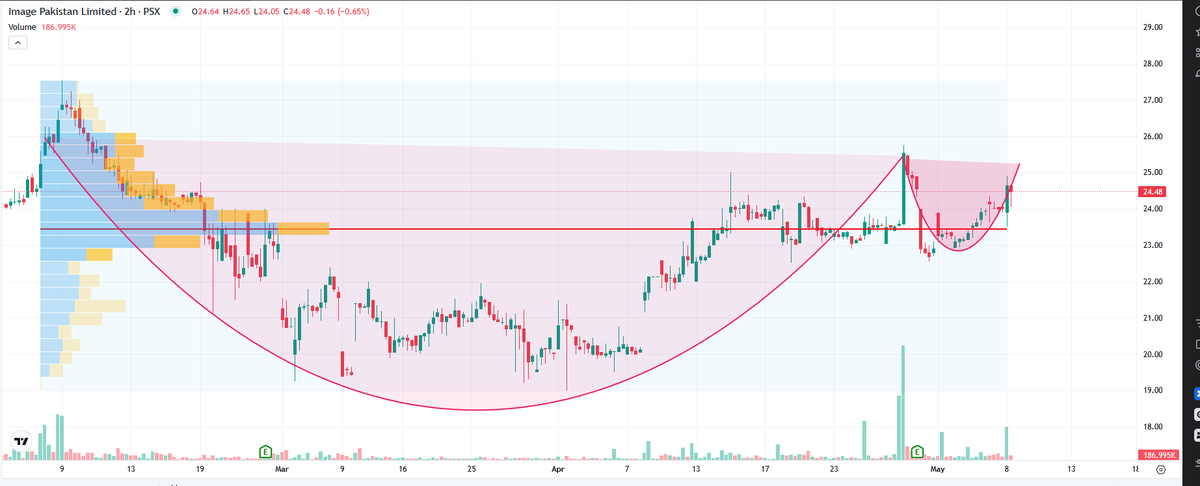
📊 IMAGE Pakistan Limited (IMAGE) — PSX 2H Chart
🔍 Pattern: Classic Cup & Handle forming since Feb 2026
☕ Cup base: ~19.00 | Handle zone: 23.00–25.00
📌 Key support: 24.00 — tested multiple times, holding firm
📈 Current price: 24.48
⚡ Volume spike in early May signals growing interest
👀 Watch for a clean breakout & close above 25.00 on strong volume
Handle is still forming — patience is key here.
Not financial advice. Do your own research. 🇵🇰
#PSX #PakistanStocks #IMAGE #TechnicalAnalysis #CupAndHandle #StockMarketwin
1
19
1,551
The key variable is not the size of the initial disruption but how long alternative supply mechanisms can compensate. Oil markets are increasingly resilient to shocks, but not to prolonged physical bottlenecks.... Damn!
☠️

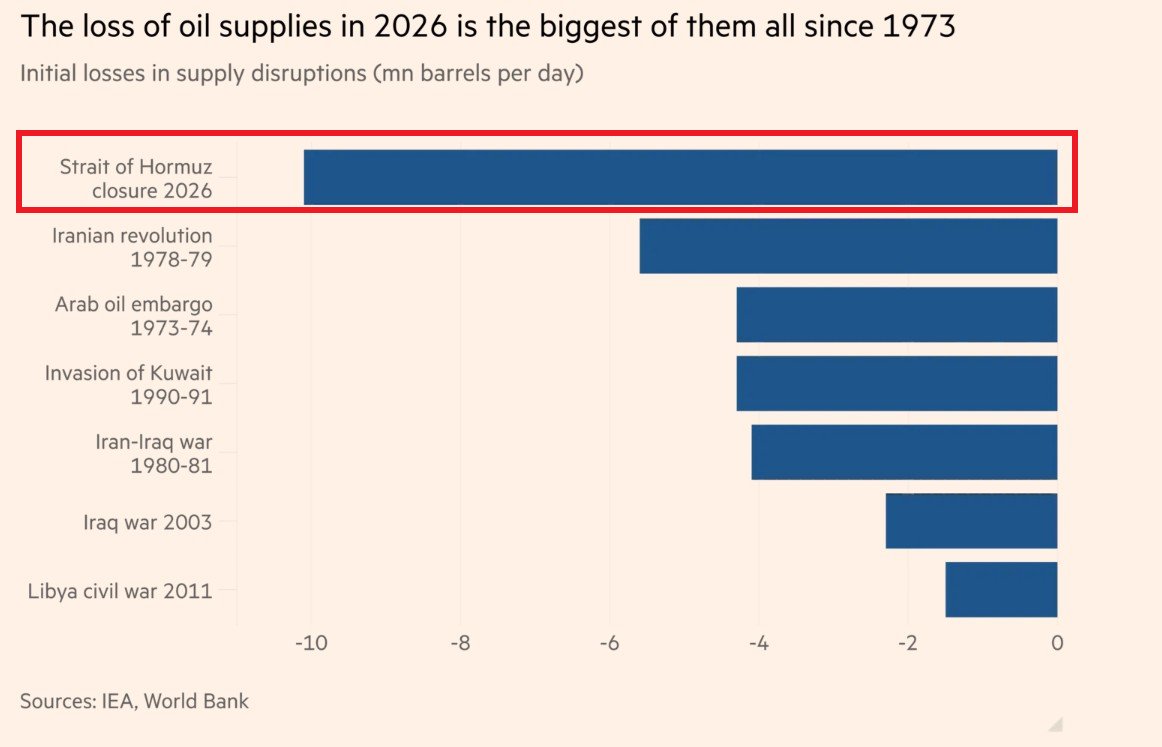
🔴The Strait of Hormuz closure is the biggest OIL SUPPLY SHOCK the world has ever seen:
The initial loss of oil supply from the closure reached ~10 million barrels per day.
This is larger than any disruption caused by the Iranian revolution, the Arab oil embargo, the invasion of Kuwait, or the Iran-Iraq war.
This comes as tanker traffic through the Strait collapsed from ~60 vessels per day to near zero, cutting off ~20 million barrels per day of gross supply from global markets.
Alternative sources, including OPEC spare capacity, pipelines, inventory releases, and sanctioned oil in transit, can cover most of the shortfall in the short term, leaving a potential supply gap of ~4.6 million barrels per day, or just over 4% of global consumption.
However, inventories cannot be drawn down indefinitely, and if the closure persists, the effective shortfall could rise toward 8% of global consumption.
The world cannot afford the Strait closure for too long.
362
At this point petrol prices don’t get announced they get revealed like plot twists in a drama series damn ... 💀
Apr 29

🚨 I Want To Tell The People Of 🇵🇰 Pakistan A Very Bad News:
The Government Is Going To Increase The Prices Of Petroleum Products By 24%.
- Muneeb Farooq.
257
The recurring theme in recent energy moves is policy inconsistency. Pricing, supply planning, and demand assumptions are not moving in sync, which creates inefficiencies that ultimately show up as cost and reliability pressure on consumers.
Apr 30

If you tally this govt’s energy blunders from just the past few months, the list is staggering:
• Premature fuel price hikes → Rs 87bn windfall to OMCs
• Faulty diesel pricing → windfall gains for refineries
• LNG cargoes cancelled… then panic-buying expensive spot cargoes
• Up to 12 hours of loadshedding in cities due to mismanagement
• New gas connections approved while even 10% of existing demand isn’t met
• Anti-solar policies introduced, then partially rolled back after backlash
• Claims of reduced circular debt—contradicted by their own data
And that’s not even the full picture.
This isn’t governance. It’s a pathetic circus the entire country is forced to endure.
267
This is less about daily payments and more about long term contractual design risk. If capacity commitments are misaligned with actual demand, the system naturally shifts into fixed cost burden regardless of usage, which becomes a fiscal drag over time.
Apr 30

$538,535 per day. Who will stop the meter?
Pakistan’s LNG system carries a fixed cost that does not sleep. Every single day, $538,535 leaves the system -- whether gas flows or not. Over a decade, that has crossed $1.6 billion. The payments go to terminal operators at Port Qasim, Karachi, for floating regasification units that convert imported LNG into pipeline gas.
Cold truth: This is not a fuel bill. This is a capacity bill.
Colder truth: The ships can sit idle. The cheques do not.
On March 4, Qatar invoked force majeure. LNG cargoes stopped -- Pakistan’s payments did not. At roughly $16 million a month, Pakistan continued to pay for terminals with nothing to regasify.
Imagine: Pakistan cannot feed the 44.7 per cent of its population that survives below the poverty line. Imagine: Pakistan cannot fully fund the defence equipment its armed forces need to protect the country’s borders. Imagine: Pakistan goes to the IMF with a begging bowl every few years, negotiating humiliating conditions just to keep the lights on.
Imagine: Every single day, without fail, Pakistan finds $538,535 to pay for ships that are not moving, vessels that are not working, and gas that is not flowing.
So, who will stop the meter? The present government says the contracts, as signed, carry no force majeure protection for Pakistan. Fact: Tools exist. They are simply not being used.
Ogra, the Oil and Gas Regulatory Authority, has the power to review and revise the tariff structure for both terminals. No gas flowing means no service rendered. A regulator worth its name would have opened that proceeding on March 5. Two operators. One port. Guaranteed dollar returns whether or not a single cubic foot of gas moves. Is that a market -- or a cartel dressed in contractual language? The Competition Commission of Pakistan (CCP) has the mandate to investigate exactly this kind of arrangement.
The question is why it hasn’t. Why has parliament become a spectator in this? The Public Accounts Committee has the authority to call for a fresh forensic audit of the original contract awards -- how they were structured, why force majeure relief was explicitly excluded for Pakistan but not for the operators, and whether the contracts were designed, from the outset, to ensure that all risk flowed in one direction.
Why has the Parliament become a spectator in this? Every day this question goes unanswered costs Pakistan $538,535. Someone decided to start this meter. Someone has the power to stop it. The people deserve to know who -- and why they haven’t.
267
Japan’s 10 year yield hitting the highest level since 1997 is basically a sign that long term borrowing costs are rising after decades of ultra cheap money.
It matters because Japan is one of the biggest global lenders, so when its yields rise, global markets quietly start adjusting expectations for interest rates, liquidity, and risk everywhere.
In simple terms, money is getting more expensive again in a place that kept it extremely cheap for a very long time.

BREAKING: 🇯🇵 Japan's 10-year government bond yield rises to 2.52%, the highest since 1997.
1
265