
Experienced and veteran stock trader who specializes in mentoring gold and commodity traders, focusing on technical analysis. Discord surl.li/rjoon
Joined August 2010
- Tweets 47,947
- Following 129
- Followers 15,951
- Likes 9,645
32,446 Photos and videos


Pinned Tweet

3 May 2025
𝑰𝒏𝒕𝒆𝒓𝒆𝒔𝒕𝒆𝒅 𝒊𝒏 𝒍𝒆𝒂𝒓𝒏𝒊𝒏𝒈 𝒕𝒆𝒄𝒉𝒏𝒊𝒄𝒂𝒍 𝒂𝒏𝒂𝒍𝒚𝒔𝒊𝒔?
Join our community for exclusive benefits:
- Daily technical analysis videos and strategic insights after market close.
- In-depth looks at commodities like #gold, #oil, #uranium, #silver, #copper and more.
- Insights into various entry and exit strategy concepts with alerts for some of my personal trades.
- Tips for crafting a trading plan. This includes structured chat room with trading plan concepts, patterns and candlestick setups.
- Request a chart analysis of your chosen stock, across any timeframe, and we’ll provide a directional perspective.
Only $5.97/month at goldeneyeanalysis.com
#GOLD #SILVER #COPPER #BITCOIN #CL #PALLADIUM #URANIUM #DXY #PLATINUM $GLD $XAUUSD $GC $GDX $DXY $URA $WTI $SLV $COPX $BTC $PAAS $AG $NEM $URNM $URNJ $FCX $PALL $NVDA $TSLA $AAPL #XAUUSD $DXY $SLV $GDXJ

15
2
32
58,523
40m
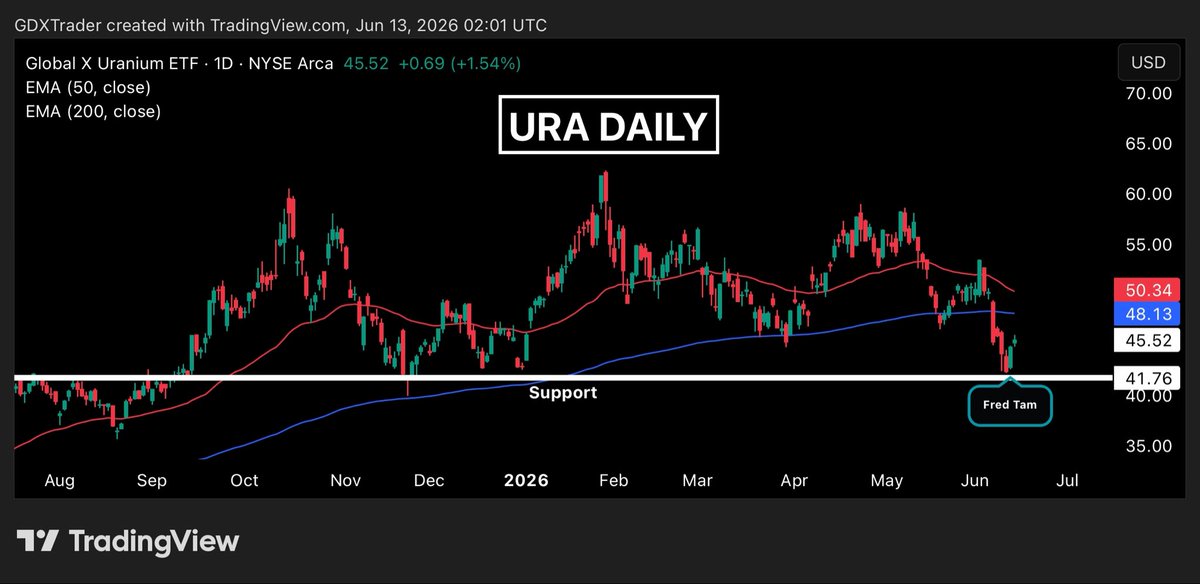
$URA
$URA printed a bullish Fred Tam candle at horizontal support on Thursday (shared in the post below), signaling buyers were stepping in.
Friday provided confirmation follow-through with a higher low, higher high, and higher close, although the spinning top candle shows momentum remains cautious.
The focus now is on measuring bounce strength as price could move to approach the moving averages, which might act as key resistance.
Bulls want to see strong continuation candles and expanding momentum to confirm a larger reversal.
For subscribers, continue using our momentum guide shared on Thursday in the chat room to manage the trade, trim into strength, and trail stops closely as price tests overhead resistance.
Many traders struggle without a clear trading plan, leading to inconsistency and unnecessary losses. Our services help you build a personalized plan tailored to your style, providing strategies to create rules, structure, and measurable results. We offer a centralized hub filled with concepts, strategies, and guidance, including my daily post-market videos with technical analysis of top commodities including #GOLD, #SILVER, #URANIUM, #BITCOIN and more.
Visit goldeneyeanalysis.com to get started.
$URA $URNM $URC $LEU $FUU $URC $UROY $CCJ $DNN $UUUU $URG $UEC $EFR $SRUUF $NXE $URNJ $GLATF $WUC $PDN #URANIUM $CCO $ASPI
Jun 12

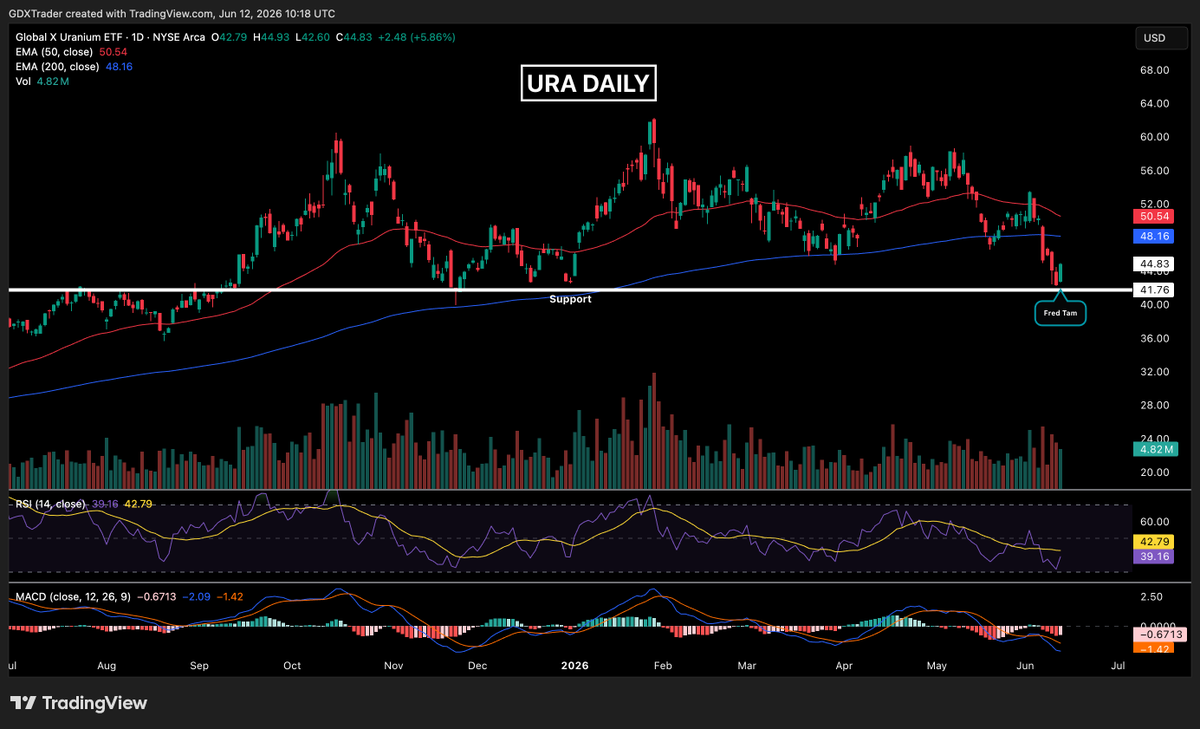
$URA
$URA printed a bullish Fred Tam candle at horizontal support yesterday, signaling that bearish momentum may be slowing after the recent pullback.
Buyers stepped in at a key demand zone, but bulls still need a confirmation candle to validate the pivot.
If a bounce develops, the focus should be on measuring its strength as price would approach the declining moving averages overhead.
Strong momentum and bullish follow-through would support the bounce attempt. We'll continue to monitor and review $URA daily in our post-market technical video recap for subscribers at GoldenEyeAnalysis.com.
$URA $URNM $URC $LEU $FUU $URC $UROY $CCJ $DNN $UUUU $URG $UEC $EFR $SRUUF $NXE $URNJ $GLATF $WUC $PDN #URANIUM $CCO

1
374
46m
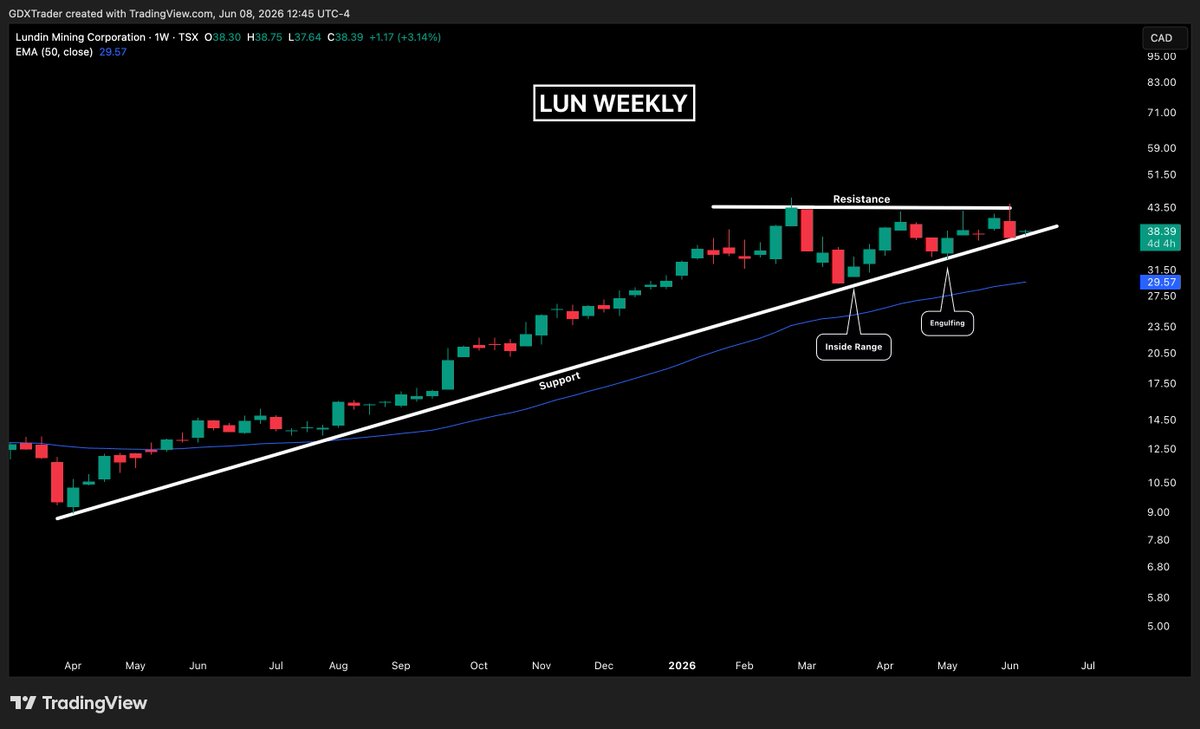
$LUN
$LUN continues to look constructive as bulls repeatedly defend ascending support within its ascending triangle pattern.
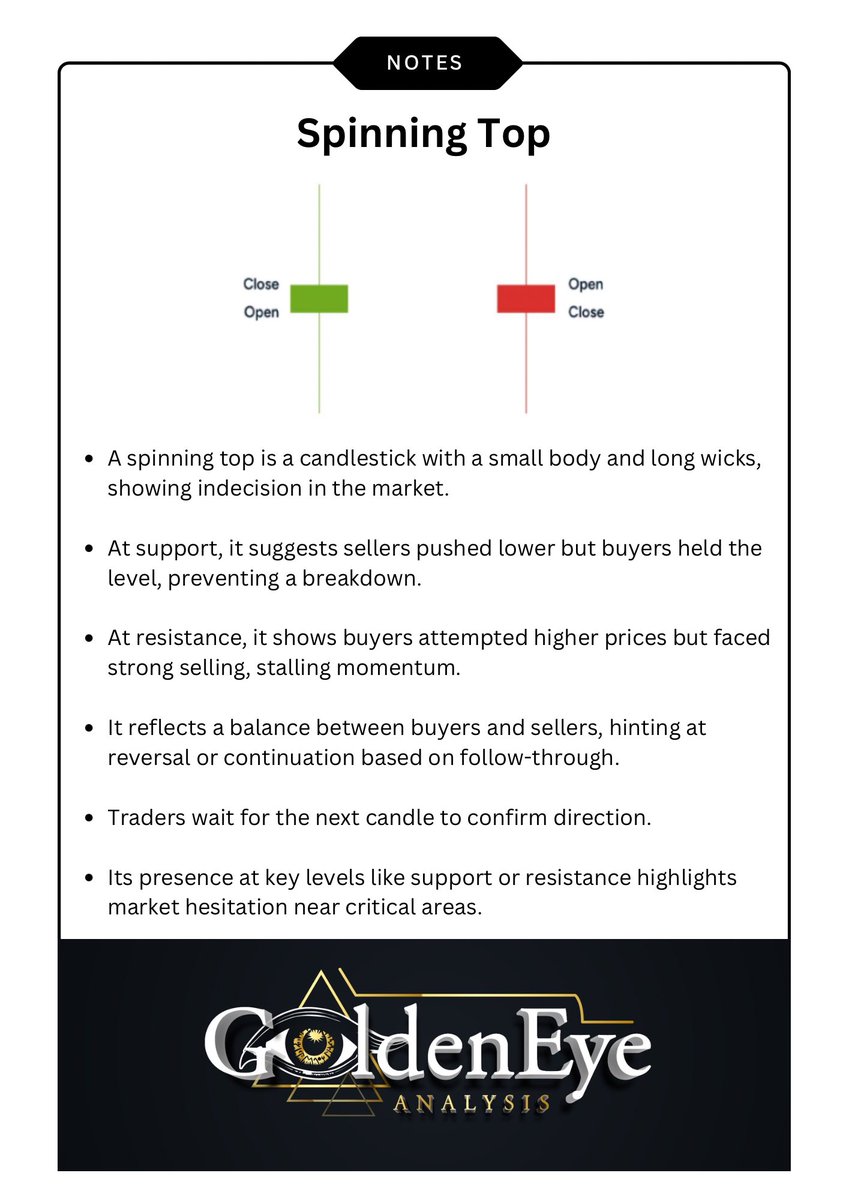
Last week’s spinning top candle at support reflects indecision, but also highlights that sellers were unable to gain meaningful downside follow-through at a key level.
The broader trend remains bullish, and with price compressing toward the apex of the triangle, a larger move is likely approaching.
Psychologically, this pattern reflects accumulation, where buyers continue stepping in on pullbacks while overhead resistance absorbs supply.
$LUN is firmly on breakout watch here, and new entries may want to remain patient for a confirmed break and close above horizontal resistance before chasing the next leg higher.
𝐉𝐨𝐢𝐧 𝐆𝐨𝐥𝐝𝐞𝐧👁️ 𝐚𝐧𝐝 𝐠𝐞𝐭 𝐚𝐜𝐜𝐞𝐬𝐬 𝐭𝐨:
• All my setup in a centralized chat room grouped by commodity
• Japanese candlestick pattern strategies
• Watch daily video reviews with tradable setups on #GOLD, #SILVER, #NATGAS, #URANIUM, $WTI, #COPPER, #BITCOIN, and more commodities
• Access educational content to help you build your trading plan
• Access to our private trading chat room
• Get unlimited on-demand chart reviews for your own setups
• Receive real-time alerts on my personal trades
Join us at goldeneyeanalysis.com
Chat Room Free Trial on Discord:
discord.com/invite/e4PEY2UcE…
$FCX $SCCO $TECK $HBM $ERO $IVN $TRQ $CS $VALE $BHP $RIO $GLNCY

Jun 8
$LUN
$LUN has respected its ascending trendline for months, producing multiple bullish pivot opportunities as buyers continue defending support.
This week, price gapped higher and is currently forming an inside-range harami doji candle, reflecting consolidation just below the horizontal resistance of a potential ascending triangle.
While the trend remains bullish, the risk-reward for new entries directly beneath resistance is not ideal if we get another confirmed pivot low reversal.
Rather than chasing here, this is one I'd keep on a breakout watchlist, as a confirmed break above resistance could trigger the next leg higher.
𝐉𝐨𝐢𝐧 𝐆𝐨𝐥𝐝𝐞𝐧👁️ 𝐚𝐧𝐝 𝐠𝐞𝐭 𝐚𝐜𝐜𝐞𝐬𝐬 𝐭𝐨:
• All my setup in a centralized chat room grouped by commodity
• Japanese candlestick pattern strategies
• Watch daily video reviews with tradable setups on #GOLD, #SILVER, #NATGAS, #URANIUM, $WTI, #COPPER, #BITCOIN, and more commodities
• Access educational content to help you build your trading plan
• Access to our private trading chat room
• Get unlimited on-demand chart reviews for your own setups
• Receive real-time alerts on my personal trades
Join us at goldeneyeanalysis.com
Chat Room Free Trial on Discord:
discord.com/invite/e4PEY2UcE…
$FCX $SCCO $TECK $HBM $ERO $CS $TRQ $IVN $BHP $RIO $GLNCY $AA
1
344
51m
𝐆𝐨𝐥𝐝𝐞𝐧👁️ - 𝐊𝐞𝐥𝐭𝐧𝐞𝐫 𝐂𝐡𝐚𝐧𝐧𝐞𝐥 𝐚𝐧𝐝 𝐑𝐒𝐈 𝐒𝐭𝐫𝐚𝐭𝐞𝐠𝐲
This strategy combines the Keltner Channel with the RSI to identify potential exhaustion points where price may be stretched too far from its average and due for a reversal.
➡️ LONG SETUP
- Price touches or closes below the lower Keltner Channel
- RSI drops below 30 (oversold)
- Wait for bullish confirmation before entering
🎯 Profit-taking zone:
• Upper Keltner Channel
• RSI approaching or exceeding 70
• Bearish reversal candle signals
➡️ SHORT SETUP
- Price touches or closes above the upper Keltner Channel
- RSI rises above 70 (overbought)
- Wait for bearish confirmation before entering
🎯 Profit-taking zone:
• Lower Keltner Channel
• RSI approaching or below 30
• Bullish reversal candle signals
➡️ The Most Important Rule:
Never buy simply because RSI is below 30.
Never short simply because RSI is above 70.
Oversold can become MORE oversold.
Overbought can become MORE overbought.
➡️ The edge comes from combining:
• Location (Keltner Channel extremes)
• Momentum (RSI extremes)
• Confirmation (candlestick reversal, trend shift, support/resistance)
➡️ Pro Tips:
• Works best in range-bound or consolidating markets.
• Avoid blindly fading strong trends.
• Higher timeframe signals generally carry more weight.
• Look for divergence between RSI and price for higher probability setups.
• Combine with support/resistance, volume profile, moving averages, or candlestick reversals for better entries.
• Risk management matters more than the indicator itself.
➡️ Trader Psychology:
When price reaches the outer Keltner Bands, emotion is usually at its highest. Retail traders often chase strength near tops and panic sell near bottoms. This strategy attempts to do the opposite, buy fear and sell euphoria, but only after price confirms that momentum is beginning to shift.
Remember: Indicators don’t predict. They identify conditions. Price action confirms the trade.
If these tips help you build a trading plan, you’ll love our full library of strategies, patterns, trade alerts, insights, videos, and chatroom. Join us at goldeneyeanalysis.com.
#Trading #StockMarket #TechnicalAnalysis #RSI #KeltnerChannel #SwingTrading #DayTrading #Investing #PriceAction #TraderEducation
#GOLD #SILVER #COPPER #BITCOIN #CL #PALLADIUM #URANIUM #DXY #platinum $GLD $XAUUSD $GC $GDX $DXY $URA $WTI $SLV $COPX $BTC $PAAS $AG $NEM $URNM $URNJ $FCX $PALL $NVDA $TSLA $AAPL #XAUUSD $DXY $SILJ $SILV $GDXJ $BTC $PALL
328
56m
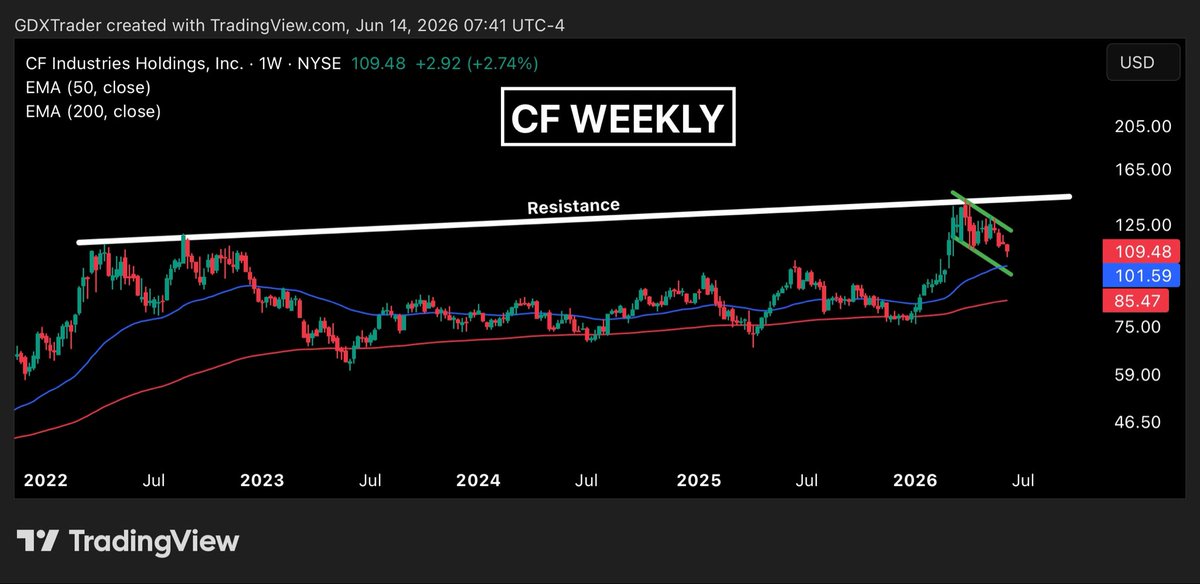
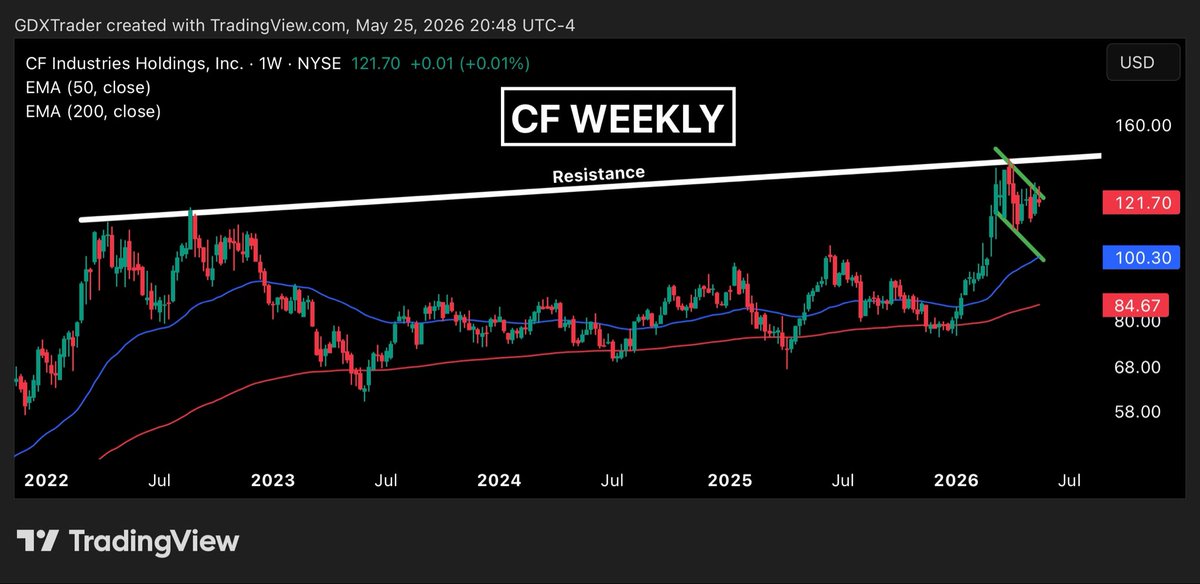
$CF
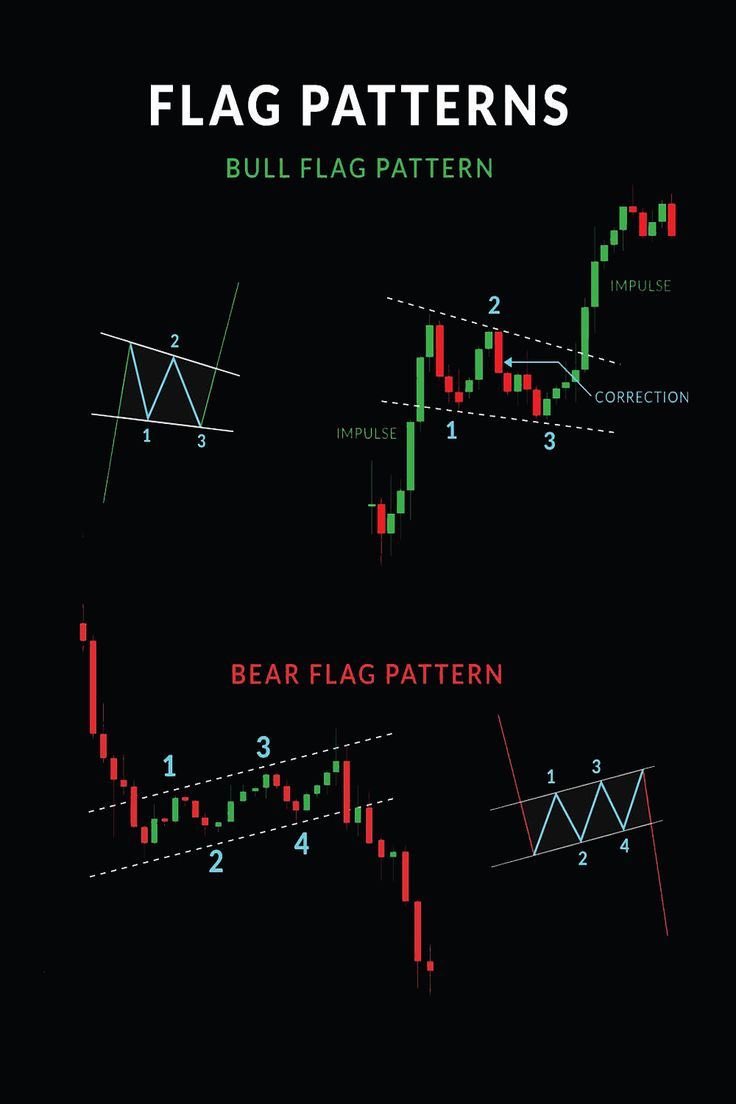
$CF continues to consolidate within a bullish flag pattern, and patience remains the key.
The chart structure remains constructive with a series of higher highs and higher lows, while price continues to hold above key moving averages, including the 50 EMA and 200 EMA, confirming the broader uptrend remains intact.
Psychologically, this pullback appears to be a healthy pause following a strong advance, allowing momentum to reset as weak hands take profits and stronger hands accumulate.
For new entries, the higher-probability setups would be either a confirmed breakout above flag resistance or a deeper retracement into the moving averages followed by a bullish pivot reversal.
Until one of those scenarios develops, patience and discipline are warranted for new entries for a better risk reward profile.
𝐉𝐨𝐢𝐧 𝐆𝐨𝐥𝐝𝐞𝐧👁️ 𝐚𝐧𝐝 𝐠𝐞𝐭 𝐚𝐜𝐜𝐞𝐬𝐬 𝐭𝐨:
• All my setup in a centralized chat room grouped by commodity
• Japanese candlestick pattern strategies
• Watch daily video reviews with tradable setups on #GOLD, #SILVER, #NATGAS, #URANIUM, $WTI, #COPPER, #BITCOIN, and more commodities
• Access educational content to help you build your trading plan
• Access to our private trading chat room
• Get unlimited on-demand chart reviews for your own setups
• Receive real-time alerts on my personal trades
Join us at goldeneyeanalysis.com
Chat Room Free Trial on Discord:
discord.com/invite/e4PEY2UcE…
$NTR $MOS $SMG $CTVA $FMC $IPI $LXU $YARIY $ICL $UAN $ADM $BG
May 26
$CF
$CF remains on breakout watch here following its bull flag structure.
Last week’s inside range spinning top at flag resistance signals hesitation and consolidation rather than bearish pressure.
Bulls continue to control the recent trend as long as the flag holds, with a breakout above flag resistance most likely sending price to retest the broader ascending resistance trendline.
$MOS $NTR $FMC $CTVA $BG $ADM $DE $AGCO $IPI $UAN $LXU $SMG
1
450
59m
$B #BARRICKGOLD
$B closed last week with a hammer candle right at the weekly 50 EMA, signaling buyers stepped in to defend support and maintain the broader uptrend.
Price continues to print higher lows, showing that bulls remain in control despite the recent consolidation.
The current symmetrical triangle reflects a period of equilibrium where buyers and sellers are compressing price into a tighter range, often preceding a larger directional move.
Psychologically, this pattern suggests bulls are absorbing supply while bears struggle to gain meaningful downside traction.
As long as the higher-low structure remains intact, the trend favors the upside. A breakout above triangle resistance would signal renewed bullish momentum and could mark the start of the next leg higher.
𝐉𝐨𝐢𝐧 𝐆𝐨𝐥𝐝𝐞𝐧👁️ 𝐚𝐧𝐝 𝐠𝐞𝐭 𝐚𝐜𝐜𝐞𝐬𝐬 𝐭𝐨:
• All my setup in a centralized chat room grouped by commodity
• Japanese candlestick pattern strategies
• Watch daily video reviews with tradable setups on #GOLD, #SILVER, #NATGAS, #URANIUM, $WTI, #COPPER, #BITCOIN, and more commodities
• Access educational content to help you build your trading plan
• Access to our private trading chat room
• Get unlimited on-demand chart reviews for your own setups
• Receive real-time alerts on my personal trades
Join us at goldeneyeanalysis.com
Chat Room Free Trial on Discord:
discord.com/invite/e4PEY2UcE…
$NEM $AEM $KGC $AGI $GOLD $BTG $OR $IAG $NGD $HMY $SSRM $AU #GOLD

2
396
$Trader retweeted
Jan 31
𝐆𝐨𝐥𝐝𝐞𝐧👁️ - 𝐏𝐫𝐢𝐜𝐞 𝐏𝐚𝐲𝐬 - 𝐋𝐞𝐚𝐫𝐧 𝐓𝐨 𝐅𝐨𝐥𝐥𝐨𝐰 𝐈𝐭
We keep our trading approach simple, focused on the only true leading indicator: price. Our goal is to help you build a clear, rule-based trading plan grounded in clean price action.
Subscribers Receive: 👇
➡️ Daily Post-Market Videos: Straightforward analysis of key markets like #GOLD, #SILVER, #URANIUM, #NATGAS, #COPPER, and more. No fluff, just price, structure, and setups.
➡️ Trade Alerts: Access to high-probability trade ideas based purely on price behavior and candle structure.
➡️ Custom Chart Reviews: Send us any ticker and get a clean breakdown across timeframes, focused on trend, support/resistance, and reversal signals.
➡️ Trading Education Library: Get access to key concepts, pattern breakdowns, and reversal strategies to help you build your trading plan and refine your edge.
🔑Join us at goldeneyeanalysis.com
#GOLD #SILVER #COPPER #BITCOIN #CL #PALLADIUM #URANIUM #DXY #PLATINUM $GLD $XAUUSD $GC $GDX $DXY $URA $WTI $SLV $COPX $BTC $PAAS $AG $NEM $URNM $URNJ $FCX $PALL $NVDA $TSLA $AAPL $SILJ $SILV $GDXJ

1
1
6
8,997
$KGC
$KGC remains in a strong uptrend and is currently pulling back to support within a bullish flag pattern.
Last week’s hammer candle at flag support signaled buyers stepping in to defend the trend, suggesting this remains a healthy consolidation rather than a full trend reversal.
While the MACD continues to expand to the downside, reflecting short-term profit-taking, price continues to hold a bullish higher-low structure.
This is the type of pause often seen after a strong advance, where weak hands exit and stronger hands accumulate.
If bulls can hold flag support and break above flag resistance in due time, it would confirm the pattern and likely trigger the next leg higher in the uptrend.
$NEM $AEM $GOLD $AU $AGI $BTG $OR $IAG $NGD $HMY $SSRM $WPM #GOLD

1
2
376
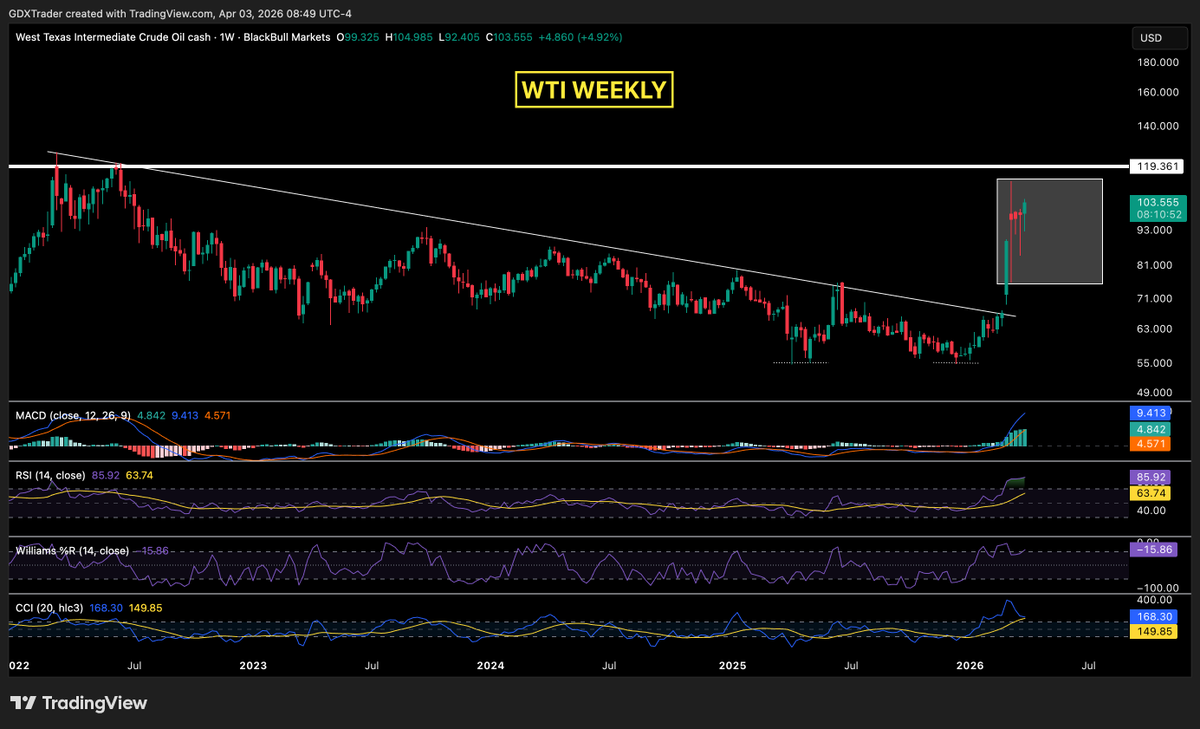
$WTI
Nothing has changed….
👇
Apr 3
$WTI
$WTI continues to respect the range defined by that weekly spinning top, which is a classic signal of indecision where neither bulls nor bears have control, leading to choppy, rotational price action.
From a psychological standpoint, this type of structure traps both sides, late bulls buying breakouts and bears anticipating reversals, resulting in failed moves and lack of follow-through, especially on the smaller timeframes.
This is why higher timeframe traders often struggle here, as there’s no clear directional edge while price remains within that range.
Our initial thesis from a few weeks ago shared in the video below continues to play out, and with price still consolidating, it becomes a patience game rather than an opportunity to press new risk.
We’ve already scaled out into strength last week, locking in profits, and at this stage we’re focused on preservation rather than initiation until we see either a clear range break or a defined structure emerge.
We’ve just shared a full multi-timeframe breakdown of $WTI, daily, weekly, and monthly, with our key levels, scenarios, and trade plans in our chat room. If you trade $WTI and want access to our levels, entries, and ongoing analysis, join us at goldeneyeanalysis.com.
Chat Room Free Trial on Discord:
discord.com/invite/e4PEY2UcE…
#CL #CRUDE #CRUDEOIL #ENERGY $AR $BNO $BP $BRENT $CHK $COP $CVX #WTI $DBO $DRIP $ET $FENY $IEO $OIL $OILK $OIH $OXY $PBR $PR $RIG $RRC $SCO $SLB $SWN $UCO $UGA $USL $USO $USOIL $VDE $WTI $XOM
1
689
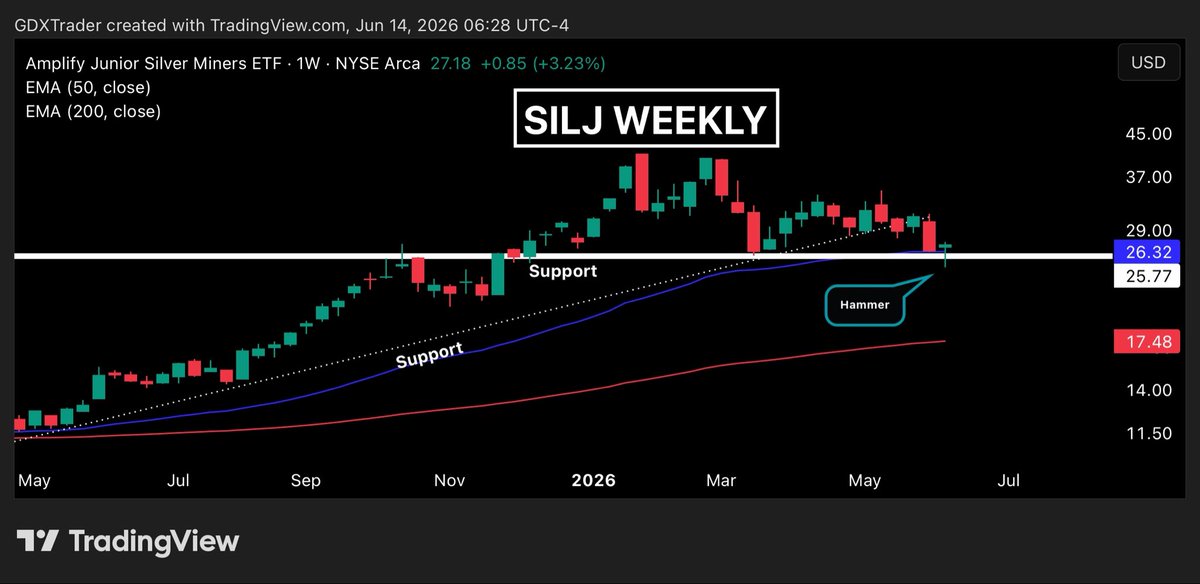
$SILJ
$SILJ printed a hammer candle this week right at a key area of horizontal support that aligns with the 50 EMA, putting the ETF on pivot watch heading into next week.
Sellers were able to push price lower during the week, but bulls stepped in aggressively and recovered the decline, signaling demand at an important support zone.
The hammer itself is a signal candle, suggesting selling pressure may be exhausting, but confirmation is still required.
A close above the hammer’s high next week would validate the reversal attempt and increase the odds of a pivot low forming.
With support holding and the 50 EMA being defended, this is a constructive setup to monitor, but as always, the edge comes from the confirmation, not the signal candle alone.
Stay organized and trade with confidence by accessing all my charts by commodity type, including key setups and my personal trades. Learn in real time through our active chat room and stay aligned with market momentum with a daily technical video on our most popular commodities. The result: better preparation, cleaner execution, and smarter decisions all for just $5 at goldeneyeanalysis.com.
$PAAS $AG $EXK $HL $CDE $MAG $SVM $SILV $FSM $WPM $FNV $AEM $NEM $BTG $OR $KGC $SSRM $MUX $GATO $AYA #SILVER
1
5
523
$LEU
$LEU put in a bullish Fred Tam reversal candle on Thursday at the descending support of a falling wedge, signaling that buyers were beginning to defend a key area of demand.
Friday delivered confirmation with a bullish continuation candle, giving bulls a potential pivot low reversal setup.
From a psychology standpoint, sellers failed to press the breakdown at support, while buyers stepped in aggressively enough to shift short-term momentum.
The key now is measuring bounce strength if price approaches overhead resistance and the declining 50 and 200 EMA moving averages.
While this could develop into a larger recovery rally, the broader trend remains bearish until those levels are reclaimed.
For subscribers who took it long, this remains a trim-and-trail setup, allowing price action and momentum to dictate how much upside can be captured.
Most traders fail because they lack a process, chase price, and let emotions drive decisions. If you trade #URANIUM stocks, our daily technical analysis helps you build a disciplined framework by identifying key levels, chart patterns, momentum shifts, and real-time entries and exits so you can trade with confidence and a clear plan instead of emotion. Join our private community at GoldenEyeAnalysis.com.
Check us out on discord:
discord.com/invite/e4PEY2UcE…
$URA $URNM $URC $LEU $FUU $URC $UROY $CCJ $DNN $UUUU $URG $UEC $EFR $SRUUF $NXE $URNJ $GLATF $WUC $PDN #URANIUM $CCO $ASPI

2
496
$Trader retweeted
Jun 12
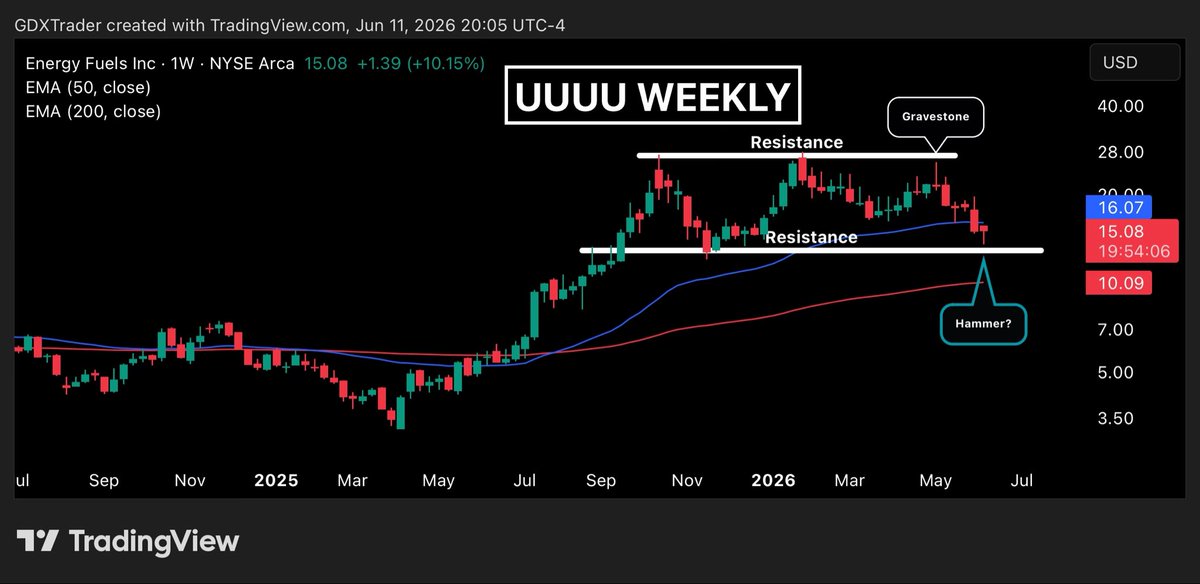
$UUUU
$UUUU has played out as expected since our May 17 post, where we highlighted a gravestone doji at horizontal resistance and the potential for a triple top pattern.
Bears successfully defended resistance, leading to a pullback that eventually broke the ascending support of the prior ascending triangle.
However, the chart may now be transitioning into a high-base rectangle structure, which is worth monitoring.
This week’s candle is particularly important as it has the potential to close as a hammer. From a psychology standpoint, a hammer reflects a strong rejection of lower prices, showing that bulls were able to absorb heavy selling pressure and recover most of the week’s losses by the close.
While the hammer itself is an encouraging signal, the real edge comes from confirmation.
If next week price can close above this week’s high and ideally reclaim the 50-week EMA, it would confirm a bullish pivot and suggest momentum is shifting back in favor of the bulls after several weeks of weakness.
Until then, patience is required. We don’t buy the hammer, we buy the confirmation that demand is truly returning.
Join us at goldeneyeanalysis.com to learn Japanese candlestick patterns.
$URA $URNM $URC $LEU $FUU $URC $UROY $CCJ $DNN $UUUU $URG $UEC $EFR $SRUUF $NXE $URNJ $GLATF $WUC $PDN #URANIUM $CCO $ASPI

May 18
$UUUU
$UUUU put in a gravestone doji two weeks ago right at horizontal resistance of the ascending triangle, signaling exhaustion from buyers after the failed breakout attempt.
Last week the bears followed through with confirmation selling pressure, shifting short-term momentum lower and now challenging the rising ascending support trendline.
While the broader structure technically remains constructive with price still above the 50 EMA and continuing to print higher lows, this area becomes critical because a loss of ascending support could invalidate the triangle pattern altogether and trigger a deeper retracement.
The MACD continues to weaken with bearish divergence, showing momentum has been fading even as price attempted to push higher.
For new longs, patience remains key here. Either bulls need to reclaim momentum with a confirmed breakout above triangle resistance, or traders should wait for price to establish to pivot at a demand zone.
Are you a #URANIUM fundamental-driven trader looking for technical insights to support or challenge your decisions? We produce daily videos that highlight key levels, setups, and price sentiment, designed to give you a clear technical edge. We’d love to have you join our team.
Try us out at goldeneyeanalysis.com.
$URA $URNM $URC $LEU $FUU $URC $UROY $CCJ $DNN $UUUU $URG $UEC $EFR $SRUUF $NXE $URNJ $GLATF $WUC $PDN #URANIUM $CCO $ASPI


1
10
3,082
#BITCOIN
$BTC has invalidated its pennant pattern to the upside, with yesterday’s bullish continuation candle.
The failed bearish consolidation might force sidelined traders and shorts to reassess, while momentum buyers begin stepping back in.
The MACD is on the verge of a bullish crossover, which could act as an additional tailwind if confirmed.
Let’s see if momentum continues to expand and if we get a leg higher here.
If you trade #BITCOIN and struggle with profitability, I share a daily post-market video with subscribers covering technical analysis, chart patterns, key levels, and trade entries/exits to help navigate the market with confidence.
Subscribe at goldeneyeanalysis.com
Check us out on discord:
discord.com/invite/e4PEY2UcE…
$BTCUSD $BKCH $BTC $GBTC $MSTR $RIOT $COIN $BITW $ARKW $BTCM $BLOK $HUT $BITO $NVDA $SQ $PYPL $MARA $SBIT $BITX $IREN
1
398
$Trader retweeted
23h
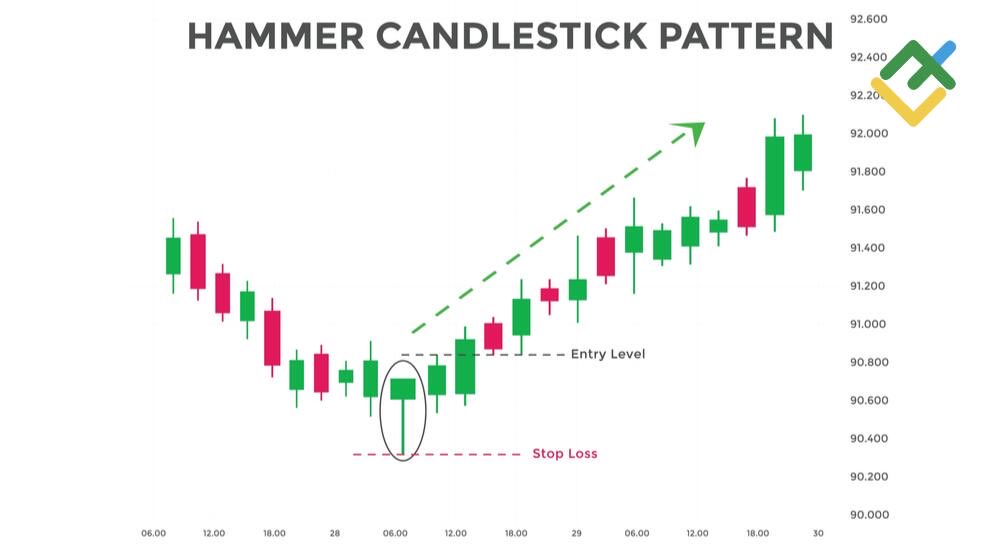
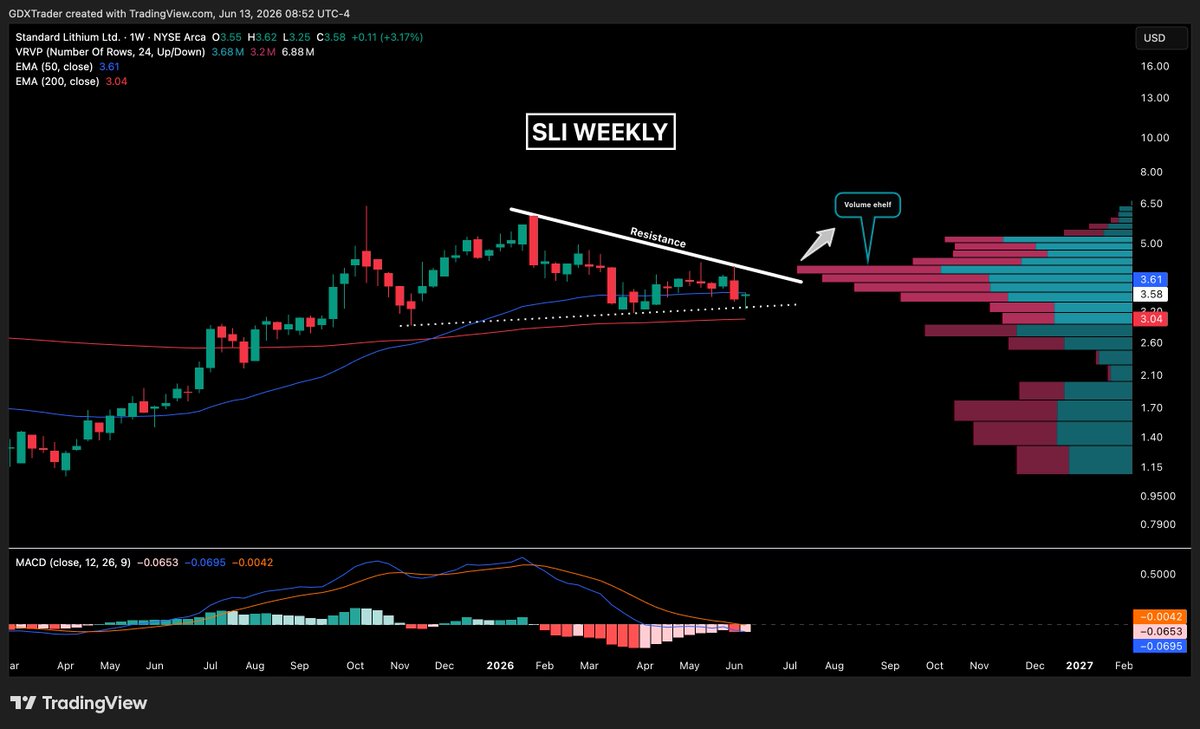
$SLI
$SLI remains in a consolidation phase, holding above the 200 EMA while last week’s dragonfly doji just below the 50 EMA showed buyers defending the pullback but lacking the momentum to reclaim resistance.
A strong volume profile supply zone and descending resistance continue to cap upside progress. From a psychology standpoint, bulls are accumulating and defending dips, while bears remain active overhead.
Until price can break above descending resistance and clear the supply zone, patience is warranted. A confirmed breakout would likely trigger the next leg higher.
$LAC $ALTM $SGML $PLL $LTHM $LICY $ATLX $LITM $AMLI $LTBR $LAAC $RIO
1
2
807
$Trader retweeted
23h
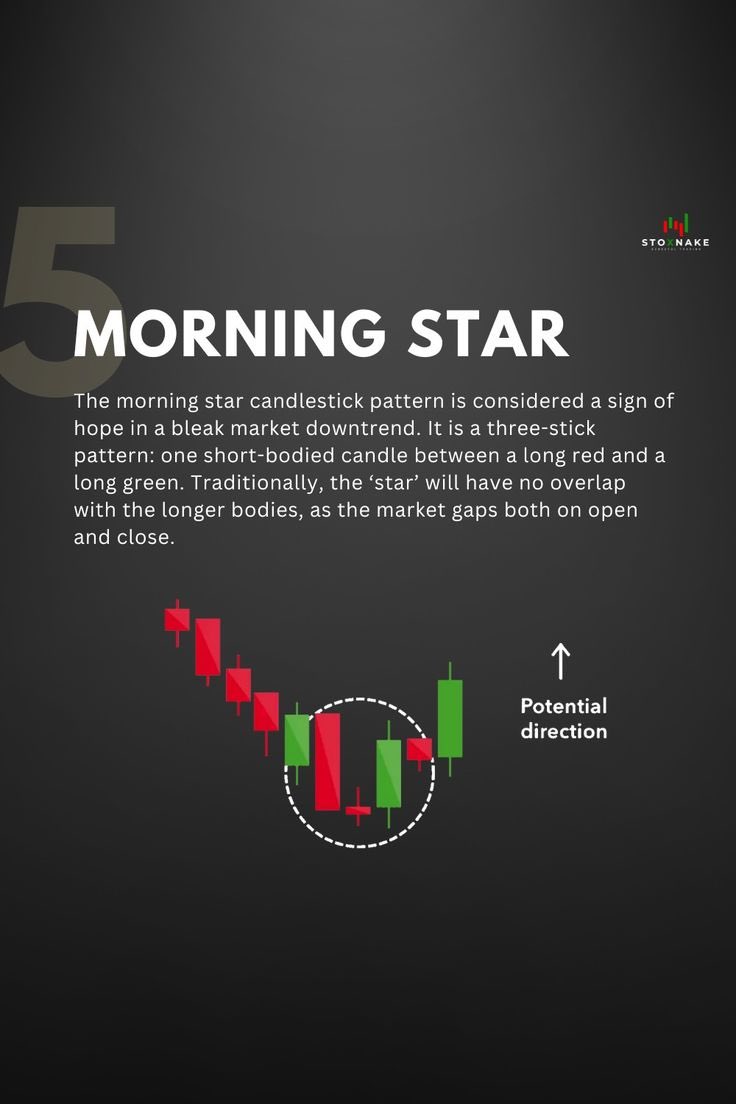
$BTU
$BTU has followed the bearish outlook from our post series, with the bearish Fred Tam reversal candle and June 9th confirmation allowing bears to maintain control.
However, bulls are attempting to establish a pivot low. Thursday's inside range candle signaled a pause in selling pressure, and Friday delivered confirmation with a close above the open of Wednesday's bearish candle, completing a Morning Star reversal pattern.
The challenge is that this setup is not occurring at a major support level, and price closed directly at the 50 EMA and 200 EMA, both acting as overhead resistance.
From a psychological standpoint, buyers are showing demand, but have yet to prove they can regain control.
A break and close above these key moving averages could lead to a retest of horizontal resistance overhead, but until bulls reclaim those levels and show follow-through, patience remains warranted.
𝐉𝐨𝐢𝐧 𝐆𝐨𝐥𝐝𝐞𝐧👁️ 𝐚𝐧𝐝 𝐠𝐞𝐭 𝐚𝐜𝐜𝐞𝐬𝐬 𝐭𝐨:
• All my setup in a centralized chat room grouped by commodity
• Japanese candlestick pattern strategies
• Watch daily video reviews with tradable setups on #GOLD, #SILVER, #NATGAS, #URANIUM, $WTI, #COPPER, #BITCOIN, and more commodities
• Access educational content to help you build your trading plan
• Access to our private trading chat room
• Get unlimited on-demand chart reviews for your own setups
• Receive real-time alerts on my personal trades
Join us at goldeneyeanalysis.com
Chat Room Free Trial on Discord:
discord.com/invite/e4PEY2UcE…
$ARCH $AMR $HCC $ARLP $CEIX $METC $NRP $SXC $TECK $RIO $BHP $CLF

Jun 10
$BTU
$BTU delivered a Fred Tam reversal signal at horizontal resistance Friday, warning that buyers were running into a significant supply zone after the bullish wedge breakout we highlighted a few weeks ago.
Yesterday’s inside range candle reflected indecision and consolidation within Fridays range, and today bears gained the upper hand with confirmation as price closed below the mother bar and fell back under the 50 EMA.
From a psychology standpoint, this is a classic shift from accumulation to profit-taking, as traders who participated in the wedge breakout had ample opportunity to lock in gains near resistance.
The rejection at resistance confirms that sellers are currently more aggressive than buyers at these levels, resulting in a loss of bullish momentum.
There is no fresh long setup here. For now, the rejection at resistance and bearish follow-through suggest sellers took over control of the short-term trend.
No need to overcomplicate your trading approach. Focus on understanding supply and demand levels and the price sentiment revealed through Japanese candlestick patterns. Simple, repeatable strategies often outperform complicated systems. Learn how to read market psychology and trade Japanese candlestick strategies at GoldenEyeAnalysis.com.
$ARCH $AMR $CEIX $HCC $METC $NC $ARLP $NRP $SXC $WHITF $TECK $YALXF


1
2
1,280
$Trader retweeted
Jun 13
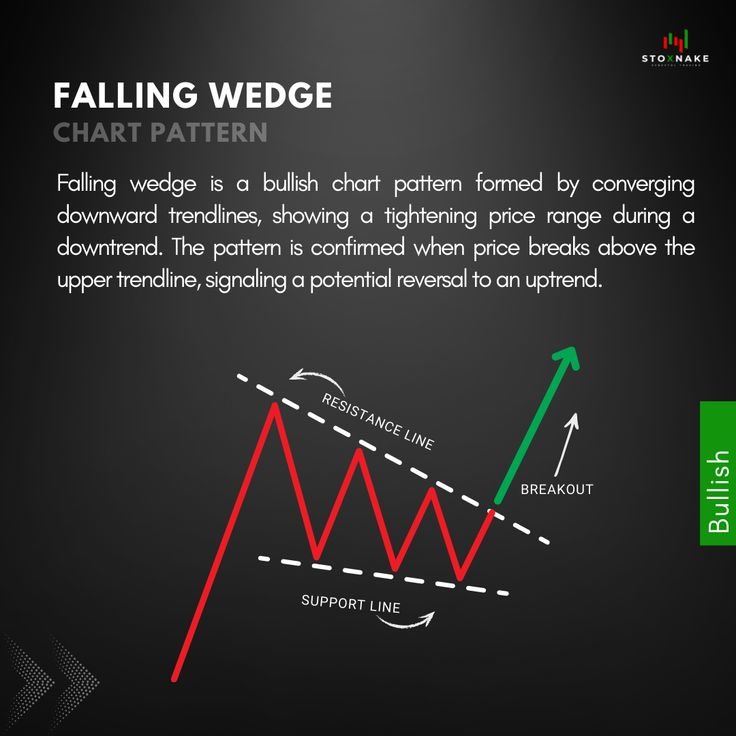
$AG
$AG put in a Morning Star reversal pattern on Thursday at potential descending support of its bullish wedge, signaling that selling pressure was beginning to fade and buyers were stepping in at a key technical level.
Friday delivered confirmation with a bullish continuation candle, validating the pivot and giving traders a defined-risk setup against recent lows.
While price remains below the 200 EMA, the successful defense of wedge support suggests bulls are attempting to regain momentum after a period of weakness.
The focus next week will be on measuring the strength of this bounce and whether buyers can reclaim overhead resistance levels and sustain follow-through.
If momentum continues to build and price can eventually break above the upper boundary of the bullish wedge, it would likely confirm a change in character and open the door for the next directional leg higher.
If you’re interested in learning technical analysis, join a trading community where a variety of strategies are shared, real trades are posted, and daily video reviews cover major commodities. The focus is on Japanese candlestick patterns, market psychology, and broader technical outlooks to help improve timing and decision-making. Join us at goldeneyeanalysis.com
$PAAS $HL $CDE $EXK $SVM $MAG $WPM $SILV $FSM $SSRM $GPL $AYA

2
9
1,297
$Trader retweeted
23h
$FSM
$FSM closed last week with a hammer candle right below the 50 EMA, signaling that buyers stepped in to defend horizontal support after an extended period of selling pressure.
While the candle suggests demand is emerging at this level, the broader picture remains mixed as lagging indicators continue to show weakness, with the MACD still expanding to the downside and the RSI sitting in a neutral-to-weak zone at 46.
From a market psychology standpoint, bulls have successfully defended support, but they have not yet proven they can regain control of momentum.
The key next week will be confirmation. If buyers can deliver follow-through and reclaim the 50 EMA with a strong close, it would validate the hammer candle and potentially trigger a bullish pivot reversal with defined risk against recent lows.
Until then, patience is warranted as bears still maintain the momentum advantage despite the initial signs of support holding.
For traders seeking to learn effective Japanese candlestick strategies, in-depth technical concepts, detailed chart setups, and our post-market technical analysis video newsletter covering popular commodities, where we teach these approaches and more, join us at goldeneyeanalysis.com.
Discord: discord.com/invite/e4PEY2UcE…
$AG $PAAS $HL $CDE $EXK $SVM $MAG $WPM $SSRM $GPL $SILV $AYA

1
7
1,176
$Trader retweeted
Apr 14
𝐓𝐡𝐞 #𝟏 𝐑𝐞𝐚𝐬𝐨𝐧 𝐂𝐨𝐦𝐦𝐨𝐝𝐢𝐭𝐲 𝐓𝐫𝐚𝐝𝐞𝐫𝐬 𝐒𝐭𝐫𝐮𝐠𝐠𝐥𝐞:
𝐌𝐢𝐬𝐫𝐞𝐚𝐝𝐢𝐧𝐠 𝐏𝐫𝐢𝐜𝐞 𝐀𝐜𝐭𝐢𝐨𝐧
- Misreading Price Action and Market Psychology
- Lack of Patience and Confirmation
- Poor Risk Management and Position Sizing
𝐆𝐨𝐥𝐝𝐞𝐧𝐄𝐲𝐞 – 𝐏𝐫𝐢𝐜𝐞 𝐏𝐚𝐲𝐬
- We focus on the only real leading indicator: price
- No noise. No lag. Just structure & candle psychology.
➡️ What you get as a member:
• Daily post-market videos on #GOLD #SILVER #COPPER #URANIUM #NATGAS & more
• Trade alerts based on price behavior, not hope
• Learn why setups fail before they fail
• Custom chart requests based on your favourte ticker
• Private chat room access to my personal trades
The real risk in commodities isn’t volatility… It’s staying unskilled while opportunity keeps moving .
Join here: goldeneyeanalysis.com
#GOLD #SILVER #COPPER #BITCOIN #CL #PALLADIUM #URANIUM #DXY #platinum $GLD $XAUUSD $GC $GDX $DXY $URA $WTI $SLV $COPX $BTC $PAAS $AG $NEM $URNM $URNJ $FCX $PALL $NVDA $TSLA $AAPL #XAUUSD $DXY $SILJ $SILV $GDXJ $BTC $PALL

1
3
6,750
$Trader retweeted
22h
$EXK
$EXK is worth watching following our prior post where we highlighted ascending channel support as a key level of interest.
Last week, bulls stepped in and printed a hammer candle at channel support, a level that also aligns with the support of a potential falling wedge within the broader ascending channel.
The hammer shows sellers pushed price lower during the week, but buyers regained control and closed near the highs.
Demand might be emerging at a key support zone and momentum may be shifting. Bulls now need follow-through buying next week to confirm the signal and validate a bullish pivot low reversal. One to watch closely.
$PAAS $AG $HL $CDE $MAG $FSM $SVM $SSRM $WPM $SIL $SILJ $AYA
Jun 9
$EXK
$EXK lost its 50 EMA last week, and this week we continue to see bearish follow-through as sellers maintain short-term control.
Price is now approaching ascending channel support, an area where we can begin watching for signs of demand and a potential shift in sentiment.
If buyers fail to defend this level, the next significant support zone may be the 200 EMA.
From a psychology standpoint, bulls are currently on the defensive, and there is little evidence yet that selling pressure has been exhausted.
Over the coming weeks, we'll be looking for signs of accumulation, indecision candles, or a confirmed pivot low reversal at these support zones.
Until buyers begin to show up with conviction and price confirms a reversal, patience remains the best strategy for new entries.
$PAAS $AG $HL $CDE $MAG $SVM $WPM $FSM $SILV $AYASF $GPL $SSRM

1
6
1,888
$Trader retweeted
22h
$CDE
$CDE printed a hammer candle last week as bulls stepped in to defend both ascending support and the 50 EMA, with strong volume adding conviction to the reaction.
The long lower wick signals that sellers pushed price lower but were unable to maintain control, as buyers aggressively absorbed supply near a key demand zone.
From a psychology standpoint, this is an early sign that downside momentum may be fading and that bulls are willing to defend the trend.
However, the setup still requires confirmation. If buyers can deliver follow-through next week with a strong close above the hammer high, it could validate a pivot low reversal and increase the odds of a move back toward overhead resistance.
For now, support has held, but confirmation remains the key ingredient before declaring a trend shift.
Join us at goldeneyeanalysis.com to learn more about Japanese candlesticks, including signal candles, confirmation candles, and reversal candle combinations while we review via post market video analysis #GOLD, #SILVER, #URANIUM, #CL, #COPPER, #NATGAS and a bunch of other commodities. We trade price and price action only, no need to overcomplicate it.
Check us out on discord:
discord.com/invite/e4PEY2UcE…
$HL $EXK $AG $PAAS $MAG $FSM $SILV $SSRM $SVM $AYA $WPM $GATO #SILVER

1
14
1,490
$Trader retweeted
15h
#COPPER
#COPPER followed the setup we highlighted two days ago when price tested the 50 EMA, a level that has consistently acted as demand and support over the past several months.
Thursday ending up closing with a bullish engulfing candle signaling that buyers were stepping in aggressively to defend that 50 EMA, and Friday delivered the confirmation with a bullish continuation candle, validating the pivot and reinforcing short-term momentum in favor of the bulls.
Price is now consolidating just below horizontal resistance, where the next battle between supply and demand is taking place.
A decisive break above $6.70 could signal that bulls have absorbed overhead selling pressure and could trigger the next leg higher.
Subscribers, we just posted our full #Copper technical analysis covering the daily, weekly, and monthly timeframes, along with our outlook heading into next week, in the chat room.
If you trade #COPPER and are struggling to become consistently profitable, second-guessing your entries and exits, or looking for guidance from experienced traders, join us for daily chart reviews and real-time market video analysis. We break down key levels, chart patterns, momentum shifts, risk management, and trade setups while sharing our thought process and trades in real time. Stop trading alone and learn alongside a community focused on consistency, discipline, and long-term success.
Subscribe at goldeneyeanalysis.com
Check us out on discord:
discord.com/invite/e4PEY2UcE…
$ERO $FCX $SCCO $BHP $RIO $TECK $GLNCY $TGB $HBM $CPER $COPX $VALE $NEM $XME $AA $CLF $MT $ANTO $LUN $IVN $TRQ $KAT
Jun 11
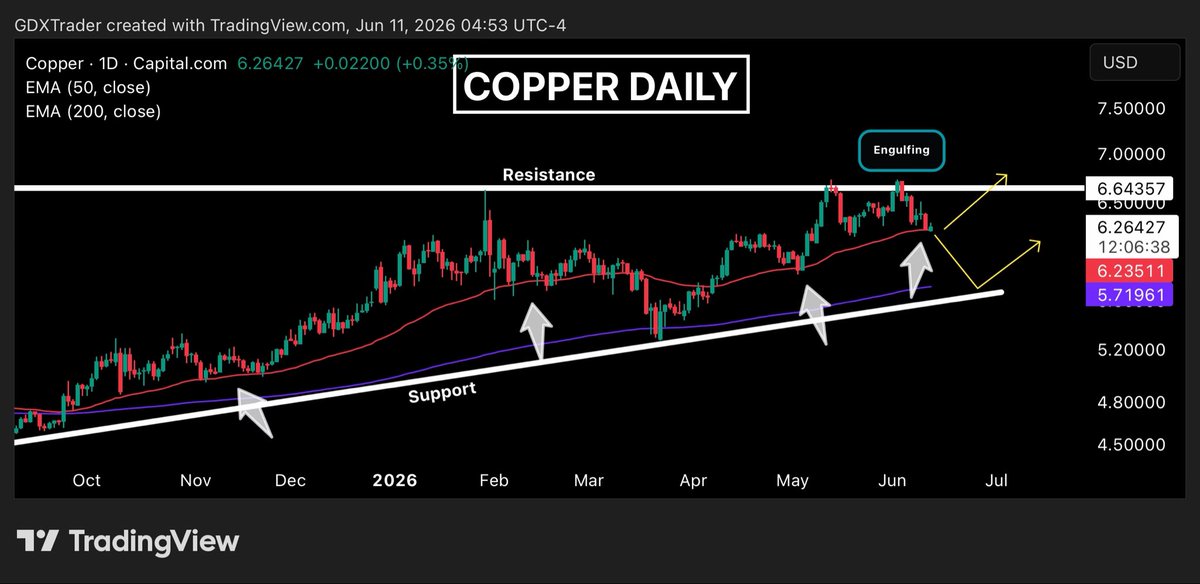
#COPPER
Copper bulls are defending the 50 EMA today, a level that has repeatedly acted as dynamic support over the past year.
Holding this area suggests buyers are still willing to step in on pullbacks and maintain the current uptrend.
If the 50 EMA fails, attention will likely shift to ascending support, which aligns with the 200 EMA and could become the next key demand zone.
From a broader perspective, #copper continues to trade within an ascending triangle, a bullish continuation pattern that reflects higher lows and buyers stepping in at progressively higher prices.
While the overall structure remains constructive, the risk-to-reward for new long positions is less attractive directly below horizontal resistance.
A confirmed breakout above resistance could offer a breakout opportunity, while a pullback into ascending support with a bullish pivot may provide a more favorable entry with defined risk.
If you trade #COPPER and are struggling to become consistently profitable, second-guessing your entries and exits, or looking for guidance from experienced traders, join us for daily chart reviews and real-time market video analysis. We break down key levels, chart patterns, momentum shifts, risk management, and trade setups while sharing our thought process and trades in real time. Stop trading alone and learn alongside a community focused on consistency, discipline, and long-term success.
Subscribe at goldeneyeanalysis.com
Check us out on discord:
discord.com/invite/e4PEY2UcE…
$ERO $FCX $SCCO $BHP $RIO $TECK $GLNCY $TGB $HBM $CPER $COPX $VALE $NEM $XME $AA $CLF $MT $ANTO $LUN $IVN $TRQ $KAT

4
8
1,671