
Mixed Family Farm Eudunda, Farrel Flat and Coomandook SA. Min Till Cropping and livestock. Trying to put the pieces together
Joined July 2013
- Tweets 3,035
- Following 1,384
- Followers 2,381
- Likes 13,700
274 Photos and videos


Mar 26
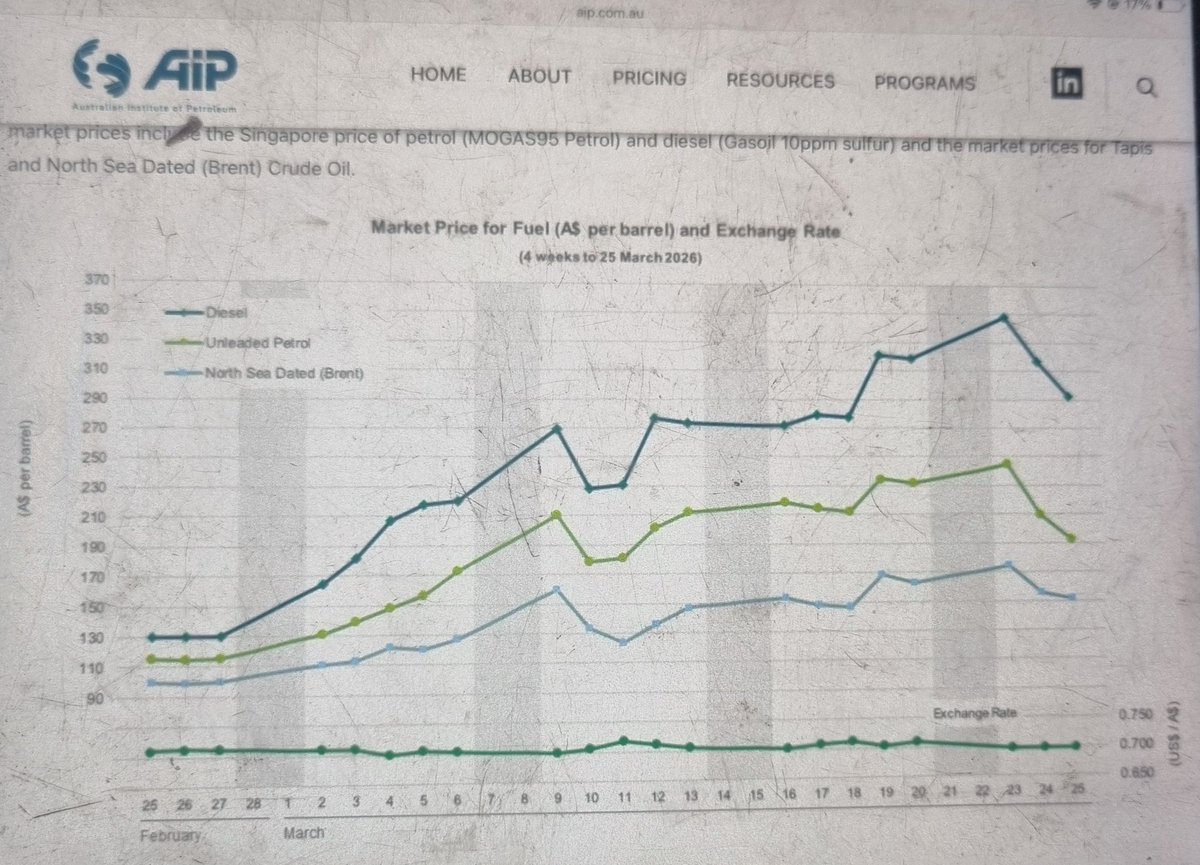
So, if we are using the current pricing of fuel as the big 4 fuel cartel say is the go, good news, prices should start doing down😂😂😂😂😂😂😂😂😂😂😂😜😥
2
23
1,112
Mar 23
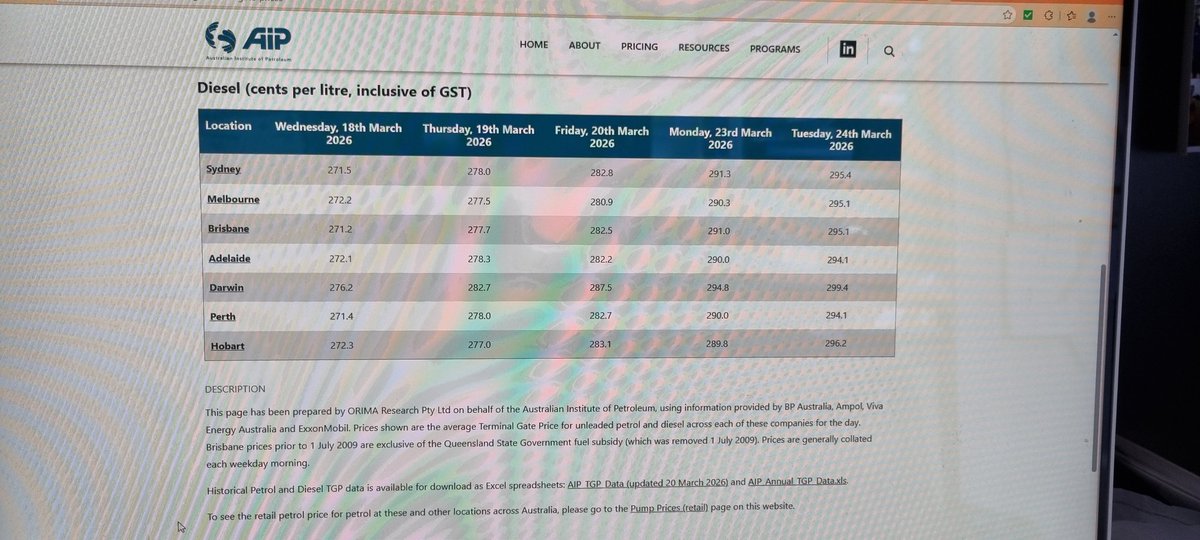
Right, homework yesterday on diesel with the 2 suppliers we use
Both stated there is no issue with supply but the ability to get it from distributor due to the allocation process being used at port.
No one can tell me who's in charge of the allocation process? @CorbinSchuster ?
4
3
30
3,538
Mar 21
In the world of just in time🙄
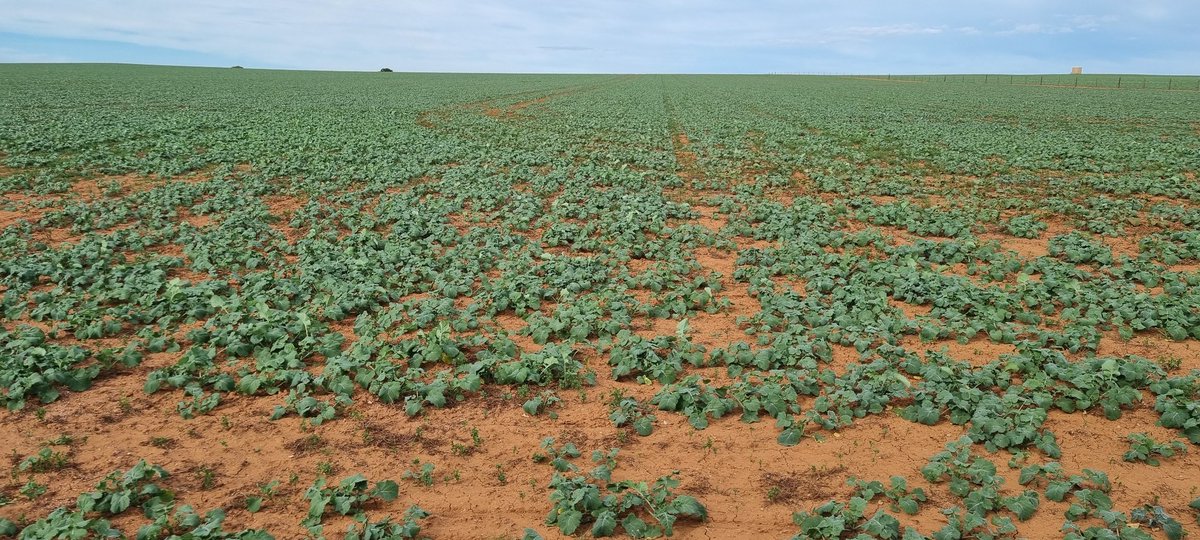
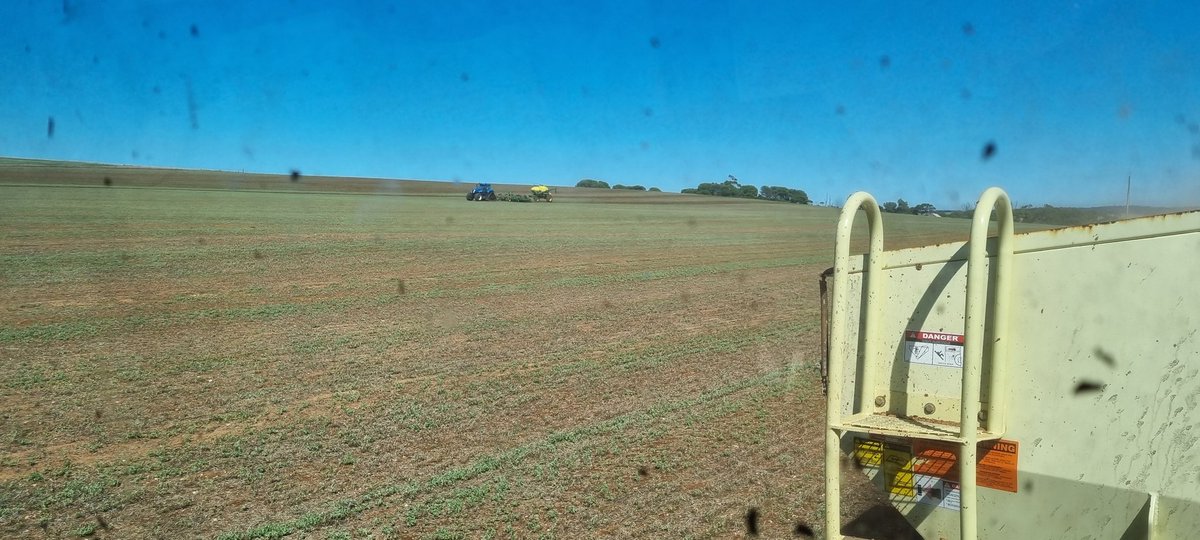
Sprayed yesterday, gypsum going out in front of the seeder
PY424GC @pioneerseedsau
I was told I'm crazy if I don't make use of the moisture, kinda think I'm crazy. The old when the moistures right thing
Time will tell
6
46
9,207
Anthony Pfitzner retweeted

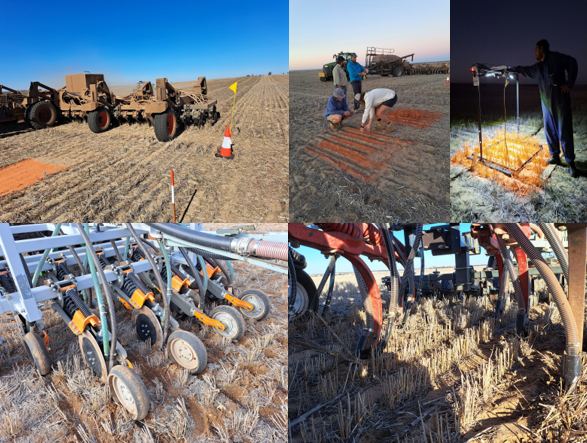
29 May 2025
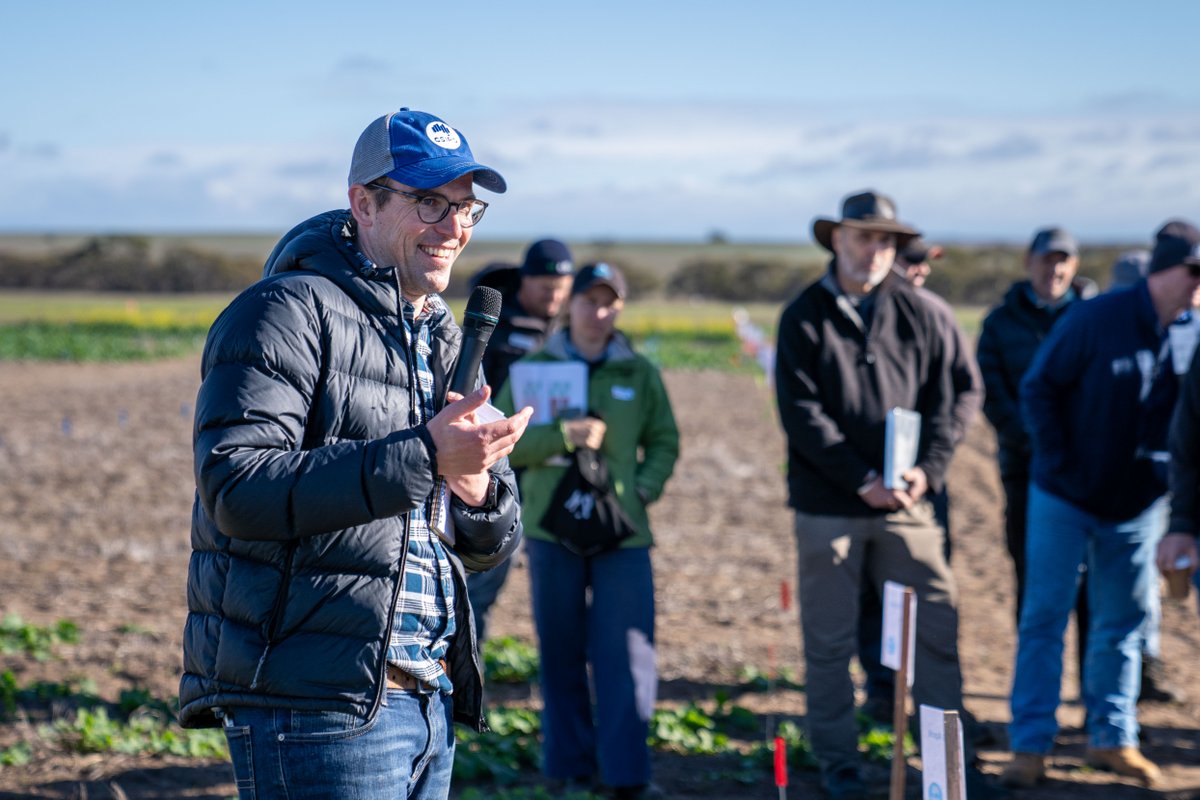
Trial at @SADiscoveryFarm Moorland Innovator site with @AgEngUniSA @EldersLimited evaluating crop safety under 7 pre-em herbicides and soil disturbance footprint of double disc, tyne and hybrid discs. @UniversitySA #FutureDroughtFund #droughtresilience @FlindersUniNews @SA_PIRSA
1
6
29
1,668
Anthony Pfitzner retweeted

10 Dec 2024
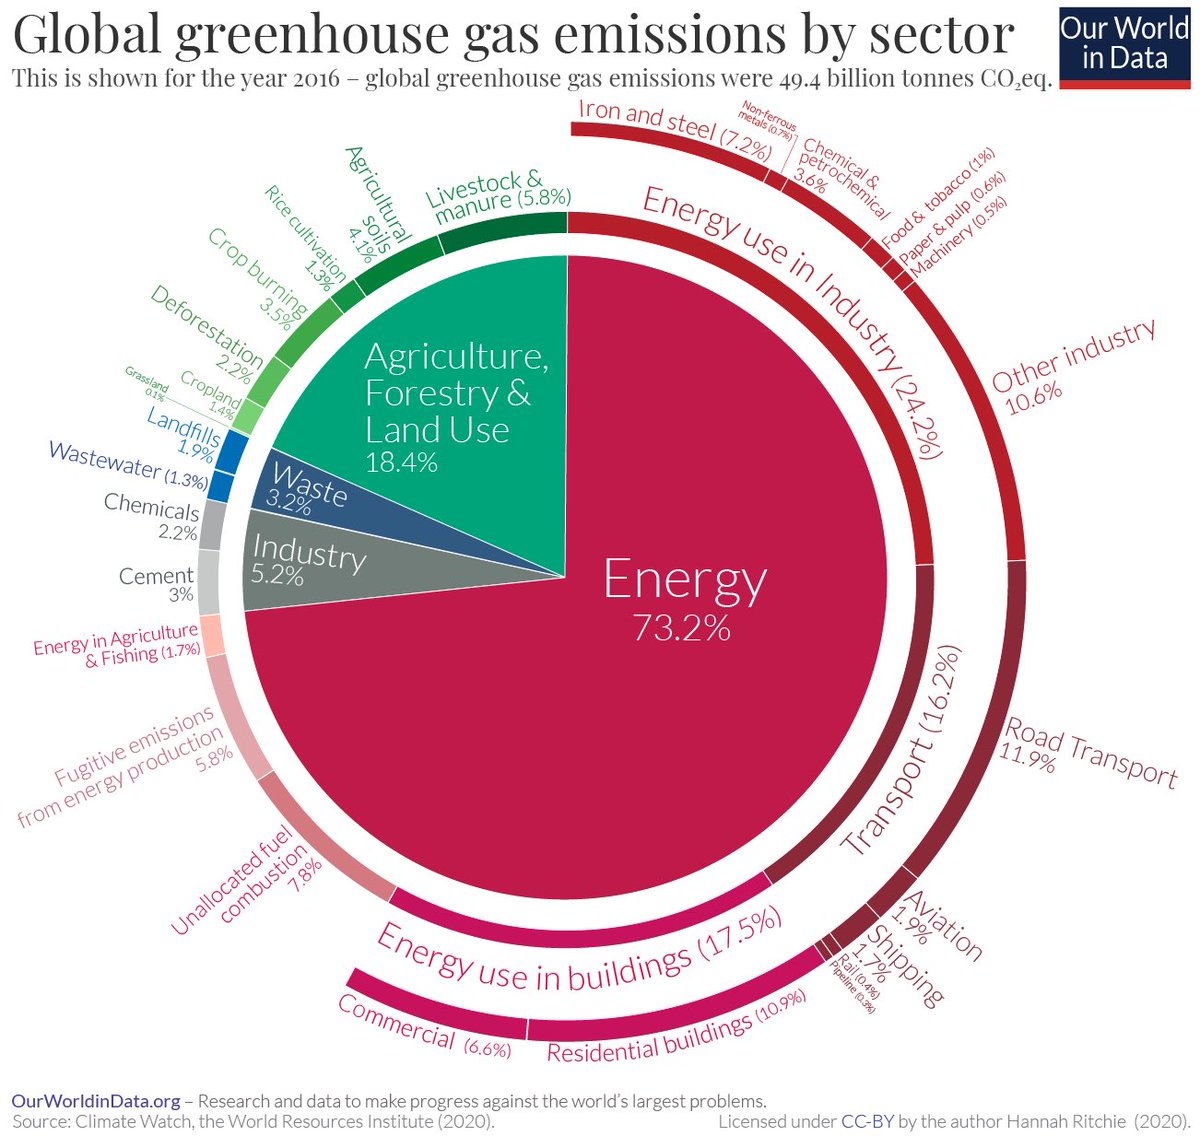
Many environmental activists in government and academia deliberately spread false information about livestock and GHG emissions. It's sad to witness the decline in scientific robustness in both government and academia.
8 Dec 2024

Livestock and manure contribute to just 5.8% of total greenhouse gas (GHG) emissions. The notion that methane from cattle farts / burps are an existential threat to the planet is patently false. We are stuck on stupid.
6
20
1,735

Anthony Pfitzner retweeted

16 Oct 2024
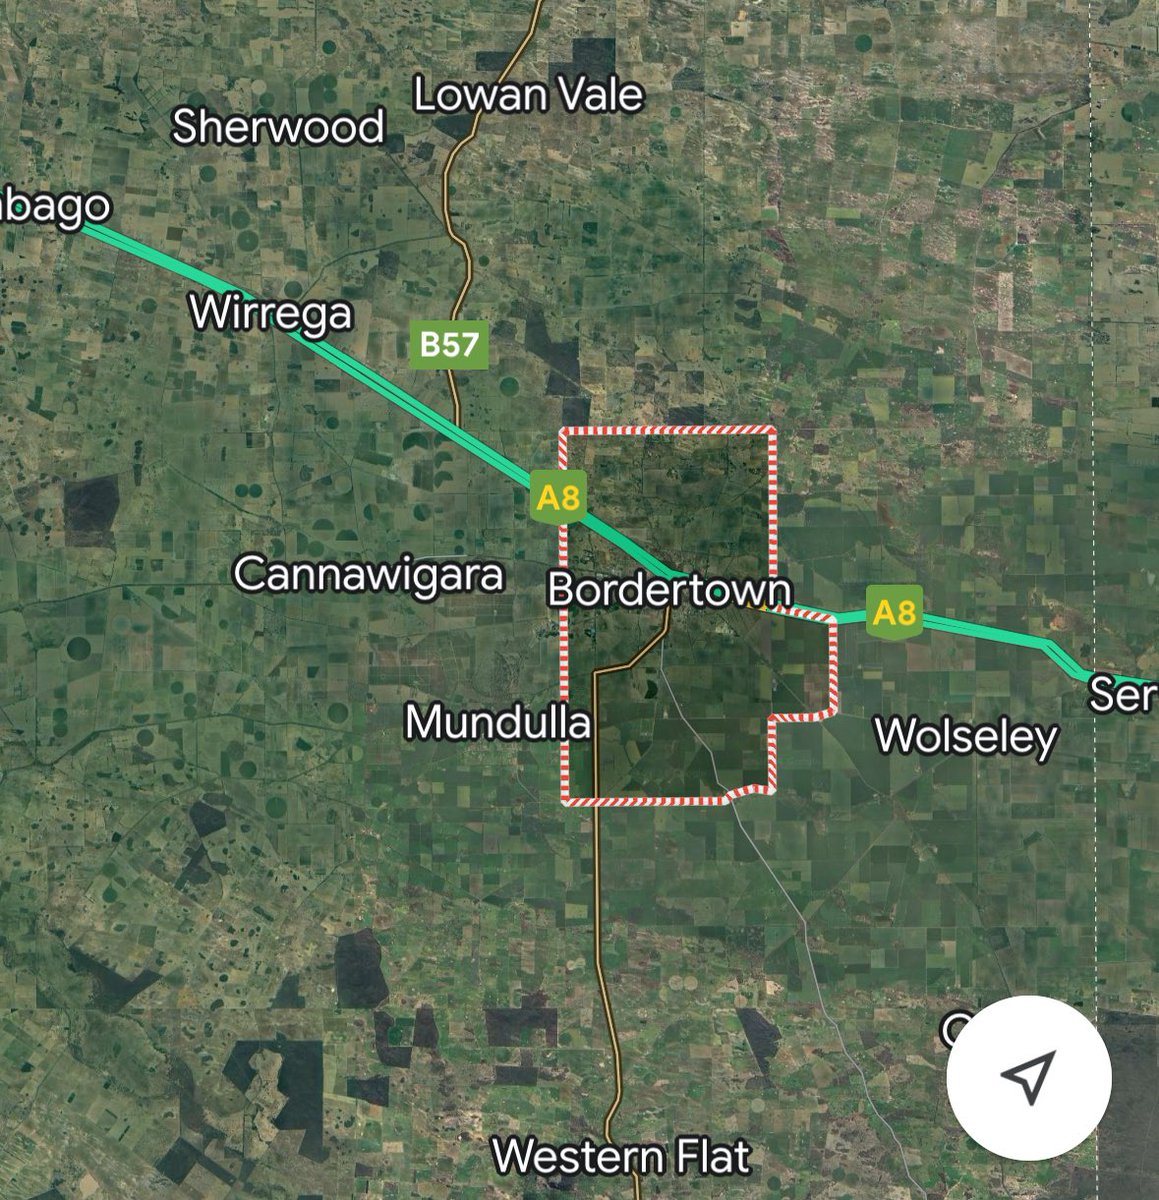
We have a soil sampling machine heading to Bordertown & surrounding districts next week. If you have hay stubble or pasture you would like pH mapped please get in touch. Spring discounts still available for mapping done in before November 30th.
1
6
23
2,996
Anthony Pfitzner retweeted

13 Oct 2024
When sweeping #canola for Diamond Back Moth #DBM larvae have 4 sets of prolegs and 3 sets of legs.
Not to be confused with the good guys, #hoverfly maggots that are predators.
#IntegratedPestManagement @GRDCSouth
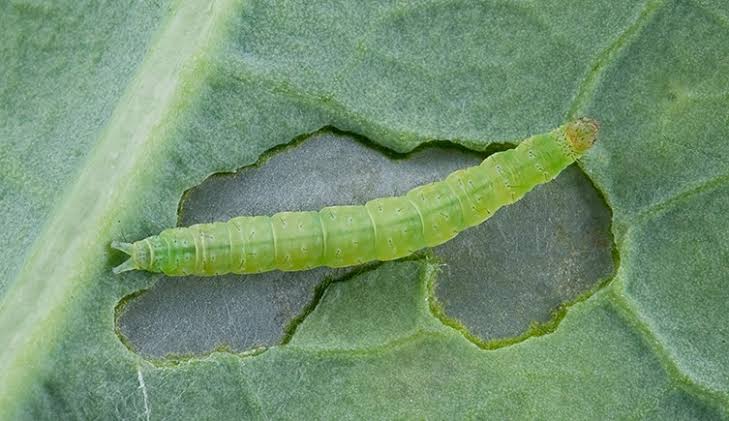
ALT Diamond back moth
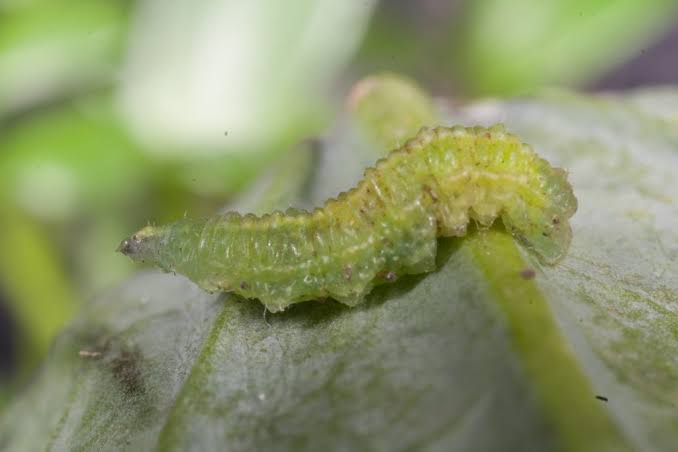
ALT Hoverfly maggot
1
4
22
2,253
Anthony Pfitzner retweeted

9 Oct 2024
We're looking to push the limits of water productivity & cereal yield potential in the low and medium-rainfall zones. Our aim is to help grain growers in these regions achieve new yield frontiers.
👉 bit.ly/47ZpAwC
@AgCommunicators @CSIRO @kentonp_ag @CourtneyPeirce1
3
19
1,627
Anthony Pfitzner retweeted

4 Oct 2024
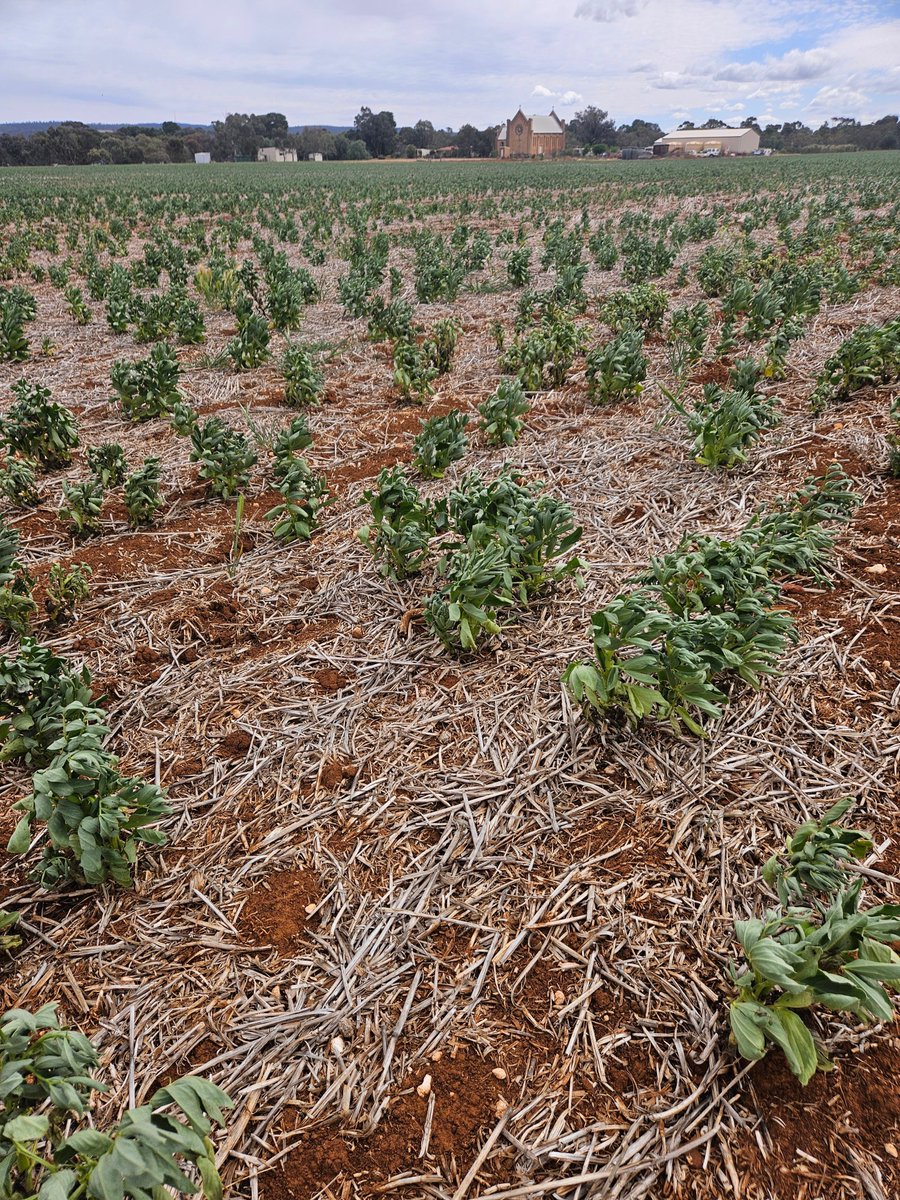
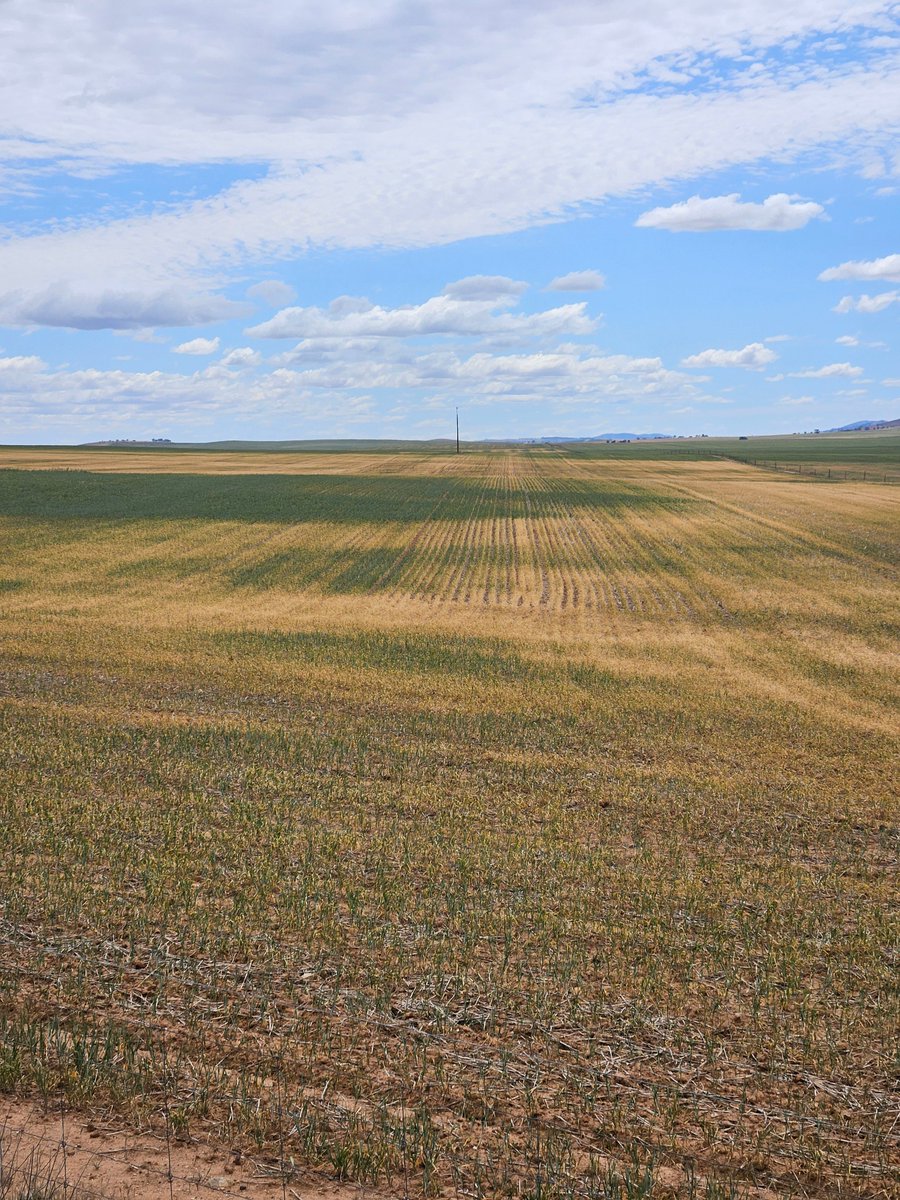
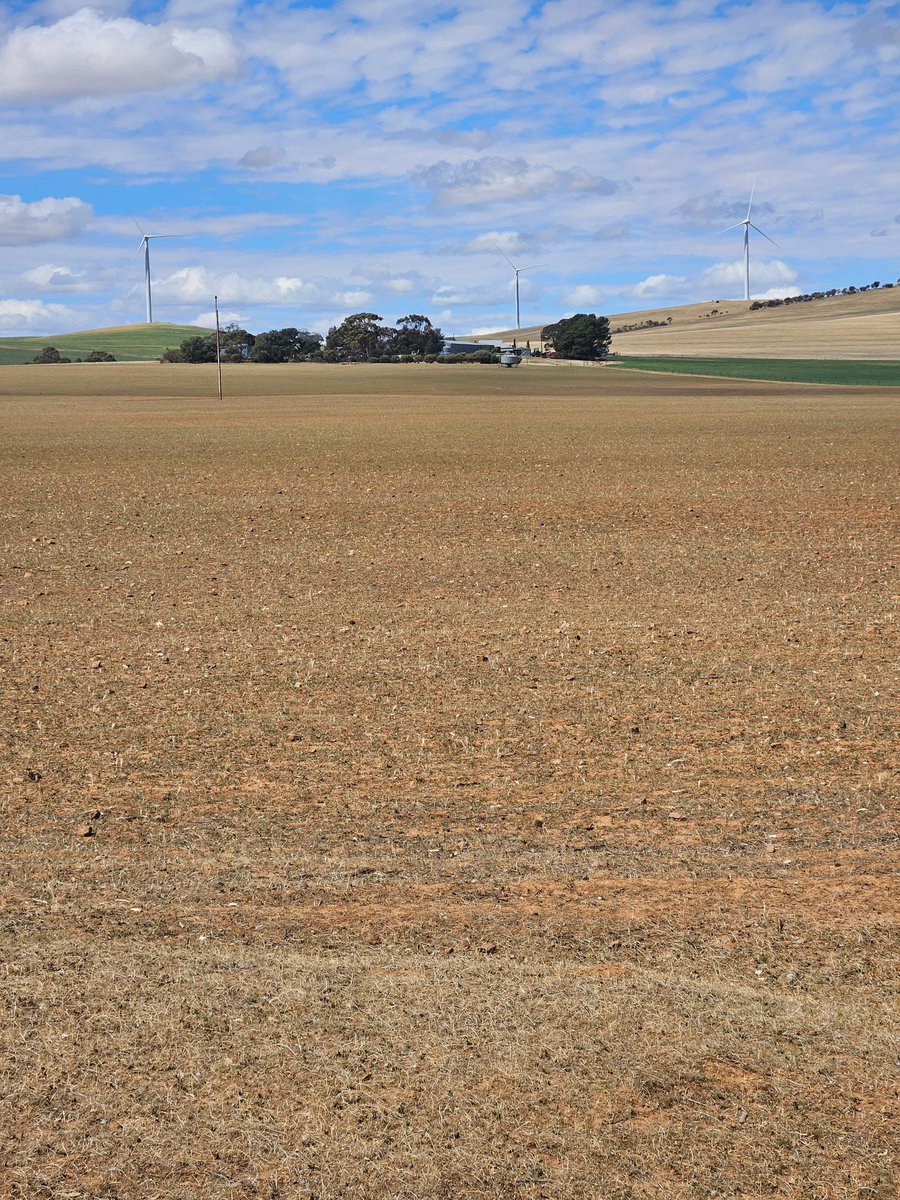
Been a month since I was thru the Upper North of SA, some of the driest cropping areas. I post these photos so others are aware of the plight of those who won't get a harvest this year.
Faba beans around Laura, 500mm Ave annual region, 30cm high at best.
Wheat near Caltowie, frost hasn't been as severe here as other spots in AUS, but the <100mm since Feb means they've just died.
Pasture paddock are done at Jamestown; the de-stocking all the way from Ceduna, across the Nth Eyre Pen and thru the Upper North is quite startling. Saw 2 flocks of sheep from Kimba > Ceduna last week.
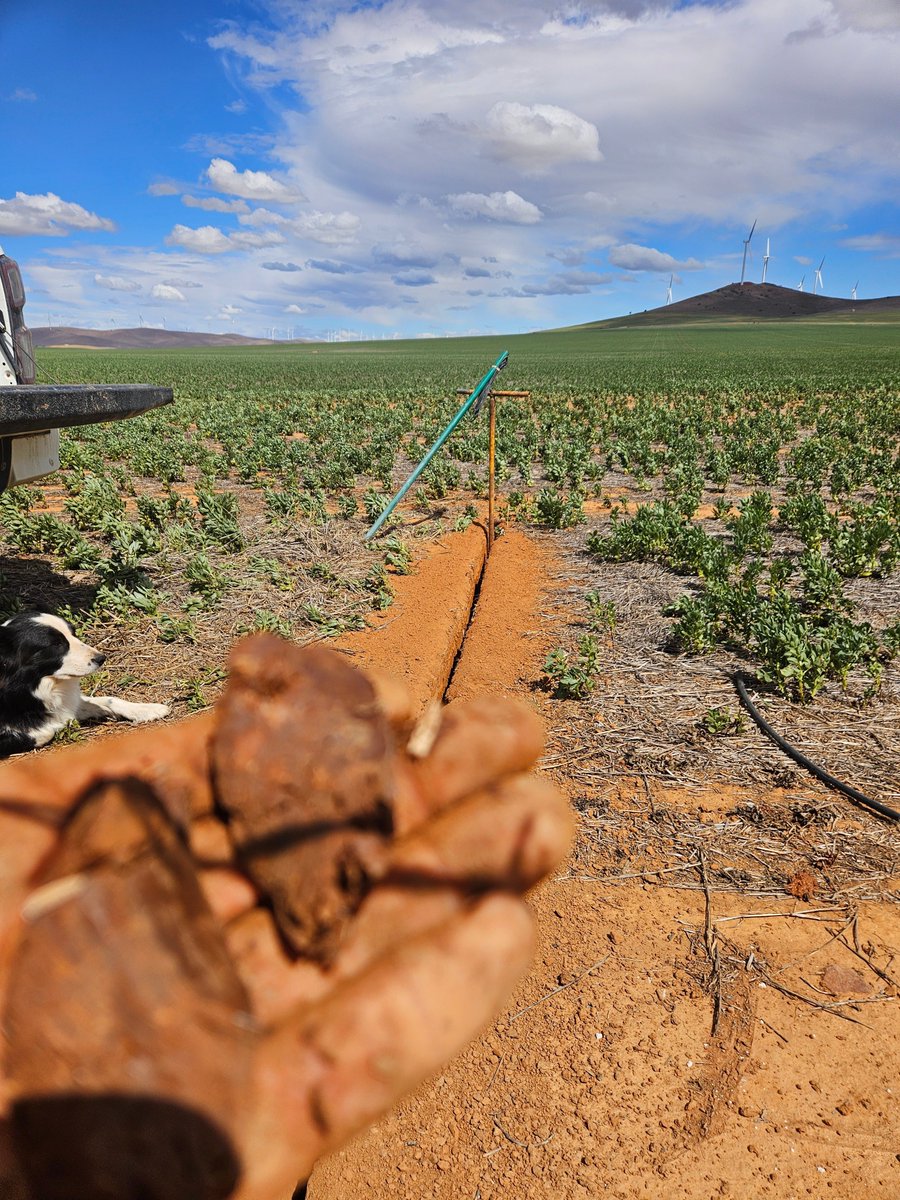
Did sneak in 4x @EnviroProProbes Soil Moisture Probes today. This one is in faba's, top 50cm is bone dry, under that there is good moisture but the roots couldn't access it this year due minimal infiltration of growing season rain. @scootersfarm @lukeforestview with a strippers/disc system can conserve moisture as good as anyone around, so not unsurprising to see this moisture at depth......will get it next year!
6
15
94
11,047
Anthony Pfitzner retweeted

6 Sep 2024
Proud @NSWFarmers member Gerard Glover is supporting the #NationalAgRally next week. Can't get there? Sign here: nff.org.au/national-farmer-r…
7
22
68
4,609
Anthony Pfitzner retweeted

31 Aug 2024
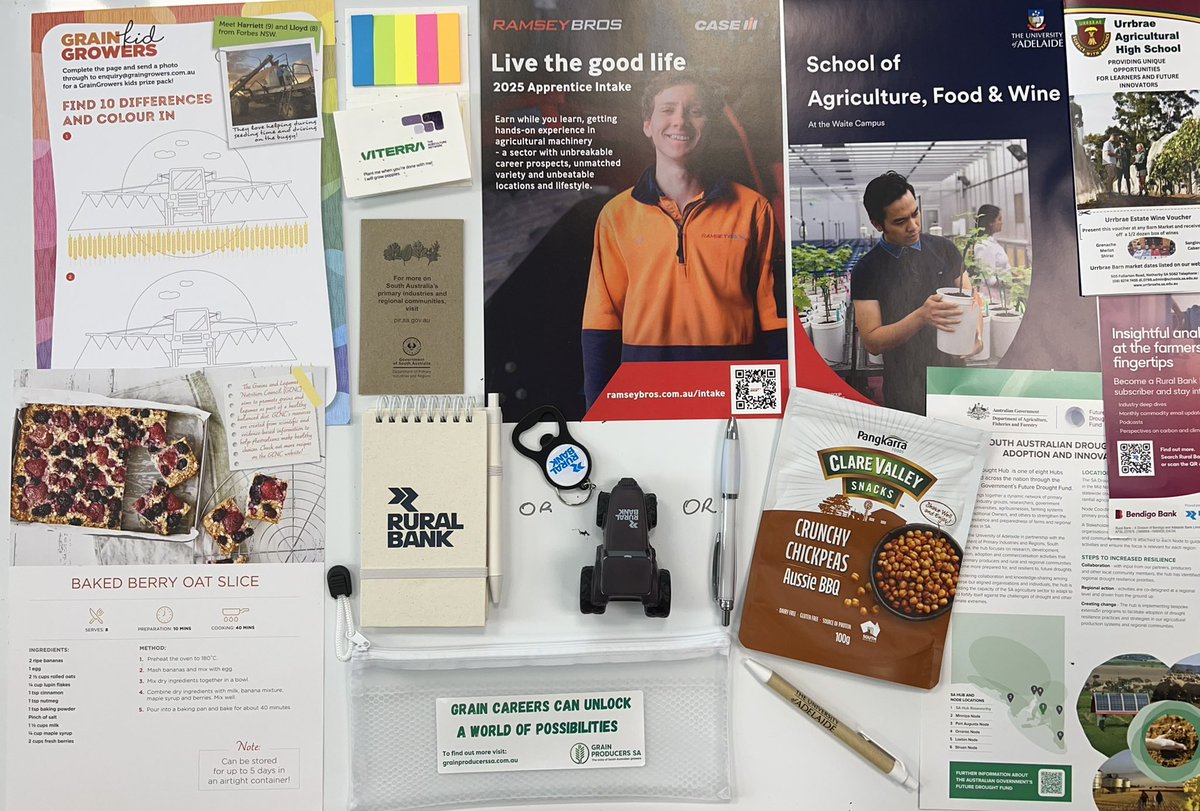
Hundreds of households are taking home career info on grain tonight (not to mention @Pangkarra’s yummy chickpea snack) from the Show through GPSA’s Great Grain Showbag. The only free showbag at the @adelaideshow this year! Thanks to our supporters.
Here’s what you get:
4
16
2,266
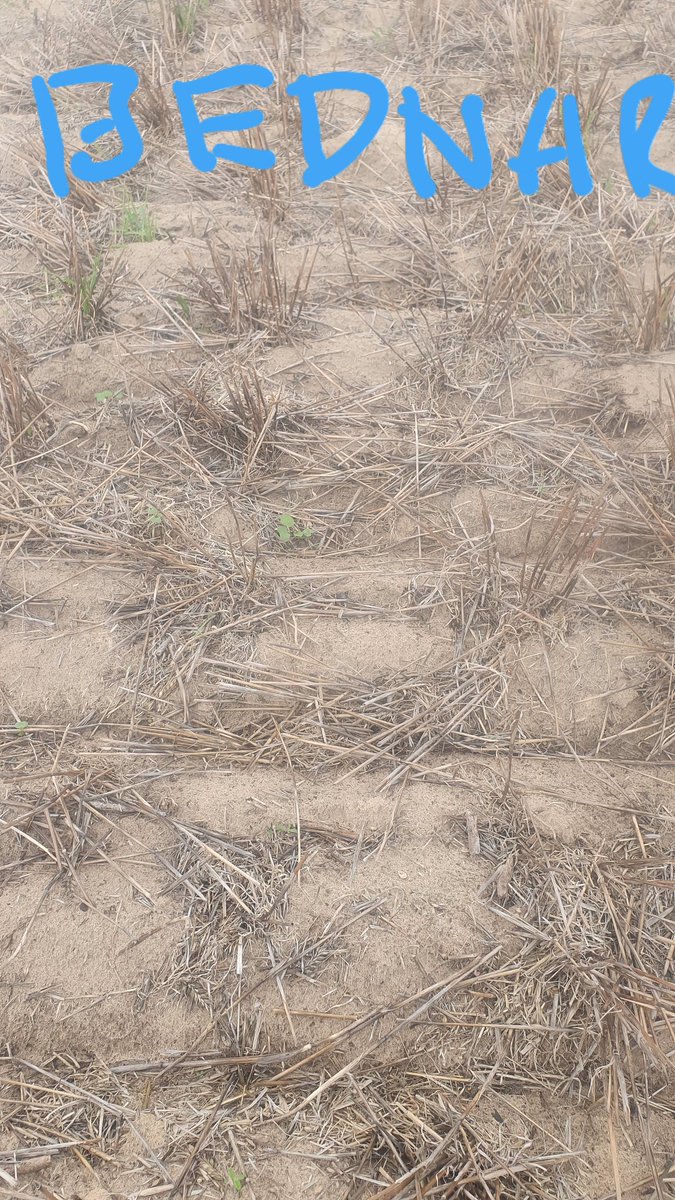
30 Aug 2024
Not great, fair patch in SA like this
30 Aug 2024

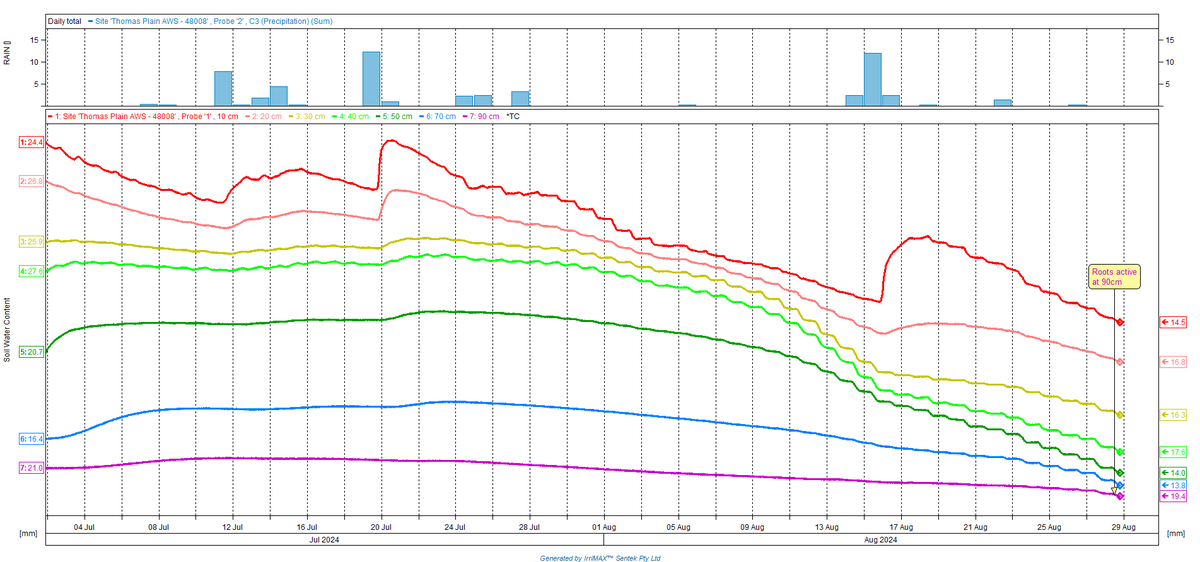
Afew soil moisture probe graphs explain the current state of play in SA.
1. Stacked graph, wheat roots active at 90cm, Paskeville.
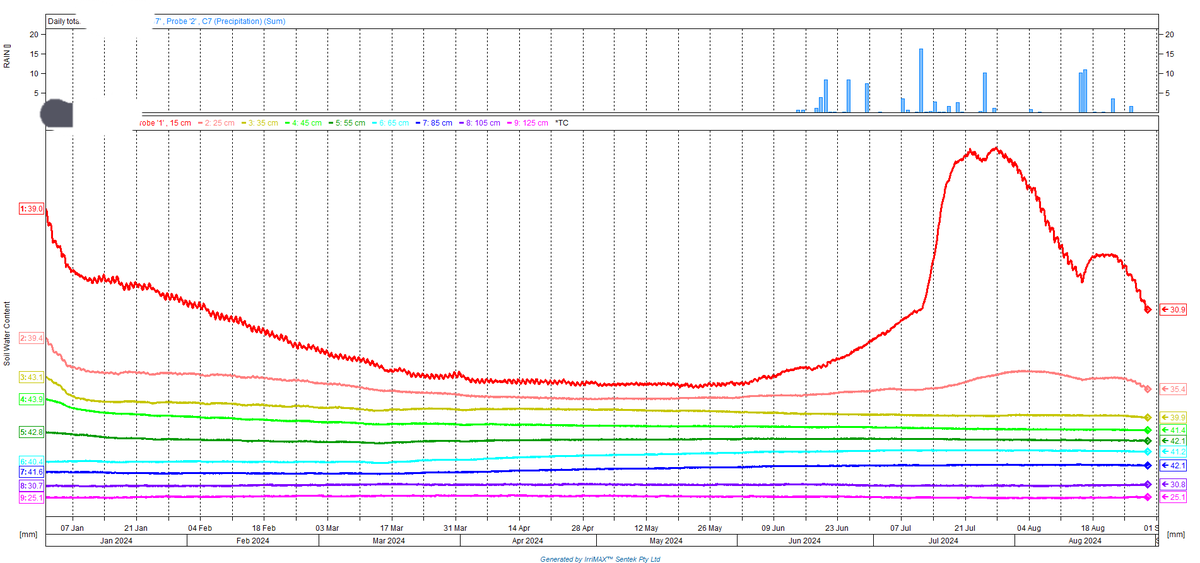
2. Summed graph, same site with previous 2 yrs in Mid & Top panel, close to hitting the 'Driest Ever' bottom.
3. Stacked graph, only had infiltration to 20cm for the entire year, wheat really going backwards in the Mid & Upper North.
4. 10cm Ave week soil Temp, bottom panel this year, top panel same time last yr. 2°C warmer this yr!


1
9
1,152
15 Aug 2024
As we come into bird nest season thought I'd share this as a cautionary note
We removed the battery cover to get access to this point, otherwise you wouldn't have even seen this.
Have shared with mechanics and people higher up in CNH
Case Optum but the T7HD is same
4
5
27
5,156
Anthony Pfitzner retweeted

WORKSHOP: Livestock strategies for the next 100 days.
Wed, 31 July 2024, 2pm - 6pm (followed by dinner) at the Saints Clubhouse, Bruce Street, Eudunda. Register now! More info below or register at👉buff.ly/3yiIXDo
22 Jul 2024

Register for the upcoming workshop in Eudunda on strategies to tackle this challenging season. Hear from top experts:
📅 Wed, 31 July 2024
🕑 2pm - 6pm (followed by dinner)
💲 FREE
📍 Saints Clubhouse, Bruce Street, Eudunda
📅 RSVP 29 July
🔗 Register: buff.ly/3yiIXDo

1
4
630
Anthony Pfitzner retweeted

7 Jun 2024
The Albanese Govt's sheep export ban ignores science, economics, and community impacts for ideology. Regional towns depend on the sheep industry to survive. Stand with us against this ban!
Sign the petition: buff.ly/4aOtHLR
#keepthesheep
2
10
732
Anthony Pfitzner retweeted

31 May 2024
A massive convoy of trucks and utes has descended on the city as farmers protest the end of live sheep exports.
More than 3,000 making the trip from right around WA, worried the ban will wipe out regional communities. @SarahSmith9_ #9News
34
104
411
46,834
Anthony Pfitzner retweeted

11 May 2024
Absolutely love getting all the terrible comments. Please continue so I can show everyone how hateful animal activists are. I only wish you were brave enough to put your real name & face to the disgusting things you say.
11 May 2024

Support Aussie farmers & share any stories or reels opposing the government policy to implement legislation to ban sheep live exports.
Good hashtags to search are #KeepTheSheep #ausag #agchatoz
Please help spread the word.
26
37
236
14,417