
A complete charting SDK and agentic API for building editable, story-driven data experiences inside your product.
Joined November 2018
- Tweets 738
- Following 299
- Followers 3,383
- Likes 802
250 Photos and videos


Graphy retweeted

May 13
1
2
156
Graphy retweeted
It’s a hackathon week at @GraphyHQ🤘 lots of cool ideas, great vibes, and big ambitions.


1
5
230

Graphy retweeted

Mar 9
Personal news: I just joined @GraphyHQ as a Software Engineer! 🎉 Super excited to get to work with the team.
3
2
21
810

Graphy retweeted

28 Oct 2025
Making Pretty graphs by @GraphyHQ
Here's a great article by them.
graphy.app/blog/how-to-make-…
1
2
6
425

Graphy retweeted

18 Sep 2025
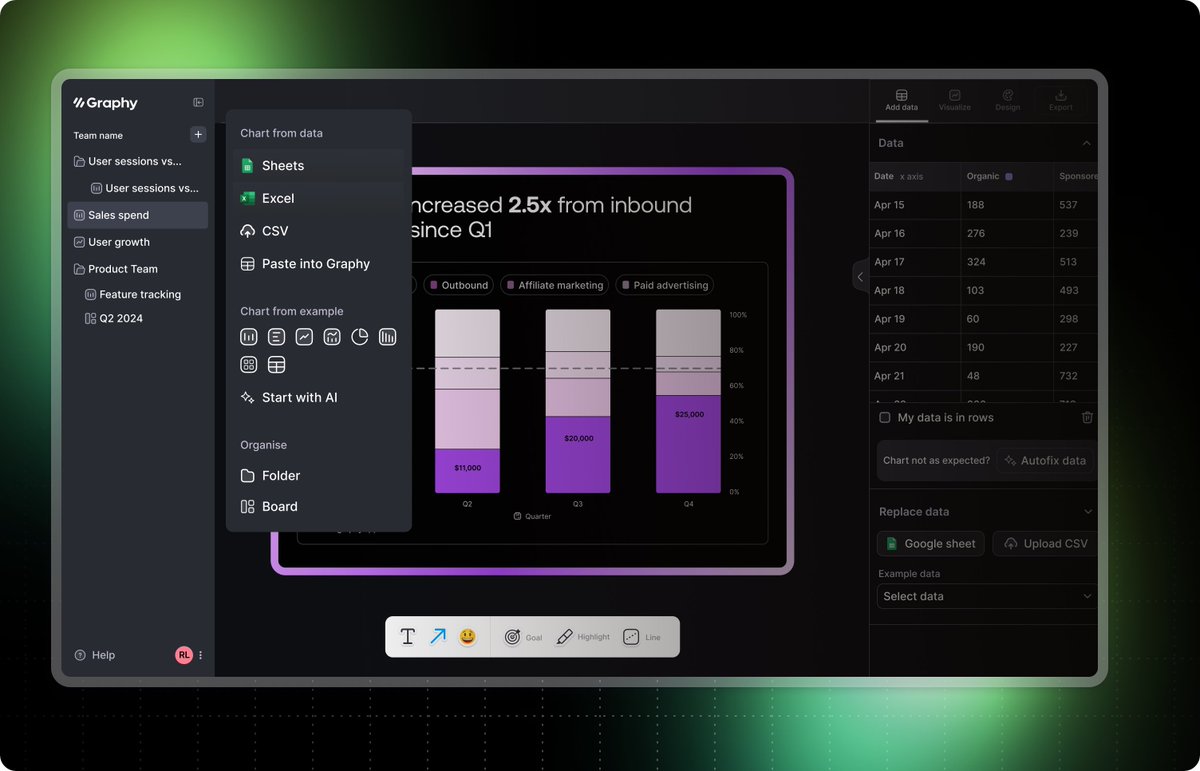
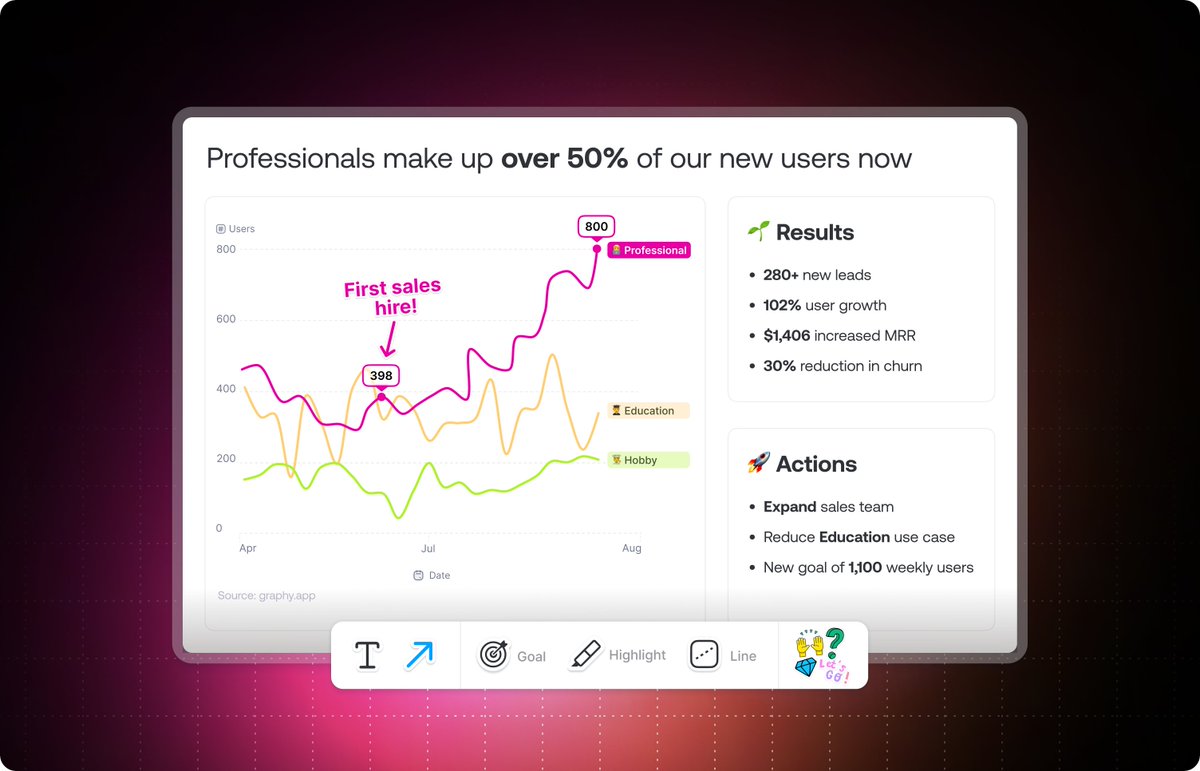
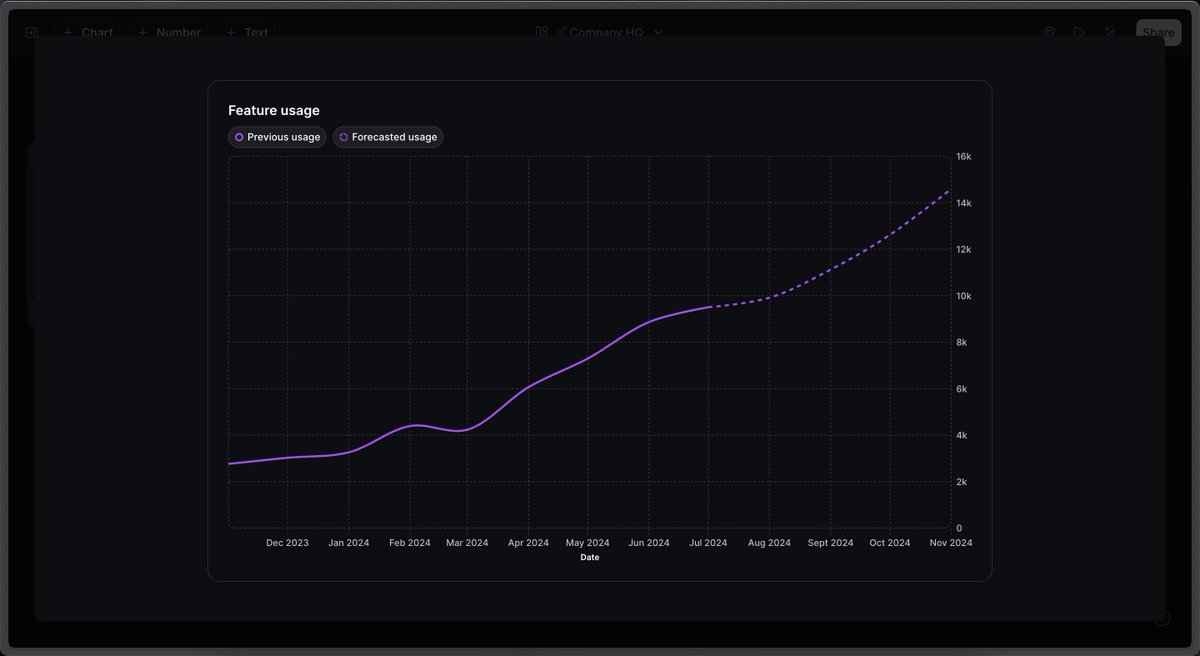
Most data viz tools force you to choose between data depth or beautiful design.
With Graphy you get both, powerful analysis with beautiful output.
This graph came from a massive dataset, a prompt, and a few quick design tweaks, all inside the tool.

1
6
433
Graphy retweeted
7 Aug 2025
We made it into the @ProductHunt newsletter today
They called it “RIP spreadsheets” and I love it 😆
1
1
11
547
We’re live on Product Hunt today and would love your support producthunt.com/products/gra…
1
1
4
278
Graphy retweeted

7 Aug 2025
Our favorite data viz tool @GraphyHQ just dropped 3.0 on Product Hunt!
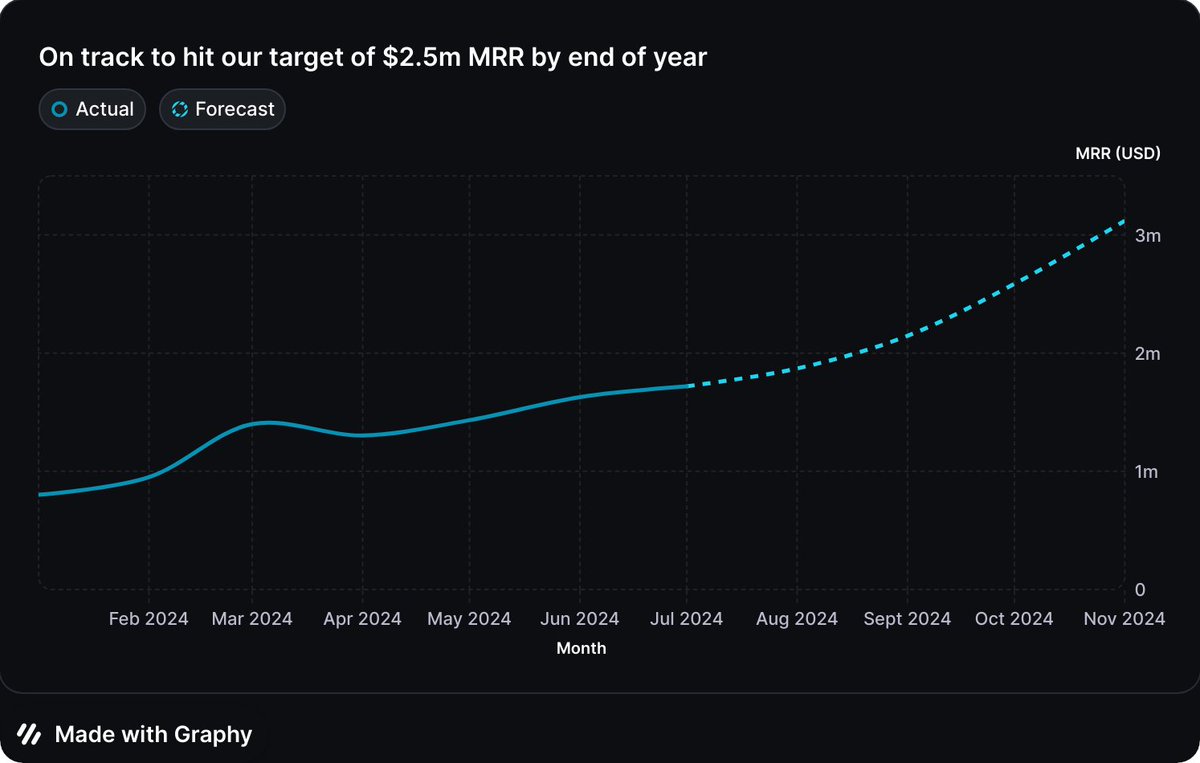
Auto-generated charts that don’t look like Excel — and embed beautifully in Chronicle decks.
Stunning data deserves a stunning presentation.
2
2
9
805
Graphy retweeted

19 Jun 2025
If your reports are data heavy then Chronicle is definitely for you. I understand that most AI tools aren't because people think presentations are just pictures and text. That is exactly how we are built differently.
It may not feel fully equipped for this, but the foundation is there. eg this page is made in @Chronicle_HQ with an interactive chart from @GraphyHQ
You can use Graphy, Airtable, Google Sheets, Tableau, Looker, D3, PowerBI and many more.
1
3
6
1,325