
Joined April 2024
- Tweets 7,869
- Following 323
- Followers 40,400
- Likes 2,912
3,119 Photos and videos


TrendForce just revealed the CoPoS supply chain
Group Up $6664.TWO looks very interesting
$700M market cap
20x forward P/E
Net cash
Strong margins
It supplies film lamination, baking, peeling, and coating equipment for $TSM’s panel-level packaging and glass substrate flows


2
7
54
9,965
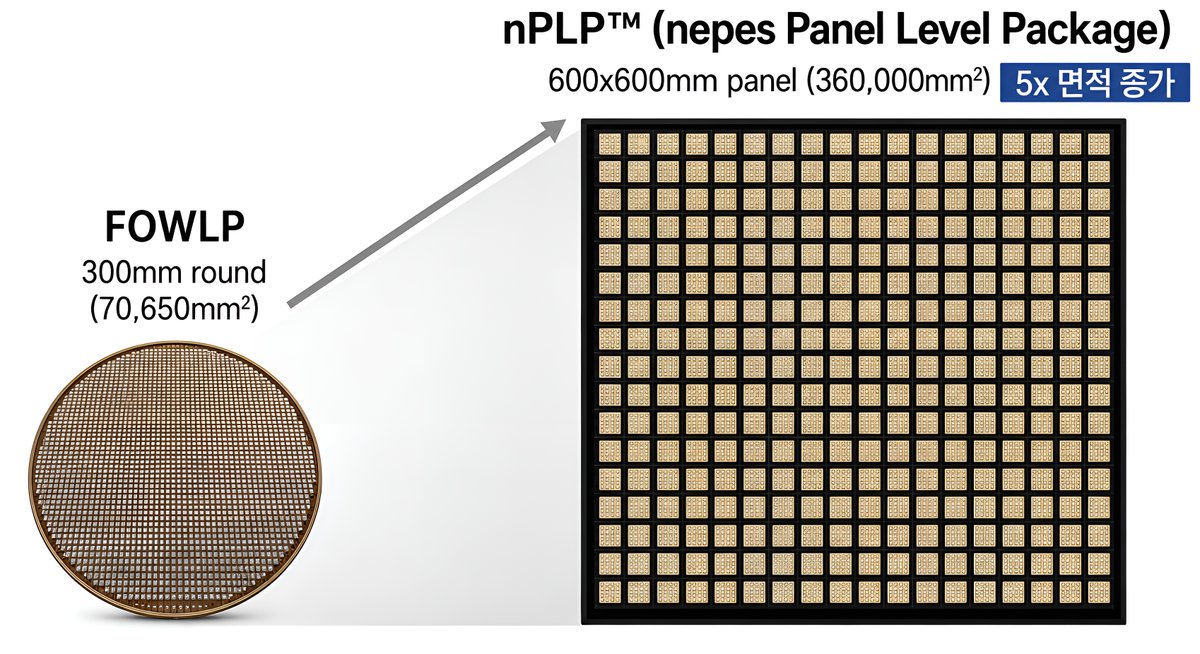
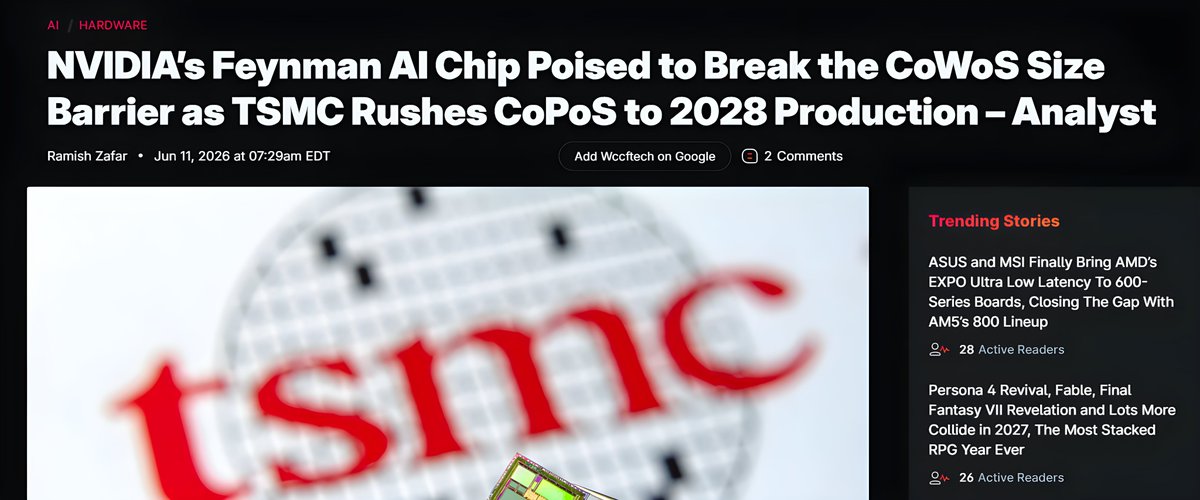
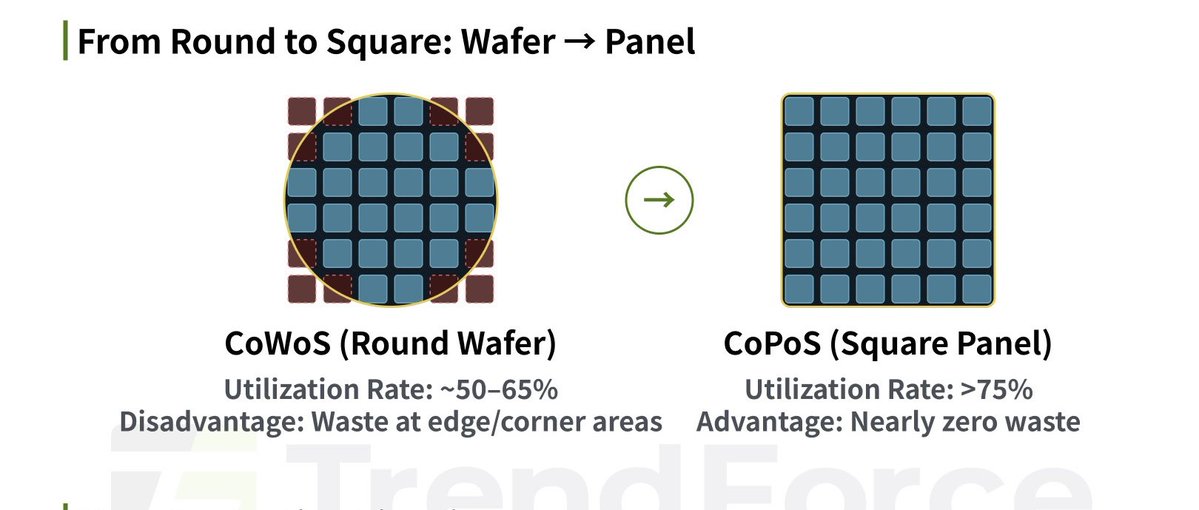
Panel-level packaging isn’t just about shape
The panels are also much larger than round wafers, so you get both less edge waste and more total package area per process step
PLP is already used in niche applications, but because it is a more complex process, panel-level packaging is still not widespread across the semiconductor supply chain
That will change soon, and it could become a true packaging revolution
Hence why you should start positioning for it
2
14
79
13,794
Ajinomoto $2802 says ABF is not currently in shortage
Ajinomoto’s CEO says AI demand is putting pressure on ABF supply, but the company expects to meet demand through 2030. Beyond that, visibility is less clear
The CEO says Ajinomoto has not raised ABF prices just because it has monopoly-like power, despite investor pressure. He argues that aggressive pricing could damage customer relationships and encourage customers to look for alternatives
However, he leaves the door open to higher prices if substrates keep becoming more complex and higher value-added. In other words, prices may rise structurally, but not through opportunistic price gouging
Ajinomoto is already preparing for longer-term demand by securing land for new facilities in central Japan. New production is expected to begin in 2032, though the timeline could be accelerated if customers need it
In other news, glass substrates are unlikely to replace ABF soon. Even if glass packaging advances by 2028, analysts expect it to be used together with ABF, not instead of it
3
4
46
5,165
Nobody guessed it
I’ll have to just say it

14
60
31,672

Jun 13
CPU shortages to ease in H2, according to MSI’s chairman
MSI says GPU chip supply has fallen around 30% because $NVDA cannot fully meet demand due to limited memory availability
PC demand is weakening because of higher prices. MSI says its DIY segment is down around 20%, while the broader PC market is down 10–20%
$AMD and Intel are reportedly increasing their priority on PC CPUs again. AMD supply should improve in Q2, while Intel supply should improve in Q3
7
14
158
27,319
Jun 13
There is one key $SPCX supplier trading at 13x 2026 EPS, and nobody is talking about it
27
4
110
80,303
Jun 13
Engrave this supply chain in your brain if you want to outperform in 2027
As an investor, it’s your duty to learn about glass substrates and PLP
Jun 12
Understanding the Panel-Level Packaging and Glass Substrate Ecosystem
3
9
75
12,285
Jun 13
This US action will push more countries toward sovereign AI
Some stocks helping countries build that:
$NBIS: leading sovereign AI partner in Israel and the UK, so far
$PENG: system enabler for sovereign AI data centers
$SKM: will become Korea’s main sovereign AI neocloud
$035420.KS / NAVER: direct Korea sovereign AI play. Will start with 55 MW and scale toward gigawatt-level sovereign AI infrastructure
$OVH.PA: Europe’s purest listed sovereign cloud
The whole ecosystem will benefit anyway, as this push will create many redundancies that are unnecessary from an efficiency perspective, but bullish for supply-chain stocks because they push demand even higher
What I mean is that not every country occupies a bottleneck position in the AI supply chain the way Korea or Taiwan does.
And the same applies to Korea and Taiwan as well. The very fact that there is now a visible possibility that the U.S. could cut off access to powerful LLMs for Korea creates uncertainty in itself.
Because of this, every country will rush into sovereign AI.
6
17
120
15,427
Jun 12
Understanding the Panel-Level Packaging and Glass Substrate Ecosystem
6
22
113
20,340
Jun 12
Jun 12
If you like $TE, you’ll love $TOYO
Same theme: U.S. solar manufacturing domestic content tariff reshoring
Different valuation
Market value
→ $TE: ~$2.4B market cap / $2.7B EV post-raise
→ $TOYO: $510M market cap / ~$500M EV
So $TE trades at roughly 4.6x TOYO’s market cap and around 5x TOYO’s EV
2026 production
→ $TE: 3.1–4.2GW module production guide from G1_Dallas
→ $TOYO: 5.5–5.8GW solar cell shipments 1.0–1.3GW module shipments
Q1 financials
→ $TE: $178M revenue / 16.4% gross margin / $9.1M adjusted EBITDA / -$72.9M operating cash flow
→ $TOYO: $143M revenue / 33.5% gross margin / $48.3M adjusted EBITDA / $33.4M operating cash flow
$TE has more slightly more revenue
$TOYO has better margins, EBITDA conversion, profitability, and cash generation
Expansion plans
→ $TE: 5GW G2_Austin TOPCon cell plant, with first 2.1GW phase targeted for initial production in Q4 2026
→ $TOYO: 1.5GW Houston HJT cell plant, co-located with its U.S. module facility
$TE is the larger U.S. platform
$TOYO is the cheaper earnings/capacity play
→ Acquiring KORE Power for about $32M EV makes $TE more diversified across solar BESS data center power infrastructure, but it does not erase the valuation gap
Balance sheet
→ $TE: better working capital, but heavier debt/preferred/convertible structure and still funding G2
→ $TOYO: tighter liquidity, negative working capital, and Houston funding risk
So the apples-to-apples conclusion is:
→ $TE = bigger, more institutional U.S. policy platform
→ $TOYO = smaller, already profitable, and trading at a fraction of the valuation
8
2
41
14,594
Jun 12
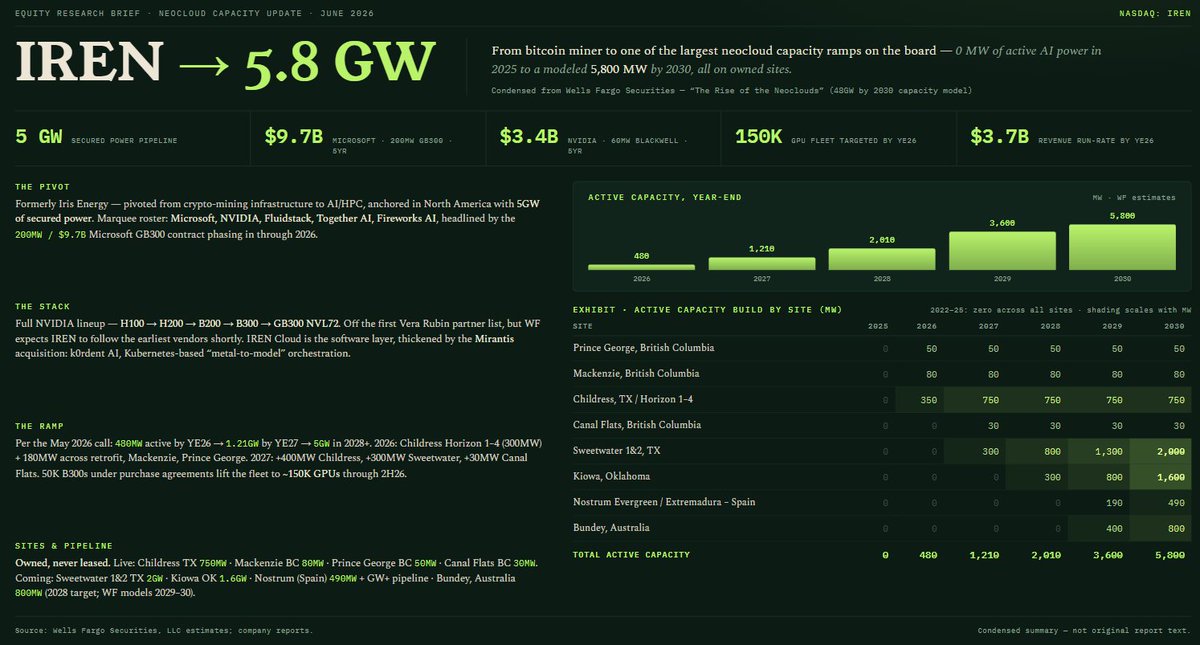
Wells Fargo models $IREN reaching 5.8GW by 2030
The company has a 5GW secured power pipeline, anchored by:
- > $9.7B / 200MW Microsoft GB300 contract, phasing in through 2026
- > $3.4B NVIDIA contract, adding another 60MW of AI cloud capacity from early 2027
- > $3.7B targeted ARR by YE26, rising to $4.4B after the Blackwell deployment
The back half is driven by Sweetwater, Kiowa, Spain, and Australia
Notably, Wells Fargo still looks conservative versus company guidance, modeling 2GW in 2028 versus the company’s 5GW target


8
17
167
30,204
Jun 12
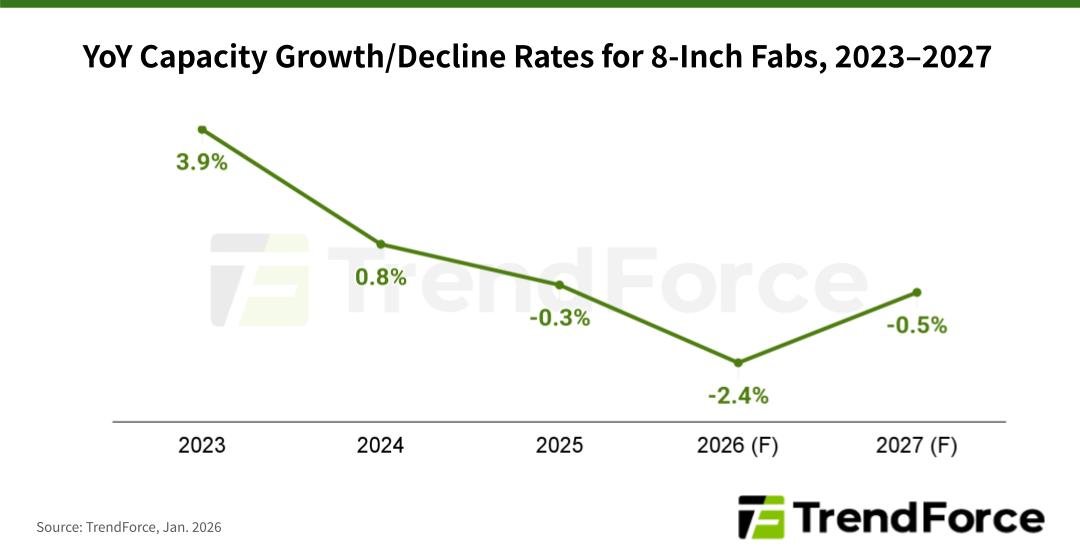
Bullish for:
$000990.KS — DB HiTek
$6770.TW — PSMC
$TSEM — Tower Semiconductor
Jun 12

8 inch fabs capacity has been declining. But demand is increasing e.g. PMICs, GaN/SiC and other power chips used in Data Centers. Result is overloaded fabs and increased prices.
3
4
28
7,950
Jun 12
If you like $TE, you’ll love $TOYO
Same theme: U.S. solar manufacturing domestic content tariff reshoring
Different valuation
Market value
→ $TE: ~$2.4B market cap / $2.7B EV post-raise
→ $TOYO: $510M market cap / ~$500M EV
So $TE trades at roughly 4.6x TOYO’s market cap and around 5x TOYO’s EV
2026 production
→ $TE: 3.1–4.2GW module production guide from G1_Dallas
→ $TOYO: 5.5–5.8GW solar cell shipments 1.0–1.3GW module shipments
Q1 financials
→ $TE: $178M revenue / 16.4% gross margin / $9.1M adjusted EBITDA / -$72.9M operating cash flow
→ $TOYO: $143M revenue / 33.5% gross margin / $48.3M adjusted EBITDA / $33.4M operating cash flow
$TE has more slightly more revenue
$TOYO has better margins, EBITDA conversion, profitability, and cash generation
Expansion plans
→ $TE: 5GW G2_Austin TOPCon cell plant, with first 2.1GW phase targeted for initial production in Q4 2026
→ $TOYO: 1.5GW Houston HJT cell plant, co-located with its U.S. module facility
$TE is the larger U.S. platform
$TOYO is the cheaper earnings/capacity play
→ Acquiring KORE Power for about $32M EV makes $TE more diversified across solar BESS data center power infrastructure, but it does not erase the valuation gap
Balance sheet
→ $TE: better working capital, but heavier debt/preferred/convertible structure and still funding G2
→ $TOYO: tighter liquidity, negative working capital, and Houston funding risk
So the apples-to-apples conclusion is:
→ $TE = bigger, more institutional U.S. policy platform
→ $TOYO = smaller, already profitable, and trading at a fraction of the valuation
8
7
69
22,359
Jun 11
2026 was the year of photonics
2027 will be the year of PLP and glass substrates
18
50
725
88,988
Jun 11
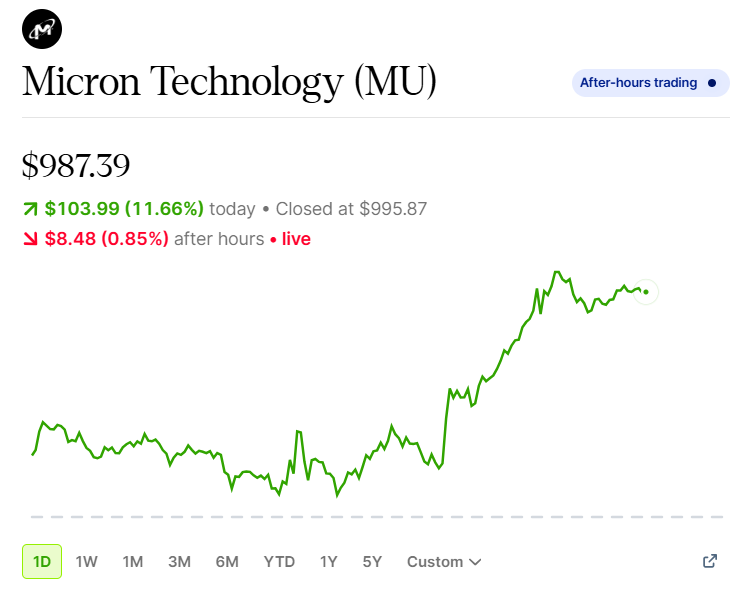
$MU flirting with $1,000 again. I love this company
Today: 11.66%
YTD: 215%
Best part is that memory could re-rate another 100% and still feel fairly valued
17
13
259
12,765
Jun 11
I was told today was going to be a bloodbath
Where are the dips I was promised?
Turns out being bearish simply sells more
8
28
3,819
Jun 11
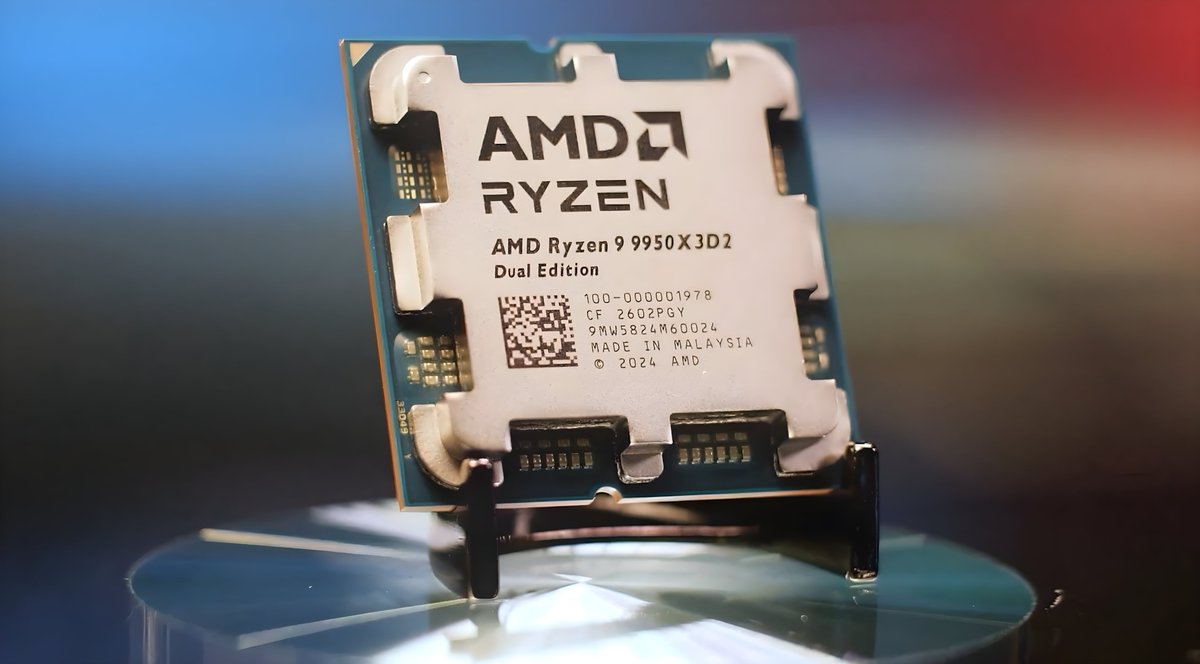
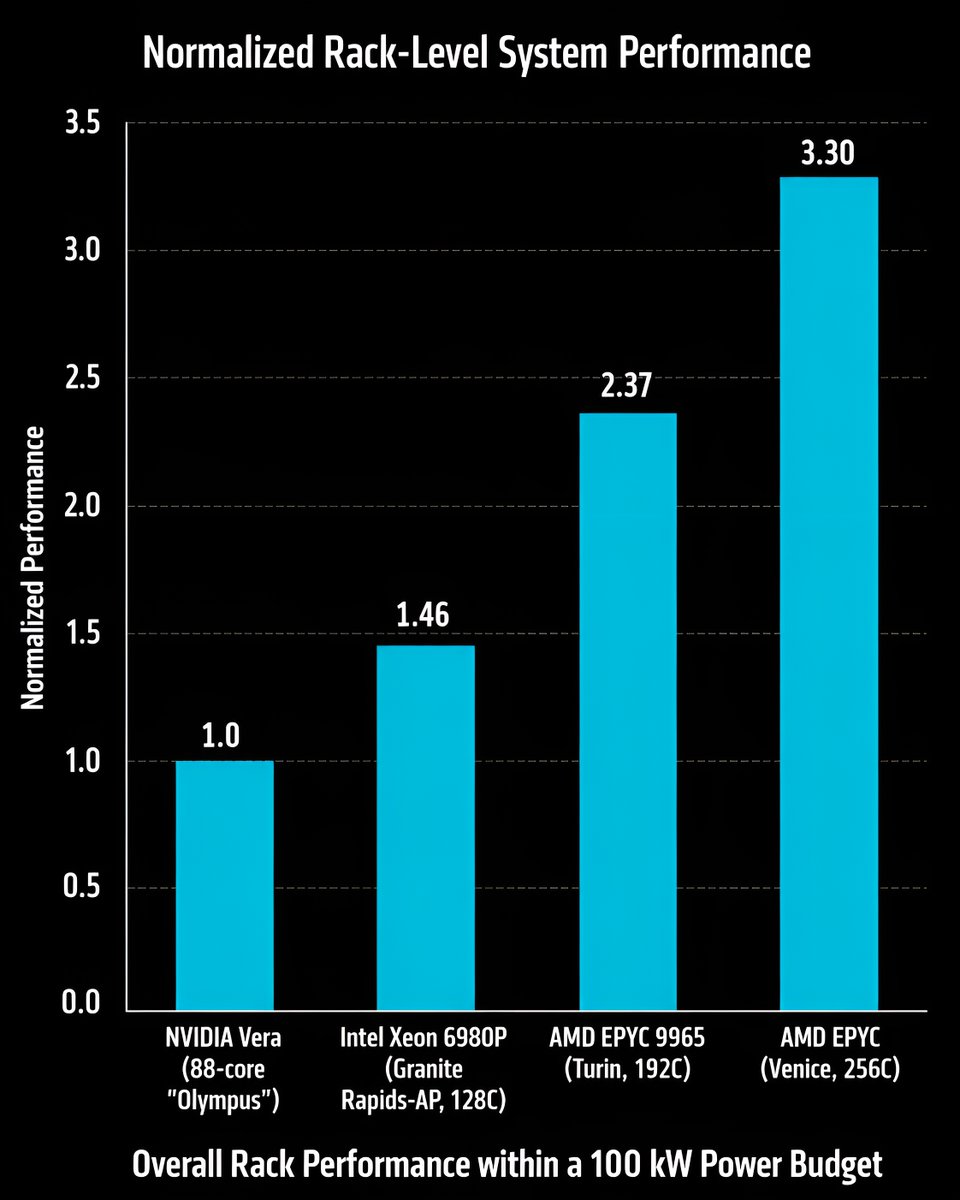
When you connect these two posts, the bull case for $AMD becomes clear
-> With the current approach (near/mid term), CPU demand will explode with Agentic AI
-> Vera is barely better than a 2024 $AMD CPU (based on $NVDA own benchmarks)
-> $AMD Venice seems to be considerably better than Vera
The picture here seems clear: as CPUs become almost as important as GPUs, AMD is a clear leader in the space
There’s also a possibility that AMD’s GPU performance gap with NVIDIA is smaller than NVIDIA’s CPU performance gap with AMD
Once you combine this with AMD improving its networking and software, primarily through collaboration with open source, clients, and other open-source standardization advocates, it may seem like the valuation gap between AMD and NVIDIA is still too large
Jun 11
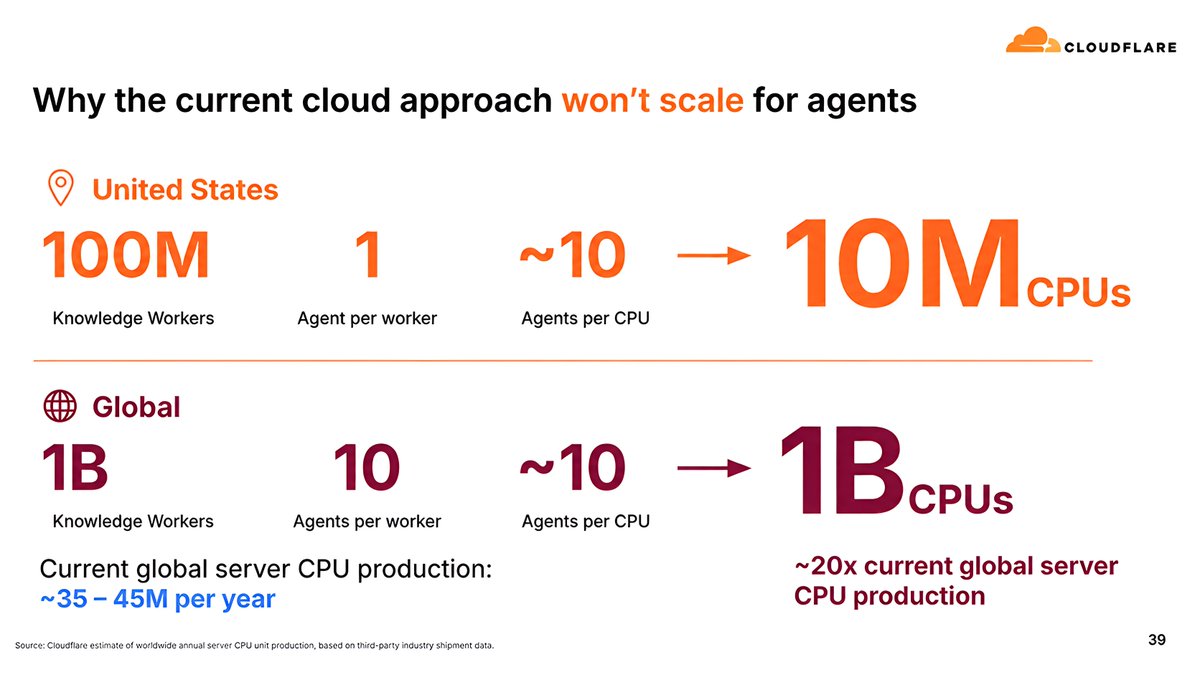
Cloudflare $NET believes CPU demand could 20x with AI agents
$AMD $INTC $ARM
The company argues that AI agents could create a massive CPU/server infrastructure problem if every worker runs multiple agents using today’s cloud model
The math:
US:
⏩ 100M knowledge workers × 1 agent each ÷ ~10 agents per CPU = 10M CPUs
Global:
⏩ 1B knowledge workers × 10 agents each ÷ ~10 agents per CPU = 1B CPUs
Cloudflare compares this to current global server CPU production of only ~35M–45M per year, implying the current approach could require ~20x current annual CPU production
$NET is pitching Agent Cloud as a solution
This is how it would work:
1. Dynamic Workers instead of full containers
Agents can be spun up on demand and put back into cold storage when idle, avoiding one heavy always-on container per agent
2. Durable Objects for state
Agents need memory/state for tasks, files, sessions, progress, and tool outputs. Durable Objects give each agent/app a stateful object with local SQLite-backed storage
3. Workflows for long-running agents
Agents may run for minutes, hours, or days while waiting for approvals, retries, external events, or scheduled steps. Dynamic Workflows allow these processes to hibernate between steps instead of constantly consuming compute
4. Project Think / Agents SDK
Project Think adds agent-specific primitives like durable execution, crash recovery, checkpointing, sub-agents, persistent sessions, and sandboxed code execution
5. Sandboxes only when full computers are needed
For coding agents or tasks requiring bash, git, file systems, browsers, or arbitrary binaries, Cloudflare still offers Sandbox containers. But the idea is to use them only when necessary, not as the default runtime for every agent
6
13
138
10,610