
Your #1 source for income ETF news, data, and distribution tracking | We track the ETFs that put money in your pocket every month
Joined April 2026
- Tweets 213
- Following 118
- Followers 2,743
- Likes 314
128 Photos and videos


Here is a breakdown of the Hartford Strategic Income ETF $HFSI you should know:
Actively managed multi-sector bond fund that allocates across fixed-income sectors (government, high yield, emerging markets, mortgages, bank loans) in pursuit of current income and long-term total return.
Launch: September 21, 2021
Expense Ratio: 0.49%
Total Assets: $830.4M
NAV: $35.19
Distribution Yield: 5.49%
30-Day SEC Yield: 5.94%
Yield to Worst: 6.90%
Distribution Frequency: Monthly
Portfolio Composition:
Emerging Market Debt 20%
US Government Debt 17%
High Yield Credit 14%
Mortgage Backed Securities 14%
Bank Loans 11%
Asset Backed Securities 11%
Other 11%
Commercial Mortgage Backed Securities 5%
Investment Grade Credit 3%
Top Holdings:
🥇 FNMA TBA 30 Year 5.5% Single Family Mortgage 5.26%
🥈 US Treasury 09/28 3.375% 2.74%
🥉 US Treasury 11/34 4.25% 2.64%
4. US Treasury 08/30 3.625% 2.47%
5. US Treasury 08/35 4.25% 2.06%
1,062 total holdings
Effective Duration: 5.39 years
Portfolio Turnover: 136%
3-Year Return: 8.58%🟢
1-Year Return: 8.41%🟢
YTD Return: 1.45%🟢
Morningstar Rating: 3-star (Multisector Bond category)
Sub-advised by Wellington Management
⚠️ Fixed income ETF. Bond price risk increases when interest rates rise. Credit quality ranges from AAA to CCC/below (24% in B-rated debt, 5% in CCC or lower).
1
5
334
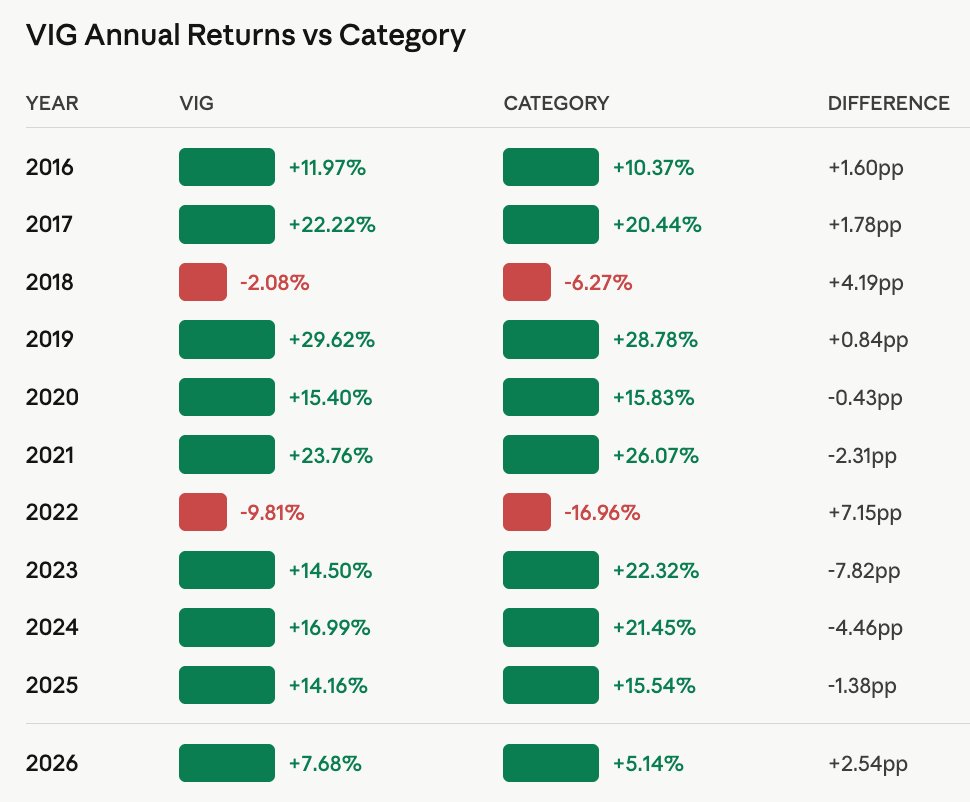
Here's how the Vanguard Dividend Appreciation ETF $VIG has performed each full year since 2016:
2016: 11.97%🟢
2017: 22.22%🟢
2018: -2.08%🔴
2019: 29.62%🟢
2020: 15.40%🟢
2021: 23.76%🟢
2022: -9.81%🔴
2023: 14.50%🟢
2024: 16.99%🟢
2025: 14.16%🟢
YTD 2026: 7.68%🟢
1
6
292
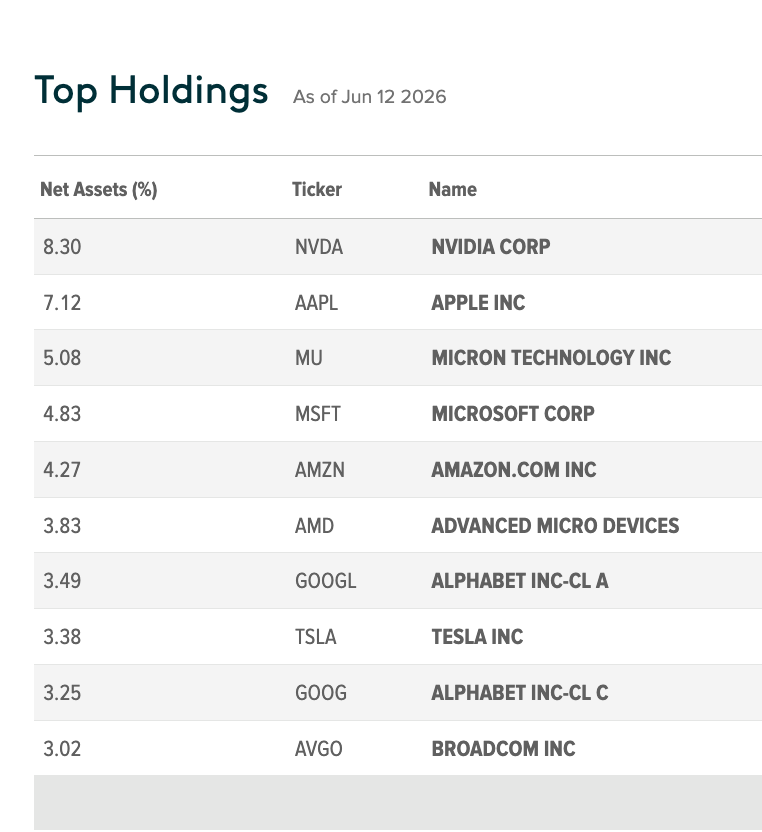
QYLD Top 10 Holdings
🥇 Nvidia $NVDA 8.30%
🥈 Apple $AAPL 7.12%
🥉 Micron Technology $MU 5.08%
4. Microsoft $MSFT 4.83%
5. Amazon $AMZN 4.27%
6. Advanced Micro Devices $AMD 3.83%
7. Alphabet $GOOGL 3.49%
8. Tesla $TSLA 3.38%
9. Alphabet $GOOG 3.25%
10. Broadcom $AVGO 3.02%
Top 10 total: 47.57%
Full fund: 102 holdings
4
1
8
461
Kurv Investment is a niche income ETF issuer with ~$480M in assets across a focused suite of options-based strategies
Technology Suite:
- Kurv Technology Titans Select ETF $KQQQ
- Kurv High Income ETF $KYLD
Precious Metals Suite:
- Kurv Gold Enhanced Income ETF $KGLD
- Kurv Silver Enhanced Income ETF $KSLV
- Kurv Copper & Mining Enhanced Income ETF $KCOP
Single-Stock Yield Premium Strategy:
- Kurv Yield Premium Strategy Amazon ETF $AMZP
- Kurv Yield Premium Strategy Apple ETF $AAPY
- Kurv Yield Premium Strategy Google ETF $GOOP
- Kurv Yield Premium Strategy Microsoft ETF $MSFY
- Kurv Yield Premium Strategy Netflix ETF $NFLP
- Kurv Yield Premium Strategy Tesla ETF $TSLP
Fixed Income:
- Kurv Enhanced Short Maturity ETF $LQID
- Kurv SpaceX Enhanced Income ETF $XSHP
Kurv's lineup splits three ways: broad tech exposure (KQQQ, KYLD), commodity-linked strategies (precious metals, copper), and single-stock options income on mega-cap names. Distribution rates range from 11.54% (Microsoft) to 26.67% (Silver). All monthly payouts except KYLD, which pays weekly.
3
19
1,033
Here is a breakdown of the iShares U.S. Large Cap Premium Income Active ETF $BALI you should know:
Actively managed large cap stock fund that uses covered calls and stock picking to deliver monthly income alongside growth participation in mega-cap tech.
Launch: September 26, 2023
Expense Ratio: 0.35%
Total Assets: $1.22B
NAV: $33.61
Distribution Rate: 7.75%
Distribution Frequency: Monthly
Top Holdings:
🥇Nvidia $NVDA 7.16%
🥈 Apple $AAPL 5.99%
🥉 Microsoft $MSFT 5.24%
4. Amazon $AMZN 3.29%
5. Alphabet $GOOGL 3.14%
Recent Distributions:
June 2026: $0.2160/share
May 2026: $0.2191/share
April 2026: $0.3461/share
1-Year Return: 16.95%🟢
YTD Return: 9.72%🟢
Morningstar Rating: Gold Medal
BALI is actively managed, which means the portfolio manager makes individual stock picks rather than tracking an index. The 7.75% yield comes from covered call writing on the underlying holdings. The fund holds 188 stocks, so while it's tech-heavy at the top (NVDA, AAPL, MSFT account for ~18% together), it has real diversification beneath the surface.
BlackRock's systematic team runs this one, and it's been around since late 2023. Expense ratio is 35 basis points, which is reasonable for an actively managed income strategy.
⚠️ Distributions are not guaranteed and may vary month to month. This does not represent total return.
3
1
11
487

Jun 13
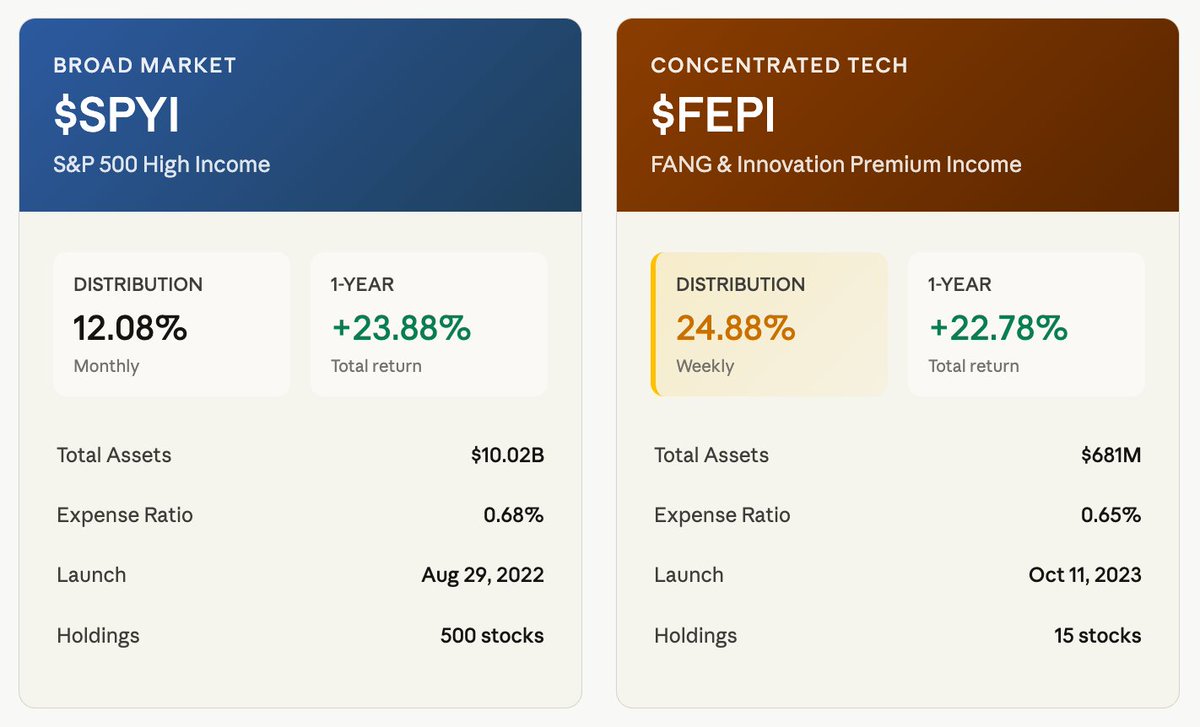
$SPYI vs $FEPI
Both track tech-heavy portfolios with covered call income, but one is broad and monthly while the other is concentrated and weekly
$SPYI NEOS S&P 500 High Income ETF
Launch: August 29, 2022
Total Assets: $10.02B
Distribution Rate: 12.08%
1-Year Return: 23.88%🟢
Expense Ratio: 0.68%
May 2026 Distribution: $0.5353/share
Top Holdings:
🥇 Nvidia $NVDA 7.83%
🥈 Apple $AAPL 6.80%
🥉 Microsoft $MSFT 4.56%
$FEPI REX FANG & Innovation Equity Premium Income ETF
Launch: October 11, 2023
Total Assets: $681M
Distribution Rate: 24.88%
1-Year Return: 22.78%🟢
Expense Ratio: 0.65%
June 9 2026 Distribution: $0.2133/share (weekly)
Top Holdings:
🥇 Micron Technology $MU 8.91%
🥈 Advanced Micro Devices $AMD 7.42%
🥉 Apple $AAPL 6.66%
SPYI covers the full S&P 500 with monthly payouts. FEPI concentrates on 15 big tech names with weekly distributions. SPYI has 15x more assets and lower yield. FEPI pays more often and more aggressively but on a smaller, riskier portfolio.
Disclosure: @NEOS and @REXShares are WOLF Financial partners. This is for informational purposes only, not financial advice.
2
2
17
1,082
Jun 12
Here's how the Vanguard International High Dividend Yield ETF $VYMI has performed each full year over the last 9 years:
2017: 22.34% 🟢
2018: -12.66% 🔴
2019: 18.46% 🟢
2020: -1.05% 🔴
2021: 15.41% 🟢
2022: -7.06% 🔴
2023: 17.08% 🟢
2024: 7.07% 🟢
2025: 38.06% 🟢
2026: 12.32% 🟢 (so far)
2
1
9
504
Jun 12
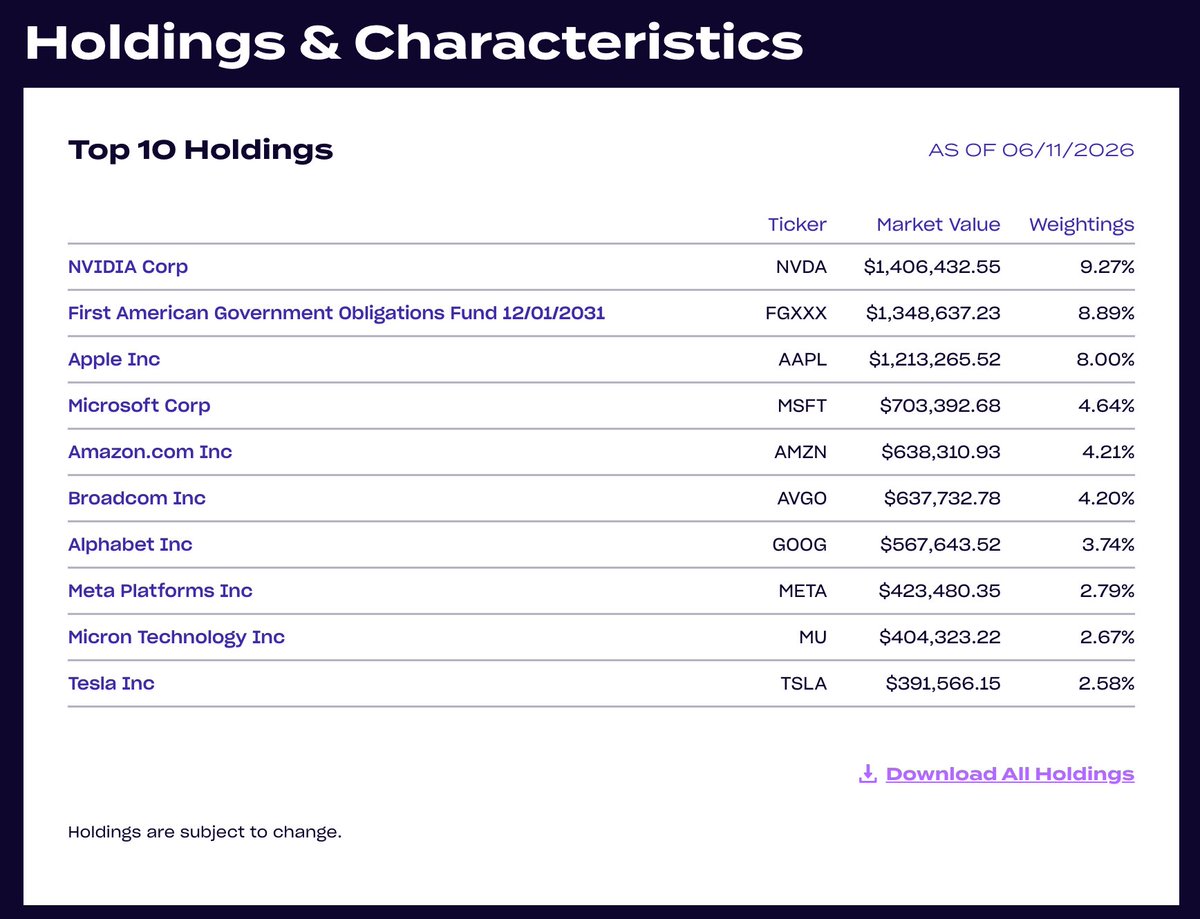
Here are the top holdings in the VistaShares Target 15™ S&P 100 Distribution ETF $SIOO:
- NVIDIA $NVDA 9.27% weighting
- Apple $AAPL 8.00%
- Microsoft $MSFT 4.64%
- Amazon $AMZN 4.21%
- Broadcom $AVGO 4.20%
- Google $GOOGL 3.74%
- Meta Platforms $META 2.79%
- Micron Technology $MU 2.67%
- Tesla $TSLA 2.58%
Disclosure: @VistaShares is a WOLF Financial Partner. This is for informational purposes only, not financial advice.
2
1
459
Jun 12
🚨 NEW ETF FILING
BlackRock has filed its fourth and likely final amendment for the iShares Bitcoin Premium Income ETF $BITA
The fund will hold spot Bitcoin and $IBIT shares, selling covered call options to generate monthly income. Launch expected imminently on Nasdaq.
Here is how $BITA compares to existing Bitcoin income ETFs:
iShares Bitcoin Premium Income ETF $BITA
Expense Ratio: 0.65%
Issuer: BlackRock
AUM: Pre-launch
NEOS Bitcoin High Income ETF $BTCI
Expense Ratio: 0.68%
Issuer: NEOS Investments
AUM: $1.07B
Roundhill Bitcoin Covered Call Strategy ETF $YBTC
Expense Ratio: 0.96%
Issuer: Roundhill
AUM: $126M
BlackRock enters the Bitcoin income space with the lowest expense ratio among major competitors.
Tickers and distributions TBA.
Disclosure: @NEOSInvestments is a WOLF Financial partner. This is for informational purposes only, not financial advice.
1
2
12
555
Jun 12
Here is a breakdown of the Roundhill Bitcoin Covered Call Strategy ETF $YBTC you should know:
The fund is an actively managed ETF that implements a synthetic covered call strategy on Bitcoin ETPs, selling weekly call options to generate income while maintaining exposure to Bitcoin price returns subject to a weekly upside cap.
Launch: January 18, 2024
Expense Ratio: 0.96%
Total Assets: $126.11M
NAV: $17.41
Distribution Rate: 35.90%
Distribution Frequency: Weekly
Since Inception Return: 8.98%🟢
1-Year Return: -14.16%🔴
Recent Distributions:
June 10, 2026: $0.1200/share
June 3, 2026: $0.1253/share
May 27, 2026: $0.1307/share
⚠️ Distributions are not guaranteed and may vary. 100% of recent distributions consist of estimated return of capital. This does not represent total return.
3
2
3
332
Jun 11
Here are the current top 10 largest holdings in YieldMax Target 12 Real Estate Option Income ETF $RNTY
🥇 Prologis $PLD 6.81%
🥈 Welltower $WELL 6.57%
🥉 Digital Realty Trust $DLR 5.59%
4. Simon Property Group $SPG 5.17%
5. Equinix $EQIX 4.71%
6. St Joe $JOE 4.20%
7. Texas Pacific Land $TPL 4.20%
8. Iron Mountain $IRM 4.12%
9. Public Storage $PSA 4.00%
10. Realty Income $O 3.98%
Disclosure: @YieldMax is a WOLF Financial partner. This is for informational purposes only, not financial advice.
2
1
20
713
Jun 11
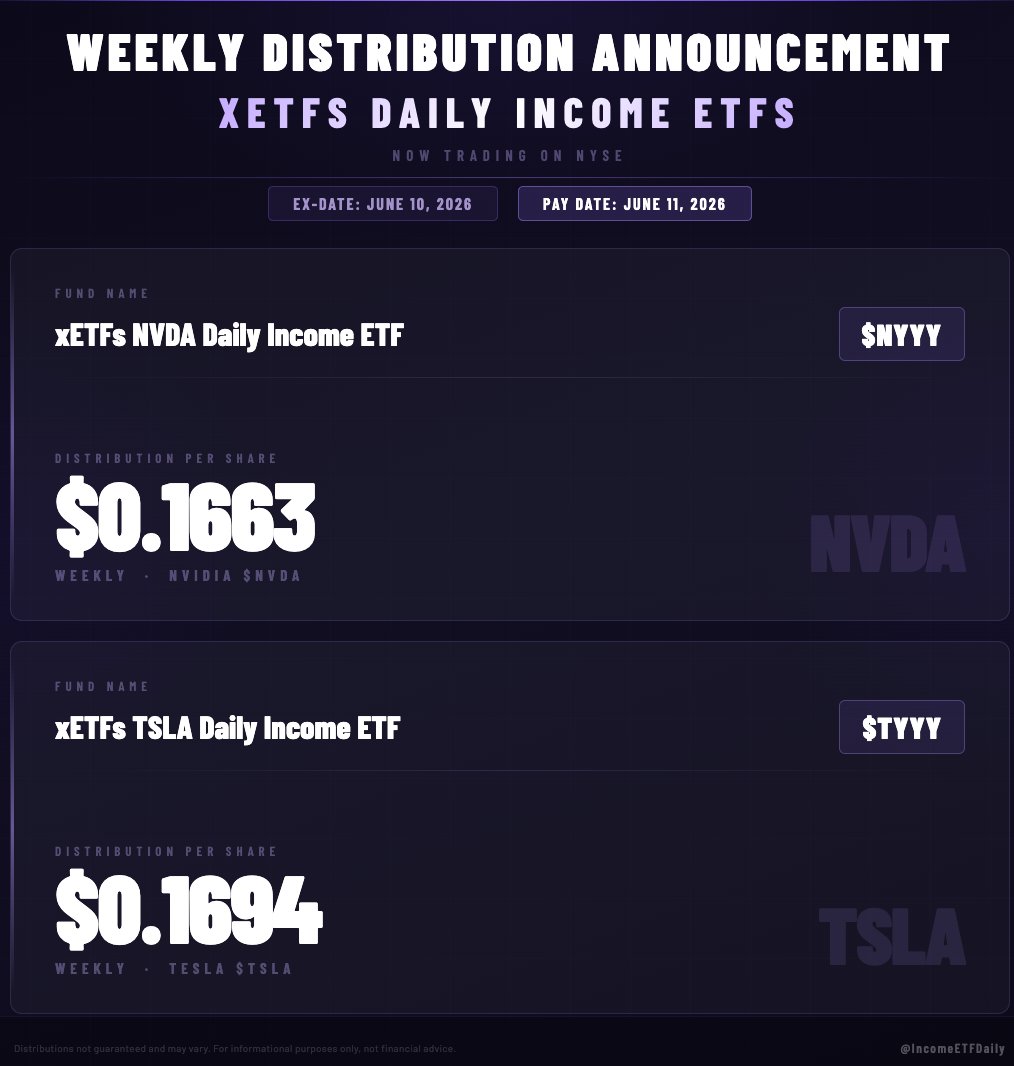
xETFs Daily Income ETFs just announced their latest weekly distributions:
xETFs NVDA Daily Income ETF $NYYY
$0.1663/share
xETFs TSLA Daily Income ETF $TYYY
$0.1694/share
Ex-Date: June 10, 2026
Payable Date: June 11, 2026
⚠️ Distributions are not guaranteed and may vary. This is for informational purposes only, not financial advice.
3
1
7
533
Jun 11
Defiance ETFs just announced their latest distribution for $QLDY:
Nasdaq 100 LightningSpread Income ETF $QLDY
Distribution: $0.1753/share
Distribution Rate: 40.00%
Ex-Date: June 12, 2026
Payable Date: June 15, 2026
⚠️ Distributions are not guaranteed and may vary. 100% of this distribution is estimated return of capital. This does not represent total return.
3
1
17
839
IncomeETFs retweeted

Jun 11
Blackrock is FOMOing into income.
Jun 11

BLACKROCK JUST FILED FOR THE ISHARES BITCOIN PREMIUM INCOME ETF
The structure: hold Bitcoin and $IBIT shares, then sell covered call options on IBIT to generate monthly income.
Think of it as $IBIT plus a yield on top.
The mechanics: BlackRock will write call options representing roughly 25% to 35% of the fund's net asset value, collecting premiums that get paid out to shareholders monthly. You get Bitcoin exposure plus income, in exchange for capping some of your upside if Bitcoin runs hard.
BlackRock is the sponsor. Goldman Sachs is the clearing agent for the options. Coinbase Custody holds the Bitcoin. BNY Mellon handles the cash.
Ticker and launch date still TBD.
3
13
72
5,117
Jun 11
Here is the full lineup of Global X dividend and income ETFs:
DIVIDEND & INCOME
- SuperDividend ETF $SDIV
- SuperDividend U.S. ETF $DIV
- SuperDividend REIT ETF $SRET
- MSCI SuperDividend EAFE ETF $EFAS
- MSCI SuperDividend Emerging Markets ETF $SDEM
- S&P 500 Quality Dividend ETF $QDIV
Global X's dividend lineup spans domestic dividend stocks, REITs, and international markets. $SDIV targets the 100 highest-yielding equities in the world. $SRET focuses exclusively on high-yielding REITs globally.
⚠️ Distributions are not guaranteed and may vary. This is for informational purposes only, not financial advice.
1
19
952
Jun 11
BLACKROCK JUST FILED FOR THE ISHARES BITCOIN PREMIUM INCOME ETF
The structure: hold Bitcoin and $IBIT shares, then sell covered call options on IBIT to generate monthly income.
Think of it as $IBIT plus a yield on top.
The mechanics: BlackRock will write call options representing roughly 25% to 35% of the fund's net asset value, collecting premiums that get paid out to shareholders monthly. You get Bitcoin exposure plus income, in exchange for capping some of your upside if Bitcoin runs hard.
BlackRock is the sponsor. Goldman Sachs is the clearing agent for the options. Coinbase Custody holds the Bitcoin. BNY Mellon handles the cash.
Ticker and launch date still TBD.
1
18
9,275
Jun 11
Here is a breakdown of the NEOS Gold High Income ETF $IAUI you should know:
Launch: June 4, 2025
Expense Ratio: 0.78%
Total Assets: $459.82M
NAV: $51.84
Distribution Rate: 12.14%
Distribution Frequency: Monthly
Since Inception Return: 24.33%🟢
so far in 2026: 3.47%🟢
Top Holdings:
🥇 U.S. Treasury Bill 07/07/2026 80.76%
🥈 Goldman Sachs Physical Gold ETF $AAAU 23.98%
Recent Distributions:
May 2026: $0.5551/share
April 2026: $0.5861/share
March 2026: $0.6129/share
The fund invests in gold exchange-traded products and runs a data-driven call option strategy designed to generate high monthly income while maintaining exposure to physical gold price appreciation.
Disclosure: @NEOSInvestments is a WOLF Financial partner. This is for informational purposes only, not financial advice.
2
2
12
548
Jun 10
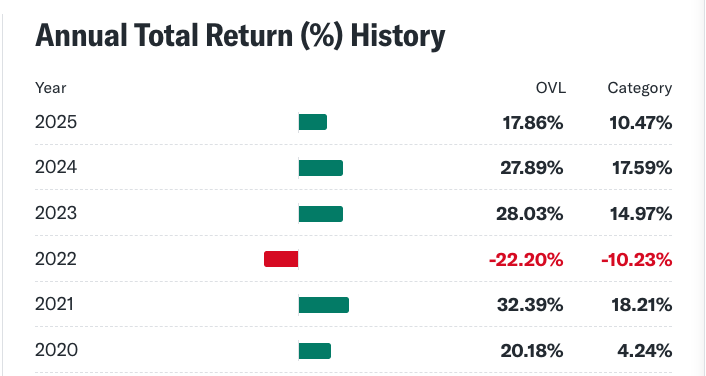
Here are the annual returns for the Overlay Shares Large Cap Equity ETF $OVL since inception:
2020: 20.18%🟢
2021: 32.39%🟢
2022: -22.20%🔴
2023: 28.03%🟢
2024: 27.89%🟢
2025: 17.86%🟢
2026 (so far): 10.12%🟢
Total down years since inception: 1
Total up years since inception: 6
3
13
650
Jun 10
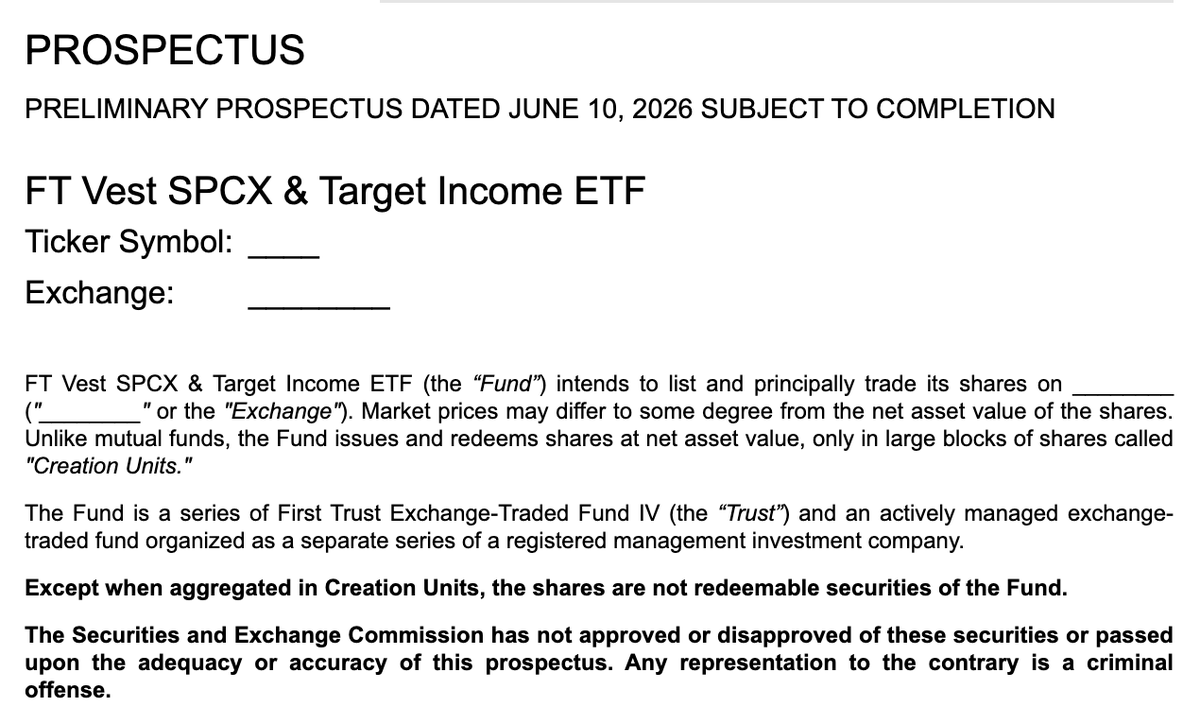
JUST FILED WITH THE SEC:
FIRST TRUST IS LAUNCHING AN INCOME ETF BUILT ON SPACEX $SPCX
It's called the FT Vest SPCX & Target Income ETF. Filed June 10, 2026.
The strategy: hold SpaceX stock and sell weekly covered call options to generate income, targeting a distribution rate of approximately 15% above the S&P 500's annual dividend yield.
Translation: you get SpaceX exposure plus monthly income, in exchange for capping some of your upside if SpaceX runs hard.
The ticker symbol is still blank. The exchange is still blank. The fee is still blank.
3
2
9
2,627
Jun 10
$CEPI vs $NIHI
Both are options-based income ETFs that write covered calls to generate income, but they target completely different underlying assets.
REX Crypto Equity Premium Income ETF $CEPI
Launch: December 4, 2024
Total Assets: $107.42M
Distribution Rate: 42.30%
Expense Ratio: 0.85%
1-Year Return: 18.50%🟢
Distribution Frequency: Weekly
Recent Distributions:
June 9, 2026: $0.2764/share
June 3, 2026: $0.2882/share
May 27, 2026: $0.2783/share
NEOS MSCI EAFE High Income ETF $NIHI
Launch: September 16, 2025
Total Assets: $167.72M
Distribution Rate: 9.98%
Expense Ratio: 0.68%
Since Inception Return: 11.69%🟢
Distribution Frequency: Monthly
Recent Distributions:
May 2026: $0.4244/share
April 2026: $0.4280/share
March 2026: $0.4119/share
$CEPI writes covered calls on crypto-related stocks and pays weekly at 42.30%. $NIHI writes covered calls on international developed market equities and pays monthly at 9.98%. One targets high-yield crypto exposure, the other targets steady international income.
Disclosure: @NEOSInvestments and @REXShares are WOLF Financial partners. This is for informational purposes only, not financial advice.
2
1
8
502