
PhD Atmospheric Chemistry, Senior Consultant, Environmental Data Analyst, @posit_pbc Certified Tidyverse Instructor, #RStats developer
Joined September 2012
- Tweets 226
- Following 279
- Followers 410
- Likes 462
75 Photos and videos

Pinned Tweet

23 Apr 2023
I had a really lovely time at #SatRdaysLondon2023 yesterday speaking about our work handling air quality data and hearing what the rest of the #rstats community is up to. Learned a lot of useful stuff and met some great people - already looking forward to next year!
1
5
1,849
13 Mar 2024
I find bits of #ObservableFramework & #ObservablePlot really exciting, but I'm struggling a bit on text formatting in Plot - e.g., if I wanted to add a sub/superscript or Greek letter to the axis label. Any guides out there? Thinking about chem (NOx) & units (ug/m3) formatting
1
1
1,085
12 Feb 2024
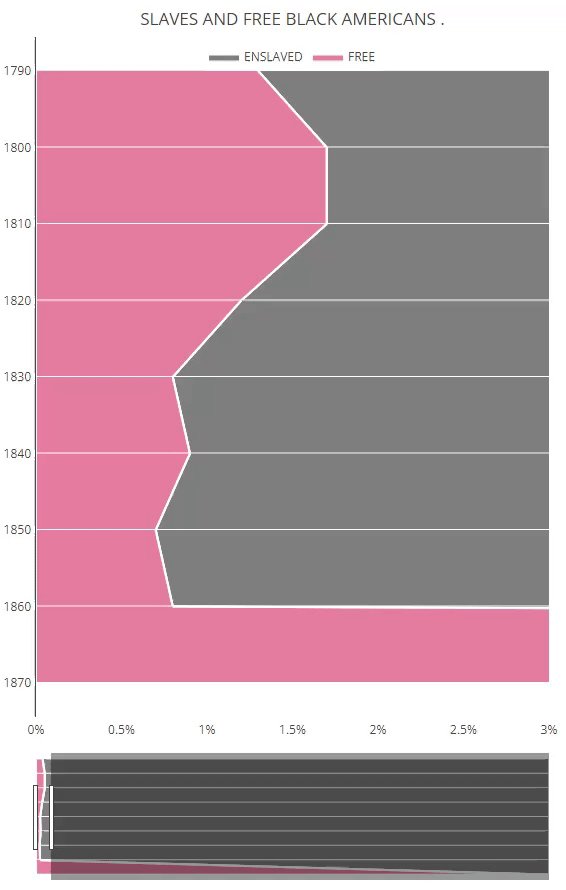
Week 2 of the #DuBoisChallenge2024. I recreated the chart with #plotly for #rstats. The original has a "torn" effect as the x-axis range is so wide compared to most of the data. I use a "rangeslider" so readers can actually scan to see/feel how big the difference is!
1
3
13
1,042
12 Feb 2024
See code: jack-davison.quarto.pub/dubo…
See last week's post: x.com/JDavison_/status/17553…
7 Feb 2024

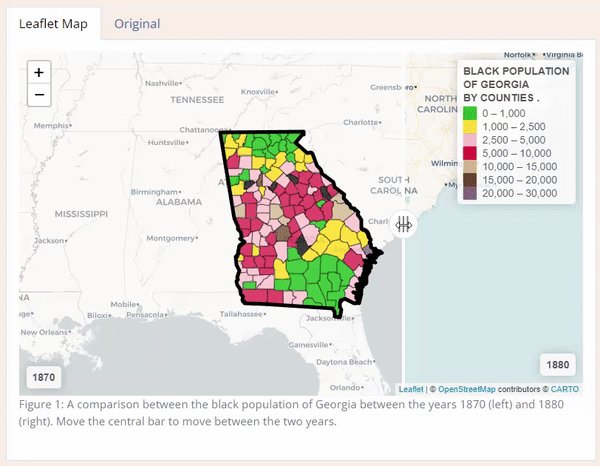
It's time for the #DuBoisChallenge2024. I've done static recreations, and even tabular recreations, but this year I'm keen to use #rstats interactive #DataViz packages. Here's a #leaflet map for Challenge 1 - see jack-davison.quarto.pub/dubo… for the map/code/original plate.
1
93
7 Feb 2024
It's time for the #DuBoisChallenge2024. I've done static recreations, and even tabular recreations, but this year I'm keen to use #rstats interactive #DataViz packages. Here's a #leaflet map for Challenge 1 - see jack-davison.quarto.pub/dubo… for the map/code/original plate.
1
1
6
842
7 Feb 2024
Obviously it's quite a big departure from the way the original plate is laid out - I want to be creative with the medium, as I tried to be in jack-davison.quarto.pub/tabu…. DuBois didn't have JavaScript, so we can only guess as to what he might have done with it!
77
6 Oct 2023
I've written another #rstats #leaflet post - this time how to use plots (e.g., ggplots) as markers on a leaflet map in a tidy way. Give it a read if interested! jack-davison.github.io/posts…
1
10
785
6 Oct 2023
This is the second in a series, the first can be read here: x.com/JDavison_/status/17044…
20 Sep 2023
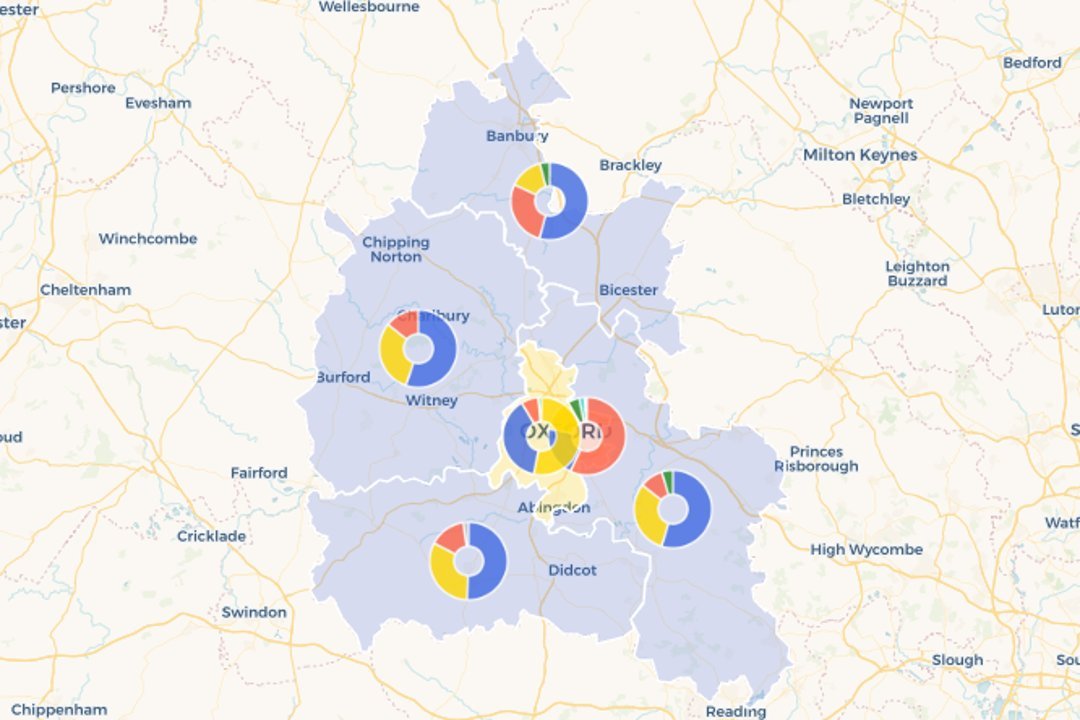
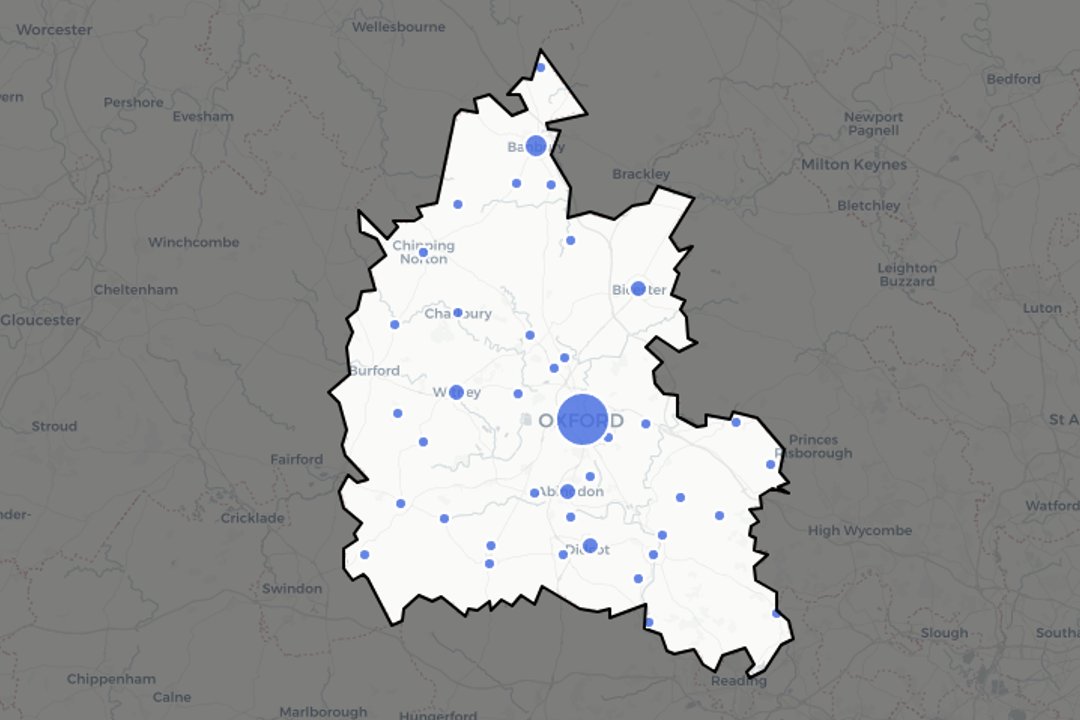
I have a real love for the #rstats #leaflet 📦, so was thinking of writing up some tips and tricks I've picked up as I've used it professionally over the last few years. First one; "shading out" de-emphasised regions. Give it a read if you're interested! jack-davison.github.io/posts…
ALT A screenshot of an interactive leaflet map, showing towns/cities in Oxfordshire, UK. The map outside of Oxfordshire has been shaded out to de-emphasise it.
104
20 Sep 2023
I have a real love for the #rstats #leaflet 📦, so was thinking of writing up some tips and tricks I've picked up as I've used it professionally over the last few years. First one; "shading out" de-emphasised regions. Give it a read if you're interested! jack-davison.github.io/posts…
ALT A screenshot of an interactive leaflet map, showing towns/cities in Oxfordshire, UK. The map outside of Oxfordshire has been shaded out to de-emphasise it.
4
33
2,709

Jack Davison retweeted

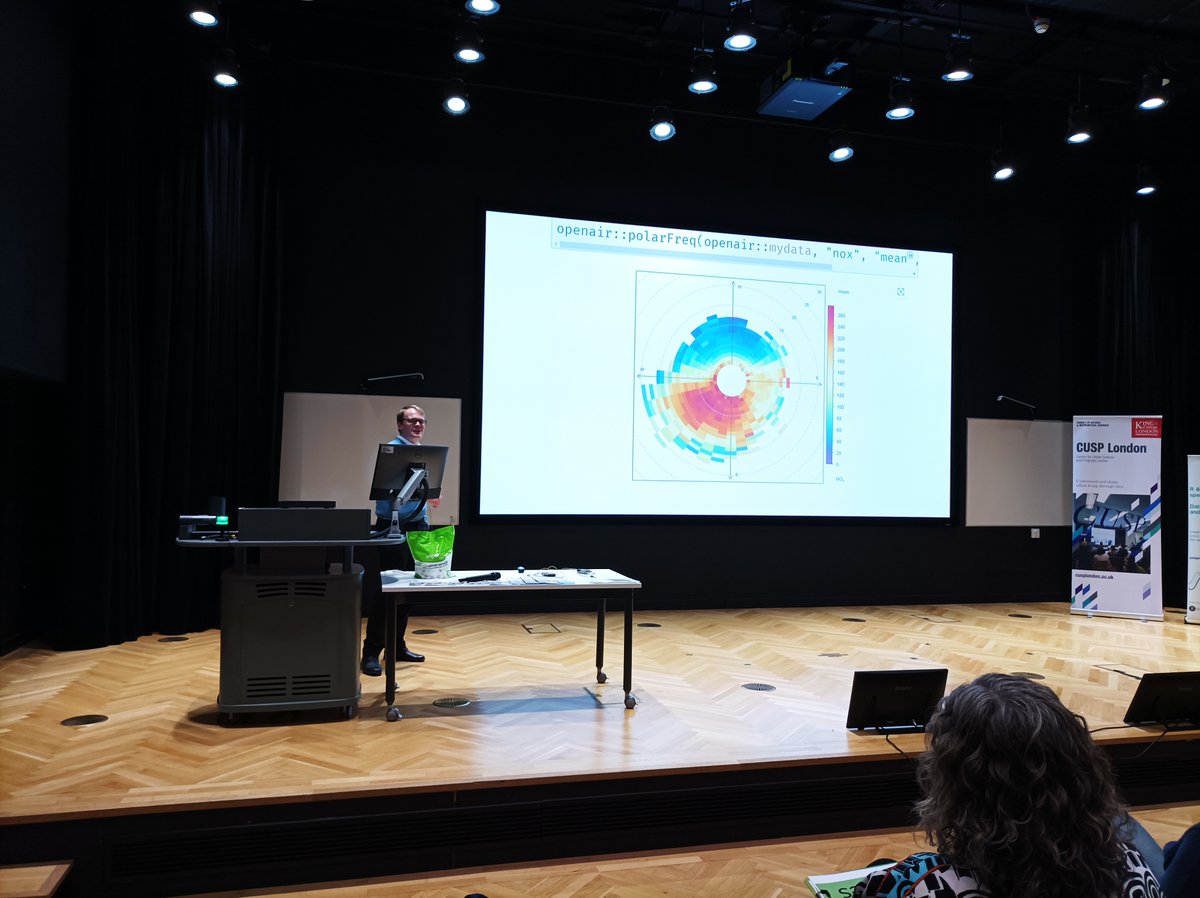
22 Apr 2023
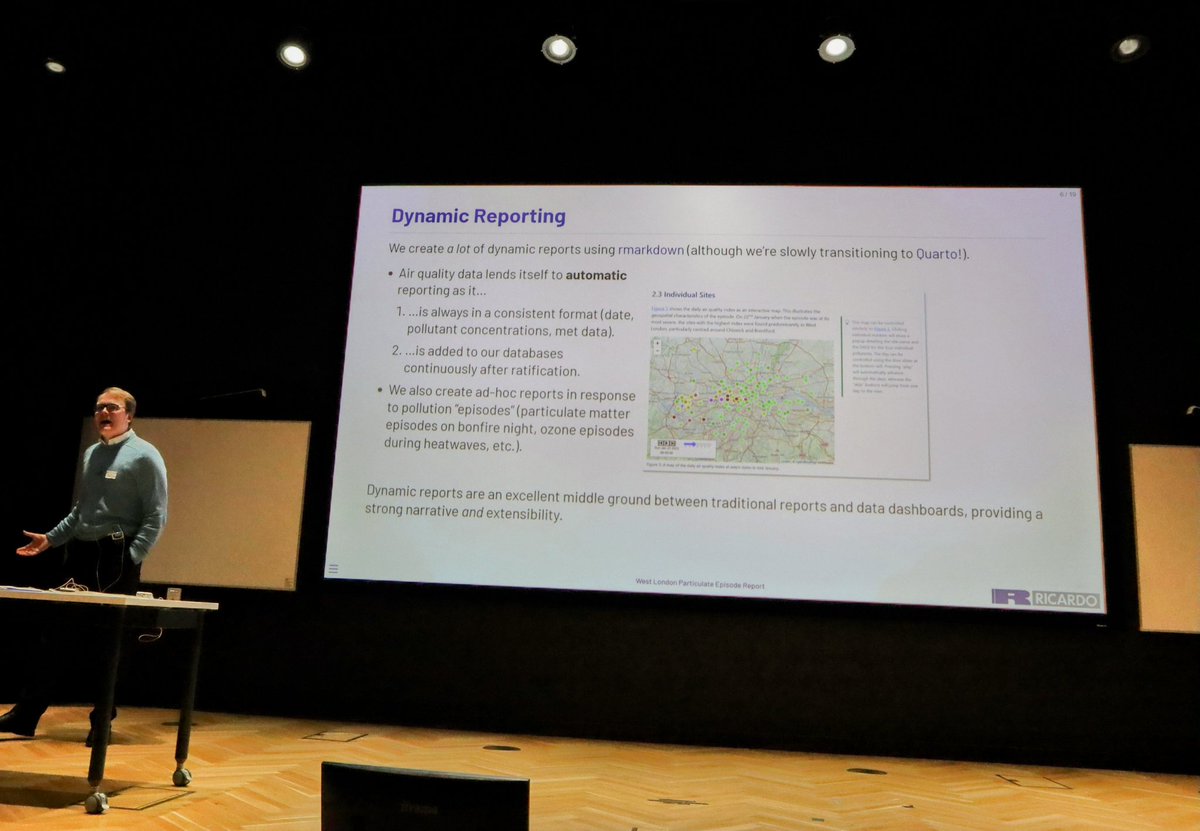
@JDavison_ describing plotting of weather and air quality data using R.
#SatRdaysLondon2023 @CuspLondon @jumping_uk
2
3
268
22 Mar 2023
I'm talking at OxfordR on Monday about air quality, dynamic reports, interactive maps, interesting data sources, package development, custom leaflet markers, nested data frames, and more! And there'll be pizza, so what's not to like? 🍕
21 Mar 2023

Very excited that on Monday (27th March), we will have @JDavison_ giving a talk on Air Quality data analysis and the {openairmaps} #rstats package. Looking forward to it!
Come and join us! Sign up here: meetup.com/Oxford-R-User-Gro…
1
7
590
5 Mar 2023
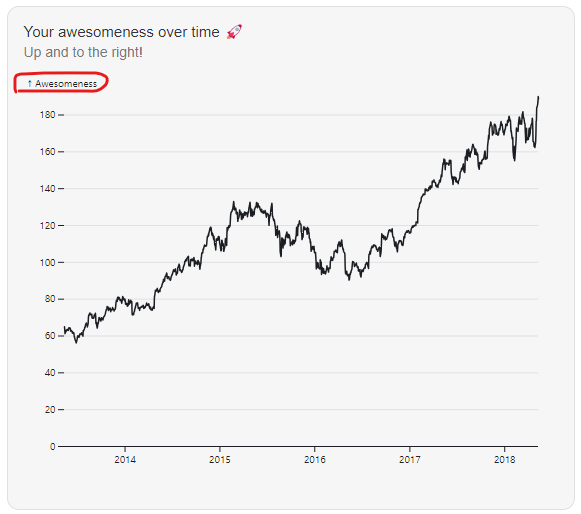
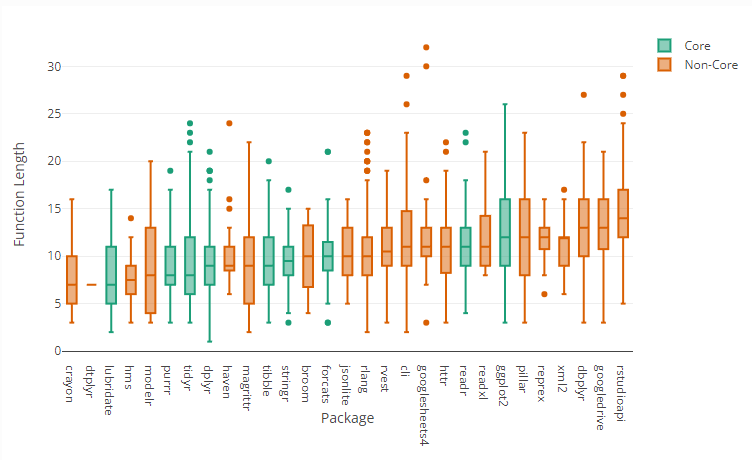
#tidyr deprecated `separate()` in favour of, e.g., `separate_longer_position()` - but do #tidyverse #rstats functions always get replaced by longer/wordier alternatives? I wrote a silly blogpost analysing `{tidyverse}` function names to find out.
👉 jack-davison.github.io/posts…
2
15
69
11,270
5 Mar 2023
The post also has a bit of #purrr, a lot of #plotly, and is inspired in part by a funny use of Chat GPT by @charliejhadley:
x.com/charliejhadley/status/…
606
24 Feb 2023
I'm speaking at #satrdays London about how we use R to analyse air quality data, forays into package development, my love of leaflet maps, cool free data sources, and more! Hope to see lots of the UK #rstats community there in April!

First up for SatRdays London is Jack Davison (@JDavison_) of @RicardoGroupPlc👋Jack's talk “Put it on a map!” – Developments in Air Quality Data Analysis will discuss how created interactive air quality maps!
#rstats #satrdays @CuspLondon @RConsortium
satrday-london-2023.jumpingr…

4
8
2,482
9 Feb 2023
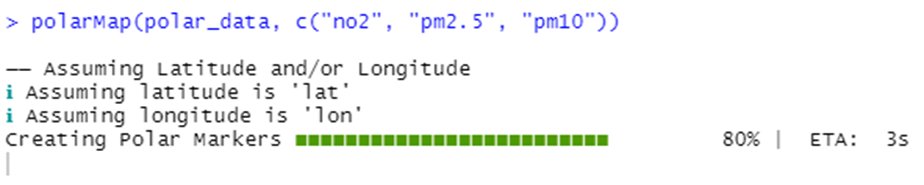
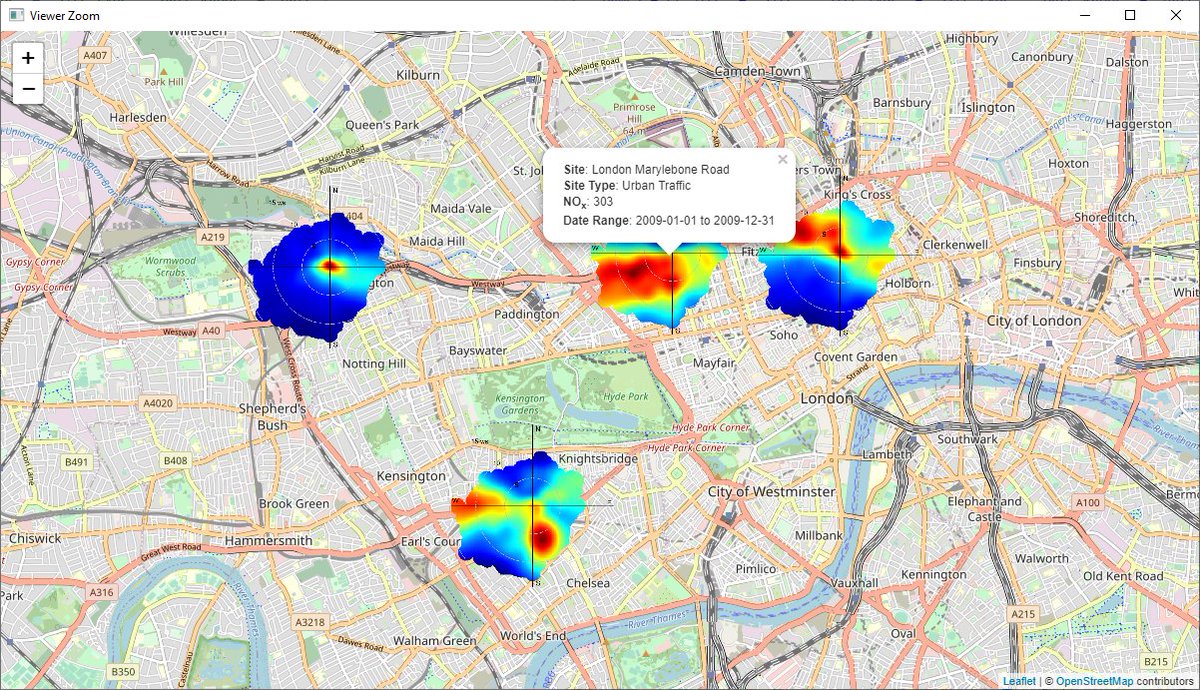
Excited to announce that version 0.7.0 of our #airquality #rstats 📦 {openairmaps} is on its way to CRAN. This release involved a massive code refactor which has brought buckets of new features to help improve your air quality maps 🧵1/6
ALT The openairmaps logo.
3
21
87
7,246
9 Feb 2023
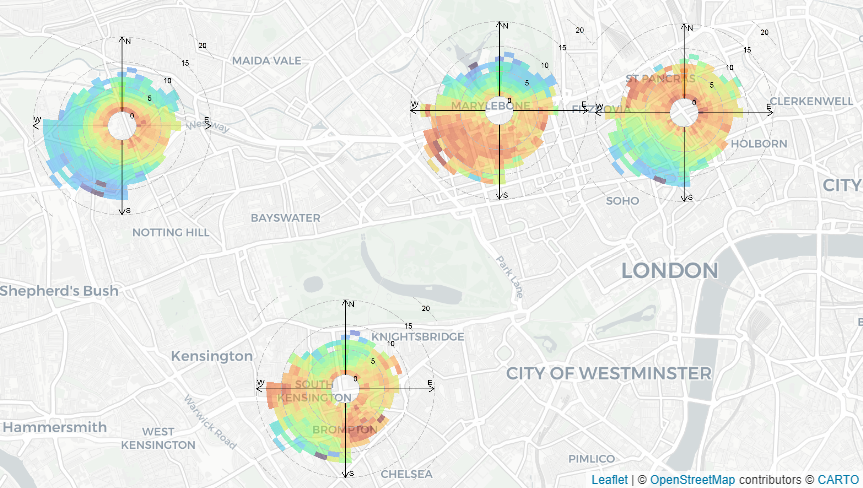
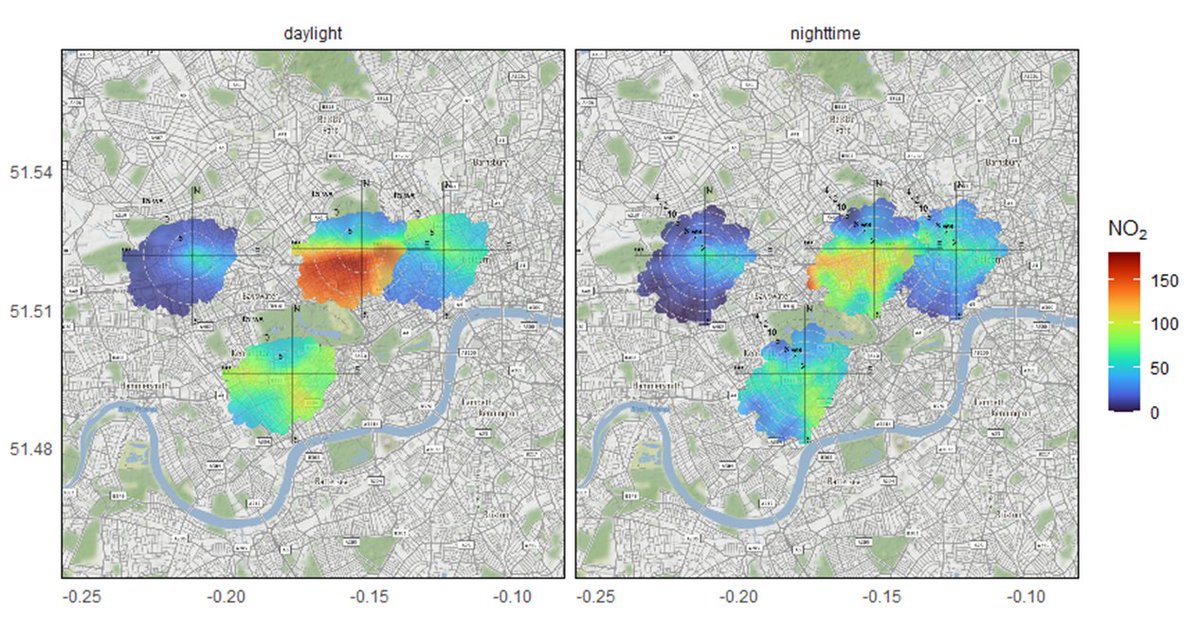
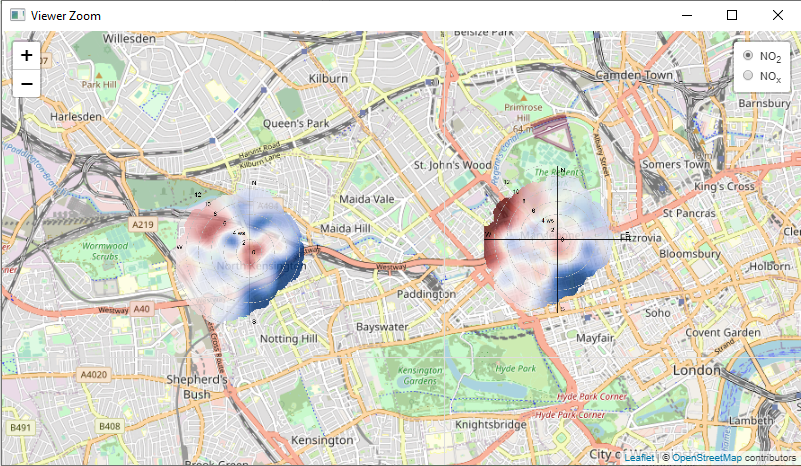
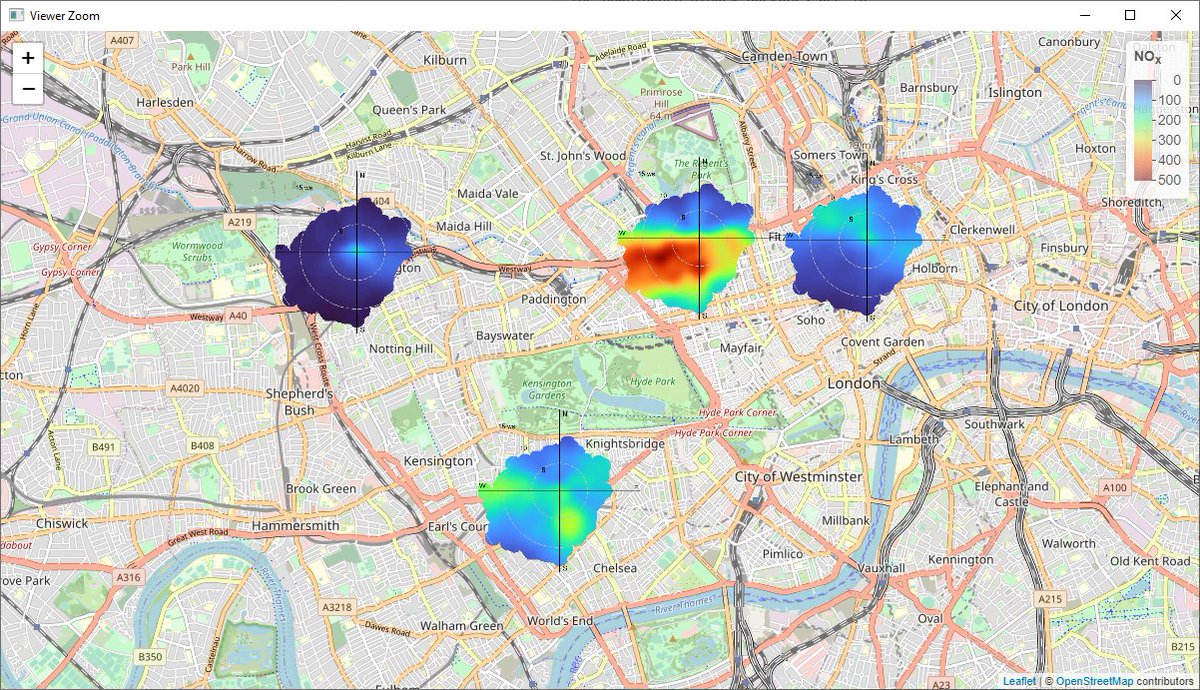
We've also fixed the "alpha" option on Windows, and introduced "alpha" to all fourteen (!) of our polar mapping functions. Adding a bit of transparency reveals more of your chosen basemap, giving you a better feel for where your measurements are being made. 🧵5/6
ALT A demonstration of transparency in a polar plot map.
1
1
418
9 Feb 2023
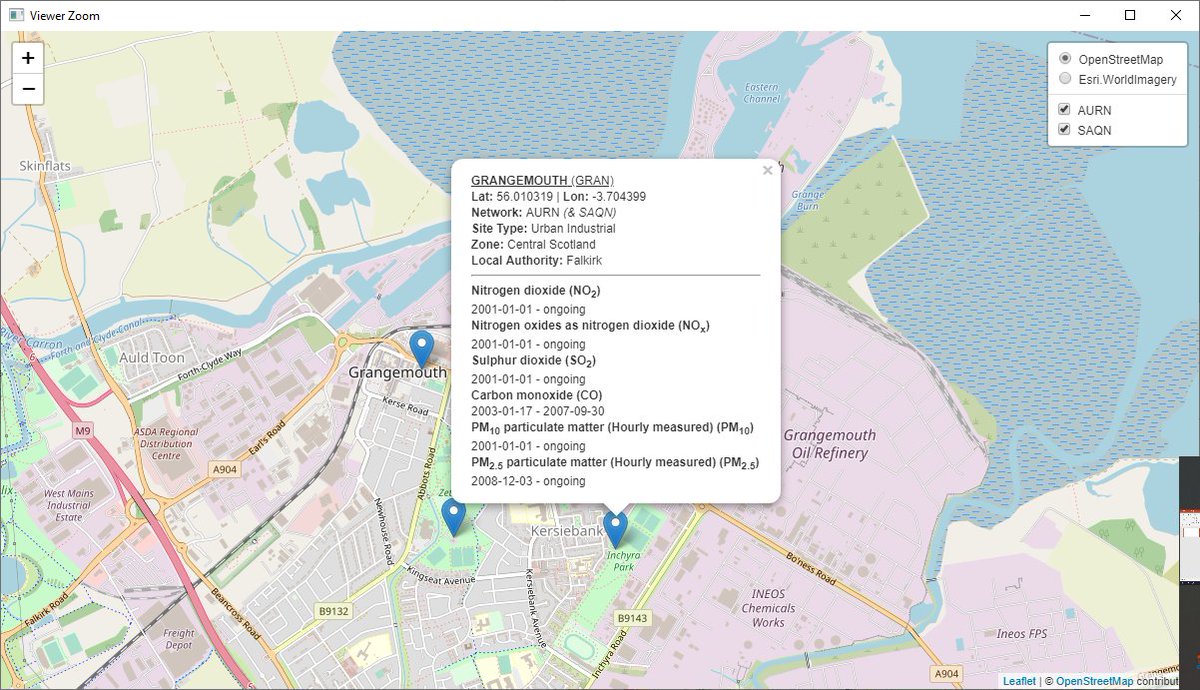
All this, as well as `networkMap()` taking advantage of new `importMeta()` options, refinements in documentation, bug fixes, and more robust code that'll run quicker and with less scope for errors. As always, feature requests/bugs/questions here: github.com/davidcarslaw/open… 🧵6/6
1
4
407