
4 May 2024
Here's my general #workflow I followed and some tools I used during the entire challenge:
- Explore and manual tweak in #GoogleSheets if data was already summarized
- Clean, filter in #Observable using #Arquero. Do in #R (or #Python if you use it) if the data is heavy with more than 100MBs in data which was not my case.
- Draft visualize in #ObservablePlot or #Rawgraphs for fancier and nice charts. Choosing charts must be intentional and purposeful that would make the most out of the discovered insight.
- Export as #SVGs and do the magic visual tweakings in #Adobe #Illustrator to make them prettier.
1
1
5
831

19 Feb 2024
I played around with @observablehq 's #ObservableFramework and #ObservablePlot over the weekend. Great site generator and the capabilities of the plots amazed me.
🎥 Check out what I came up with: youtu.be/mg8pNBnMOcI

1
4
394

1 Nov 2023
Day 1 of the #30DayMapChallenge: Exploring Nuclear Power Reactors Worldwide!
Today, I kicked off the challenge by diving into the world of #JavaScript and #ObservablePlot.
Huge thanks to the amazing #Observable team for their fantastic Introduction to Observable Plot sessions!
3
282

🚀 Last week's #TechReleases have been 🔥!
(Thread🧵)
1️⃣ #ObservablePlot: Unleash the power of exploratory data viz with this new JS library 📊💡! Dive in at observablehq.com/plot
1
3
321

12 Apr 2022
working on this workshop...
a quick gif scrolling through the exercises we'll code together
#ObservablePlot
1
7

27 Jan 2022
For the data and chart lovers out there!
Easy ways to learn more and get started quickly with #ObservablePlot 🎉
24 Jan 2022

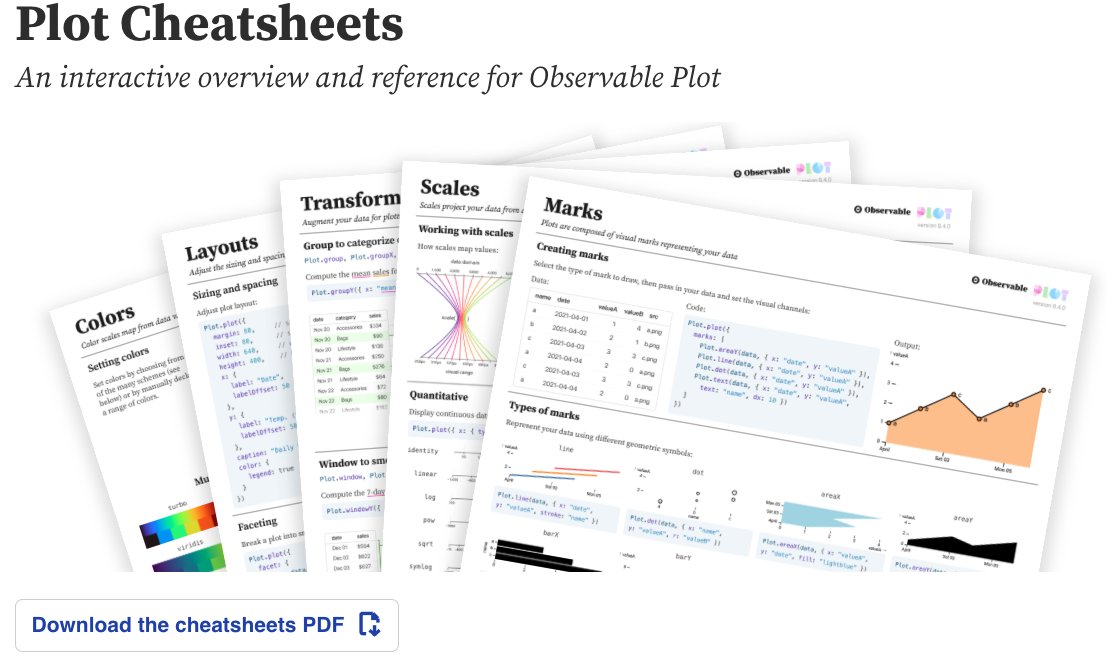
We are so excited to announce Plot Cheatsheets - an interactive overview with printable PDFs to explore each of the foundational concepts of the Observable Plot library including: Marks, Scales, Transforms, Layout & Colors
observablehq.com/@observable…
2

15 Dec 2021
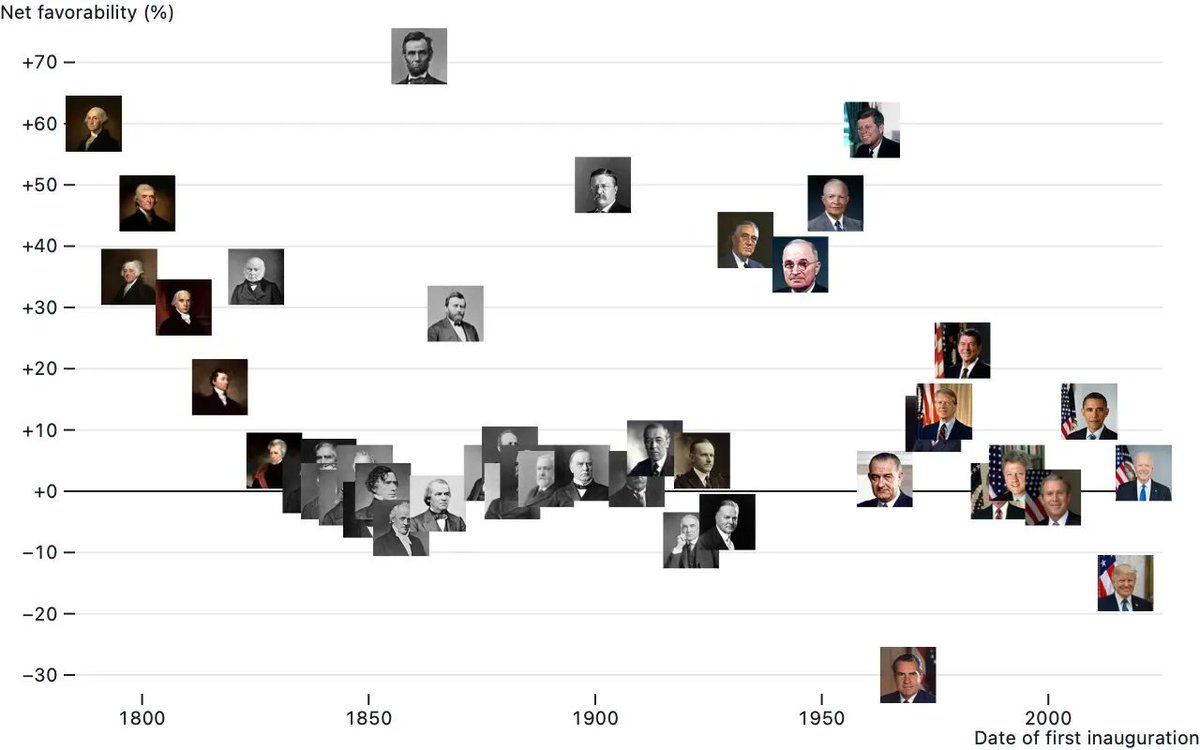
Legends & image marks now available in #ObservablePlot 0.3
observablehq.com/@observable…
observablehq.com/@observable…
8 Dec 2021

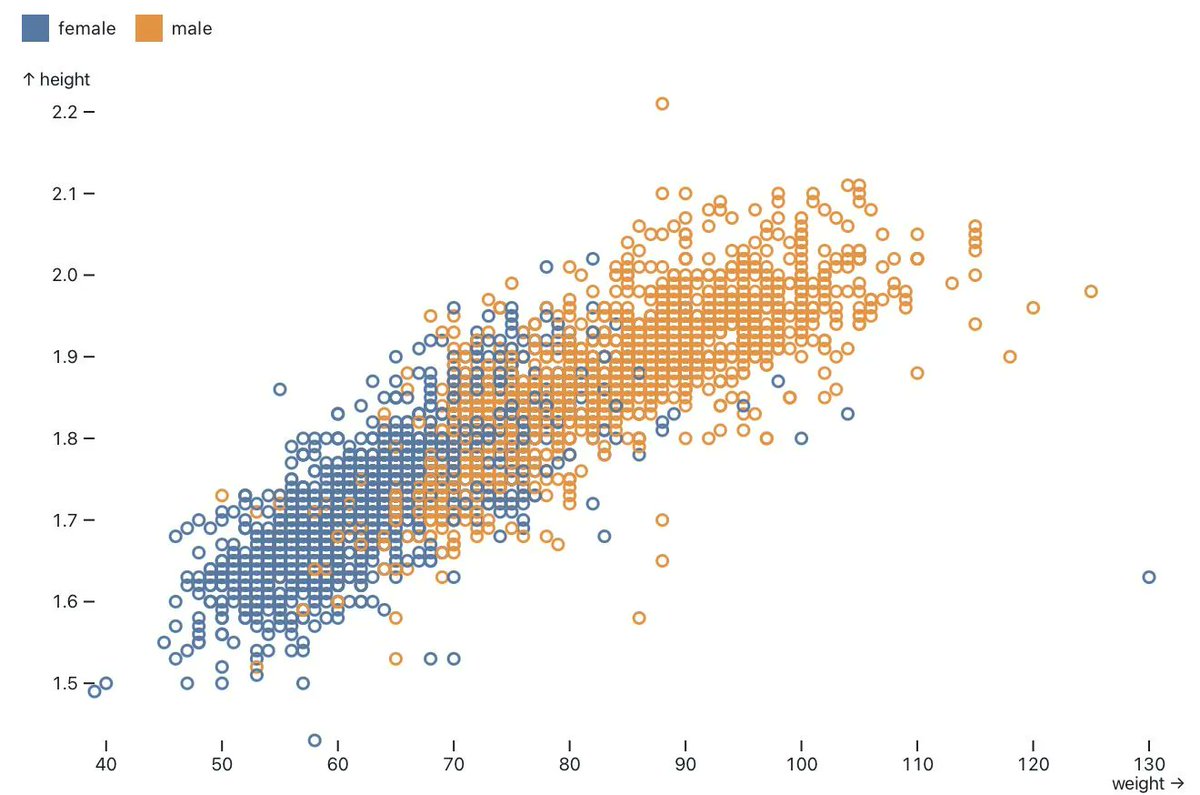
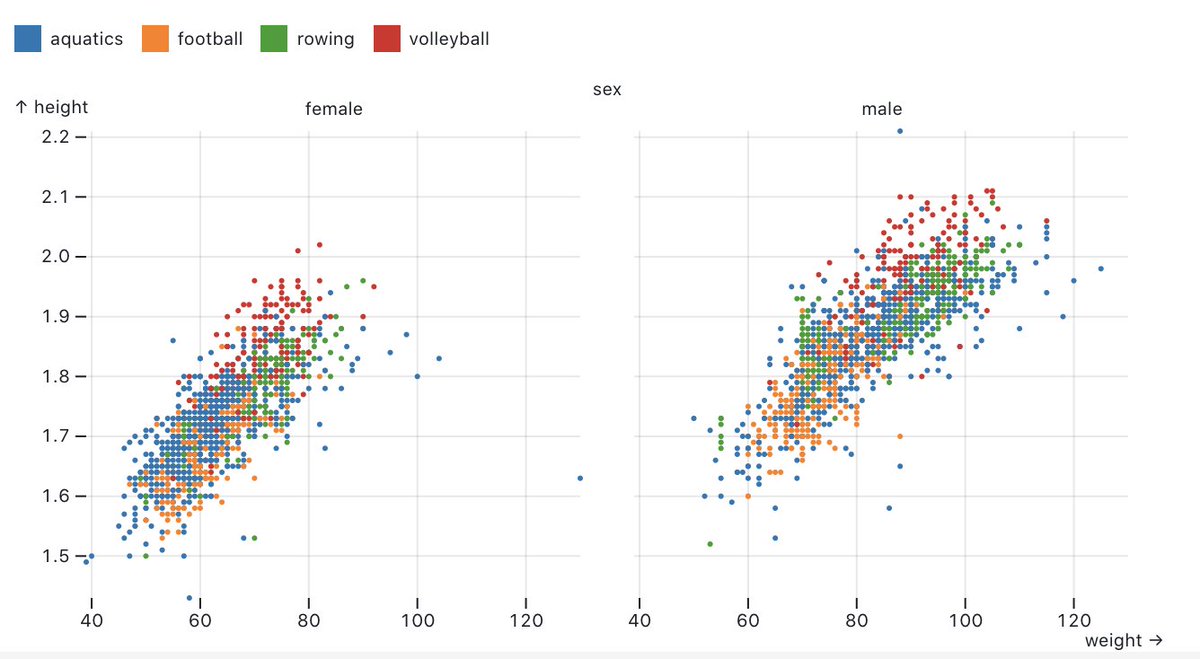
Observable Plot 0.3 adds color (and opacity) legends, image marks, and more! github.com/observablehq/plot…


1
1
17
8 Dec 2021
built-in legends have arrived in Plot!!!
observablehq.com/@observable…
you've been asking for it and @recifs delivered 😁
📈🚀 #ObservablePlot
4
6
33

22 Oct 2021
Thanks so much everyone who attended my #ReactAdvanced London talk about (easier) interactive #dataviz in #ReactJS using #ObservablePlot! 💖
Slides with links to example code & tons of further reading are here: observablehq.com/@anjana/int…
2
2
33
20 Oct 2021
I'm quite proud of where we ended up with this article. it's surprising how little custom code was used!
the combination of @observablehq #ObservablePlot components makes for such a powerful authoring experience. especially when collaborating w/ @mf_viz and @zanstrong
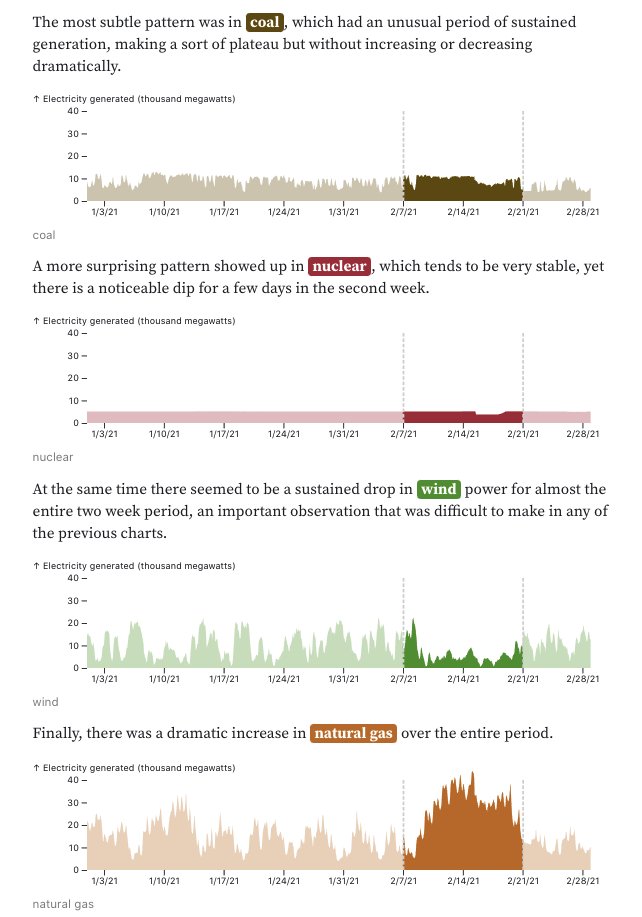
13 Oct 2021
How can simple charts expose complex patterns in time series data?⏱Join us on an analysis adventure to answer the question: What caused this? 👇observablehq.com/@observable…
2
27
20 Oct 2021
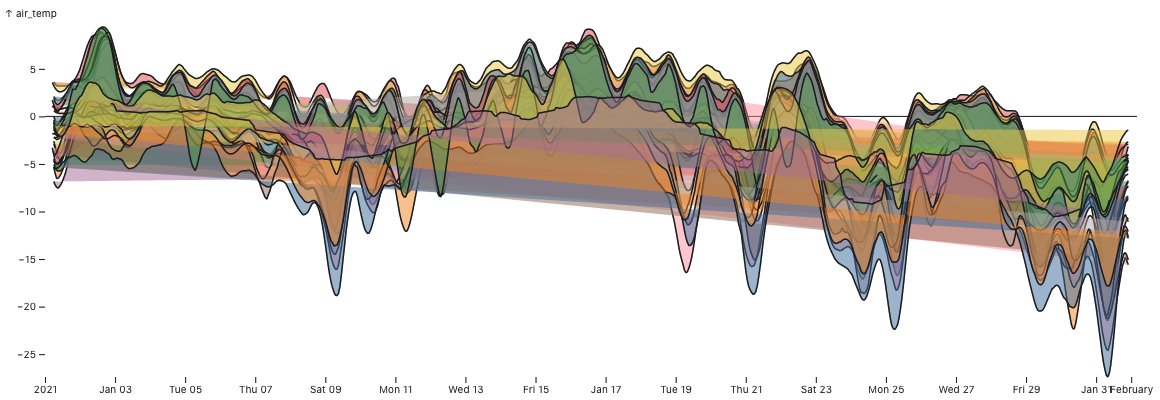
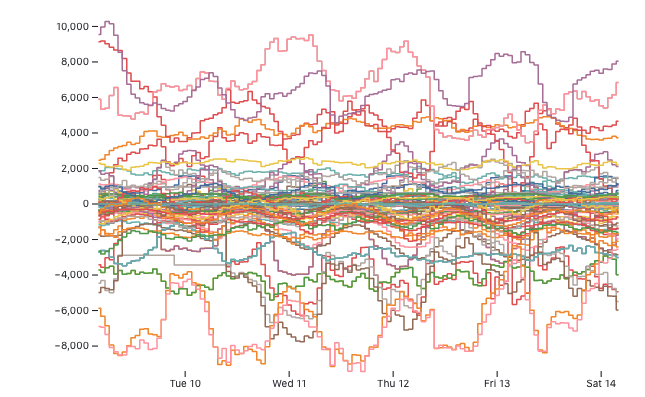
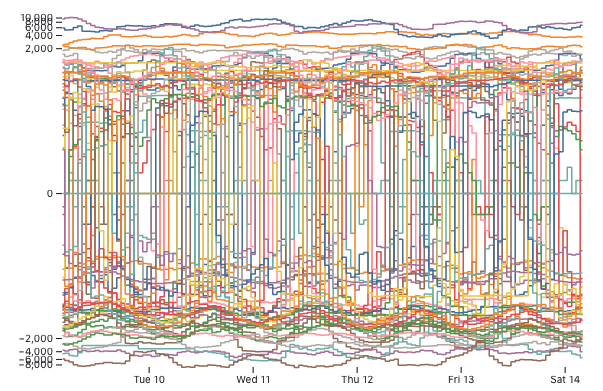
one of my favorite things about #observableplot is how much you get to see along the way. like, before you get to the perfect working chart you get to see all this weird stuff. sometimes it shows you something you didn't think to think about!
#plotbrokeandmadeart

1

Let's make a bar chrt! Bar chart A look at how quickly
🚄 we could code 👩💻 together a simple bar chart with
@chrt_io
Forked from this #ObservablePlot notebook observablehq.com/@enjalot/si…
2
2
2

13 Sep 2021
📈 @observablehq PLOT with a little help from #d3js, the limit is your imagination!!
observablehq.com/@analyzer20…
#javascript #observableplot #dataviz
2
17
12 Sep 2021
10 years ago I made my first #d3js live coding video, it was 40 minutes long and I made a simple bar chart.
vimeo.com/29080884
Here is an unedited screencap of the same chart in 1 minute and 35 seconds using #ObservablePlot.
observablehq.com/@enjalot/si…
📈🚀
5
48
30 Aug 2021
My latest @observablehq notebook - Photo to 3D RGB Model using @threejs. observablehq.com/@analyzer20…
#javascript #observableplot
1
1
18
4 Aug 2021
I grew up watching the Simpson's, now I've seen it in a new light:
observablehq.com/@enjalot/si…
when the top 20 characters said their lines in each of almost 600 episodes.
data linked in notebook, so much more to explore...
#ObservablePlot 📈🚀
1
12
28 Jul 2021
this stream with @sxywu and @mbostock is epic:
youtube.com/watch?v=nCBog6EP…
a deep dive in data exploration using one of the datasketch.es projects datasets and re-exploring it using #ObservablePlot!
see the resulting notebook here w/ tons of Plots:
observablehq.com/@sxywu/the-…
1
6
28 Jul 2021
Going live now! Join @mbostock @sxywu @enjalot for a #dataviz showdown: #D3js vs. #ObservablePlot!
Tune in on Twitch: twitch.tv/observablehq
4
14
26 Jul 2021
Wednesday July 28 at 9am PT, #dataviz superstars @mbostock & @sxywu explore the differences between #D3js and #ObservablePlot in a livestream with @enjalot!
meetup.com/observablehq/even…
2
3
9