
Independent Football Analyst | Expertise Sporting CP & Manchester United
Joined December 2024
- Tweets 9,080
- Following 142
- Followers 0
- Likes 10,690
1,117 Photos and videos


Pinned Tweet

2 Dec 2024
Excited to launch @JamesTactics | your go-to source for in-depth football analysis. I'll be sharing tactical breakdowns, insights on Sporting CP & Manchester United.
2
4
129
156,425
JAMES retweeted

23 Sep 2025
lmao @JamesTactics didnt u just tweet this like yesterday 😂😂

We need to shop more at Bayern...Musiala as Bruno’s replacement?
Agent Zirkzee can sort that 👌

1
1
5
6,054

JAMES retweeted

23 Sep 2025
I rewatched the first half against Chelsea. I think we were very good.
— Extremely fast start. Chelsea had no answers whatsoever. Created 3 dangerous situations in the first 4 mins. One of those situations led to Sanchez red.
— Maresca folded and made many defensive subs.
— We kept the pressure and kept on attacking. The attack was very good and Chelsea hardly had any attacks of their own.
— Scored 2 goals and there could have been more with a bit more clinical action in the final third.
— Casemiro unfortunate red card ended the first half. Ref should have done better. Poor decision from the ref.
— Even when we were defending in mid block, I noticed that we were compact. That led us to win the ball and start our transition attack. Great to see.
11
13
261
17,965
JAMES retweeted

23 Sep 2025
When the data favours us there is always a context behind it but if the data had favoured other teams the same people will use that data to attack
1
1
9
1,826
JAMES retweeted

23 Sep 2025
I genuinely think if Amorim came in this summer and the team pulled performed like this..the word around him would've been very different. It's just that people have already made up their mind regarding him and can't come to terms with any sort of positive stats from his team
1
15
1,362
23 Sep 2025
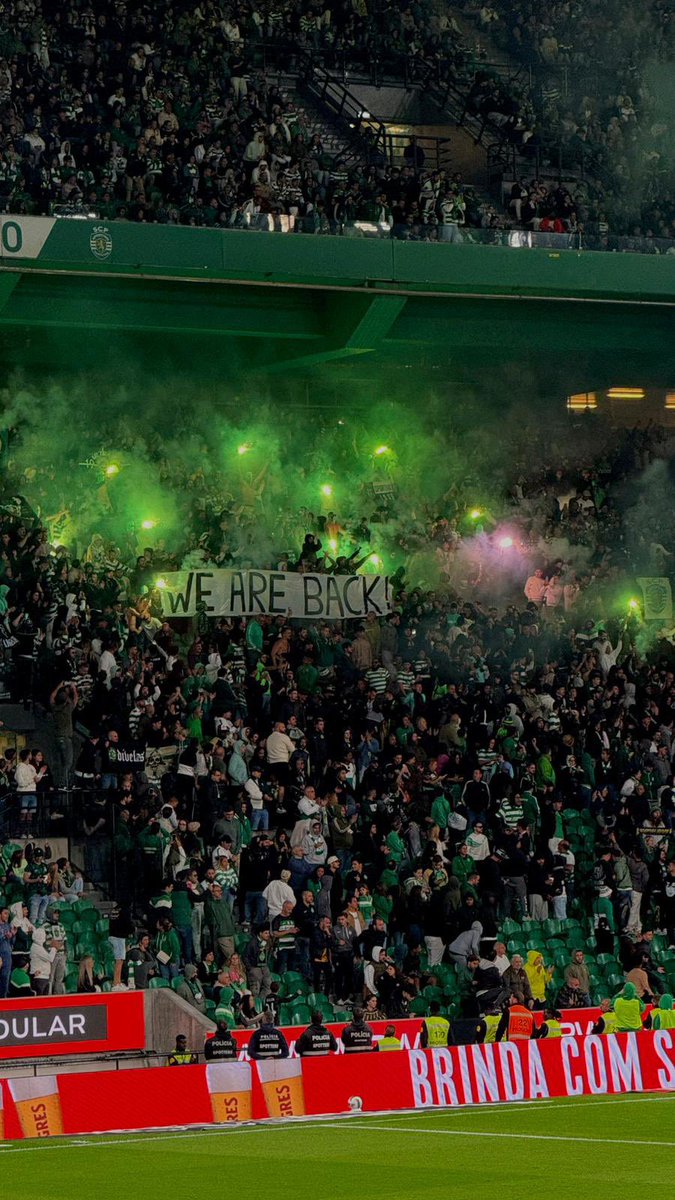
🟢 Supporters involved in 2018 Alcochete training ground invasion return to Alvalade: “We Are Back”
Last night’s fixture at Alvalade marked the return to the South Stand (“Curva Sul”) of a group of Sporting supporters who had previously been detained in connection with the notorious events at the club’s Alcochete training ground in 2018.
The group, many of whom faced legal consequences and lengthy stadium bans following the incident which saw ultras storm the first-team training facility and physically confront players and staff made their presence felt by unveiling a banner reading:
“We Are Back.”
1
10
2,275
23 Sep 2025
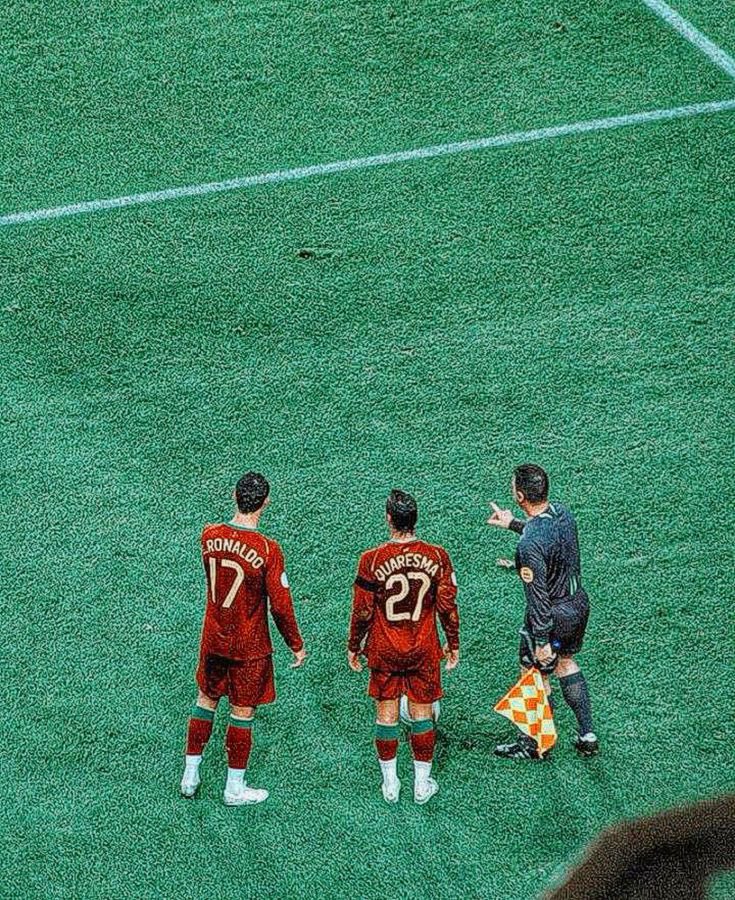
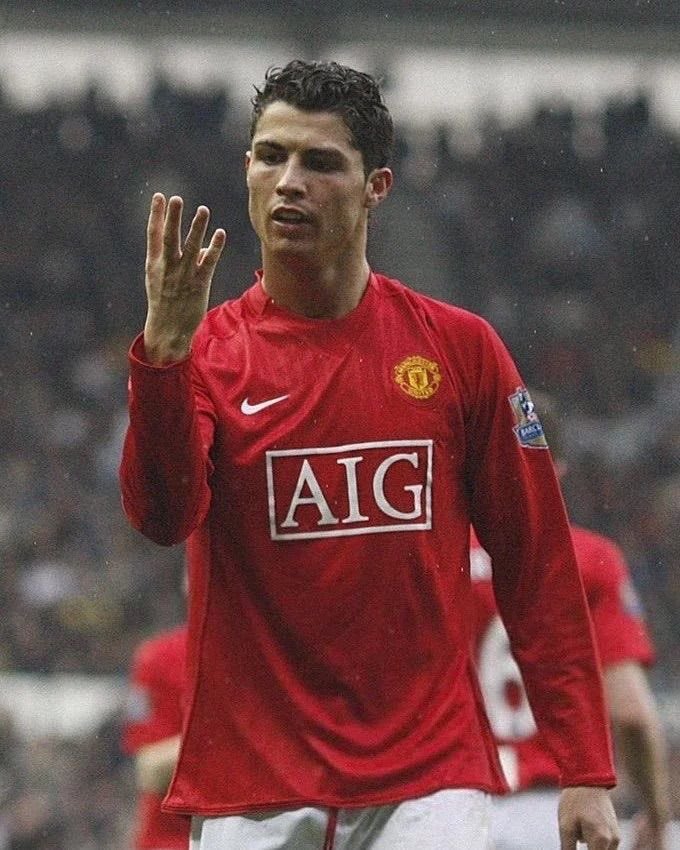
Back when I was a kid, I used to watch GIFs of Ronaldo before my own football matches. There was this website or blog called “c-r-7.skyblog” or something like that.
I’ll never forget this GIF vs Ashley Cole
4
2
43
3,063
23 Sep 2025
Every time I drop the raw @premierleague data (GW3 & GW5), accounts always appear out of thin air to “contextualize” the numbers, with the sole intention of downplaying any optimism and steering the fanbase toward pure negativity.
The data is raw, and it’s compared against 19 other Premier League teams, each with their own context, game states, sample sizes, and all the other arguments people use to diminish positive metrics.
Everyone who watches the games knows the raw data never tells the whole story and there’s still a lot of work to be done.
Use the data as you please, but I encourage everyone to actually watch the games as well. I see progress both in the data and on the pitch.
Hope this helps.
22 Sep 2025

Premier League 25/26 updated data after GW5 📊
𝗘𝗫𝗣𝗘𝗖𝗧𝗘𝗗 𝗚𝗢𝗔𝗟𝗦 (𝘅𝗚):
1️⃣ Man Utd — 9.7
2️⃣ Man City — 9.3
3️⃣ Crystal Palace — 8.3
𝗦𝗛𝗢𝗧𝗦 𝗢𝗡 𝗧𝗔𝗥𝗚𝗘𝗧:
1️⃣ Liverpool — 23
2️⃣ Man Utd/Chelsea — 21
3️⃣ Man City — 20
𝗦𝗛𝗢𝗧-𝗖𝗥𝗘𝗔𝗧𝗜𝗡𝗚 𝗔𝗖𝗧𝗜𝗢𝗡𝗦:
1️⃣ Man Utd — 145 (29.00 p90)
2️⃣ Liverpool — 126 (25.20 p90)
3️⃣ Bournemouth — 122 (24.40 p90)
𝗧𝗢𝗨𝗖𝗛𝗘𝗦 𝗜𝗡 𝗢𝗣𝗣. 𝗕𝗢𝗫:
1️⃣ Arsenal — 150
2️⃣ Tottenham — 144
3️⃣ Liverpool — 142
(Man Utd is #4 with 138 touches)
𝗣𝗥𝗢𝗚𝗥𝗘𝗦𝗦𝗜𝗩𝗘 𝗖𝗔𝗥𝗥𝗜𝗘𝗦:
1️⃣ Liverpool — 124
2️⃣ Arsenal — 117
3️⃣ Man Utd — 111
𝗦𝗛𝗢𝗧𝗦 𝗣𝗘𝗥 𝟵𝟬 𝗠𝗜𝗡𝗨𝗧𝗘𝗦:
1️⃣ Man Utd — 15.80
2️⃣ Liverpool — 14.00
3️⃣ Bournemouth — 13.40
𝗧𝗔𝗖𝗞𝗟𝗘 𝗦𝗨𝗖𝗖𝗘𝗦𝗦:
1️⃣ Sunderland — 69.7%
2️⃣ Fulham — 66.7%
3️⃣ Man Utd — 65.1%

8
13
132
9,776
23 Sep 2025
📌
23 Sep 2025

I've never seen any other team's xG broken down like this, and what's funny is that it's our own fans and not rivals doing it. It's like it disturbs you watching someone say anything positive about our team.
3
28
2,846
23 Sep 2025
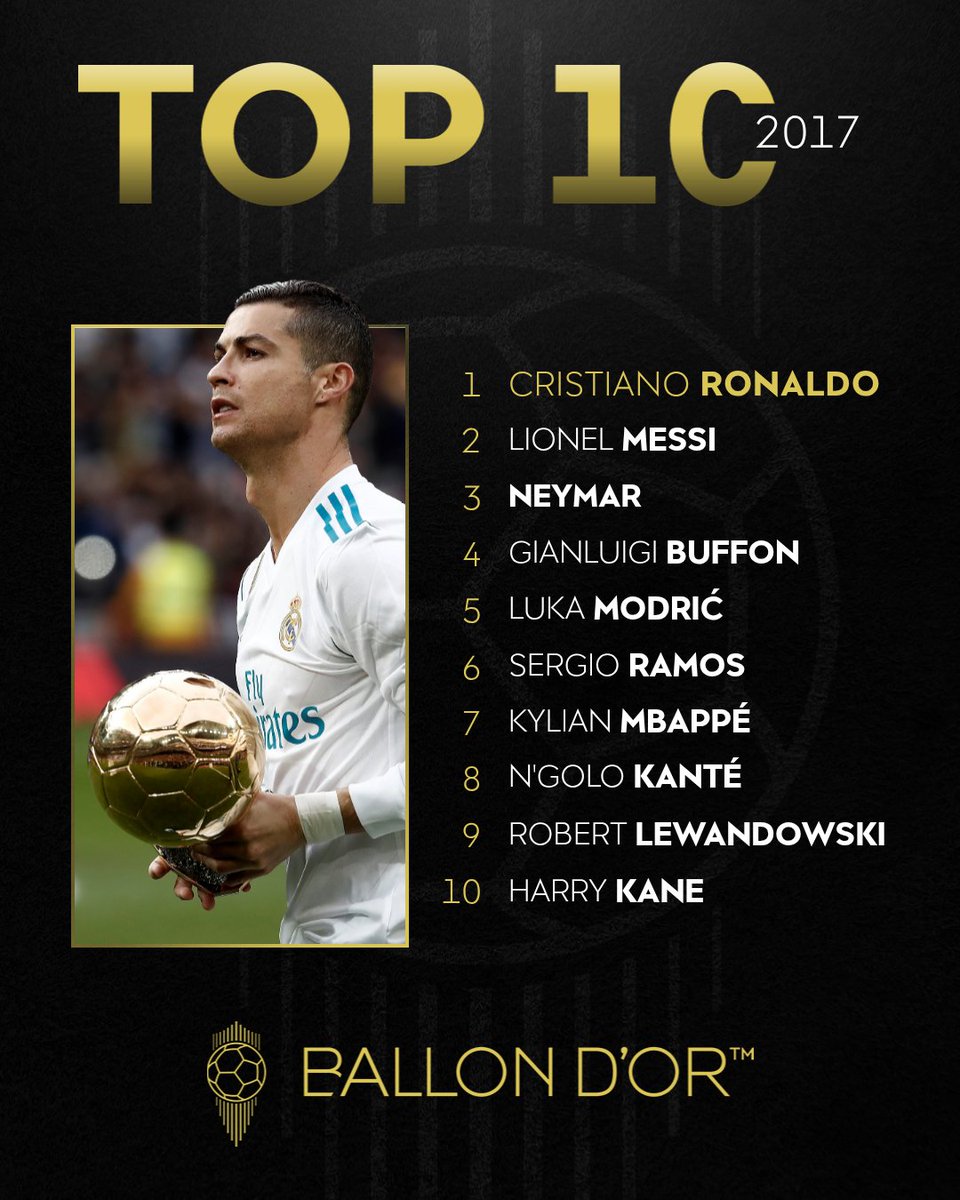
We still believe in the fairytale that Ribery deserved the 2013 BDO over Ronaldo?

22 Sep 2025

When people tell us Ousmane Dembélé is definitely winning the Ballon d'Or tonight, we show them this picture. 👀

1
1
24
2,100
22 Sep 2025
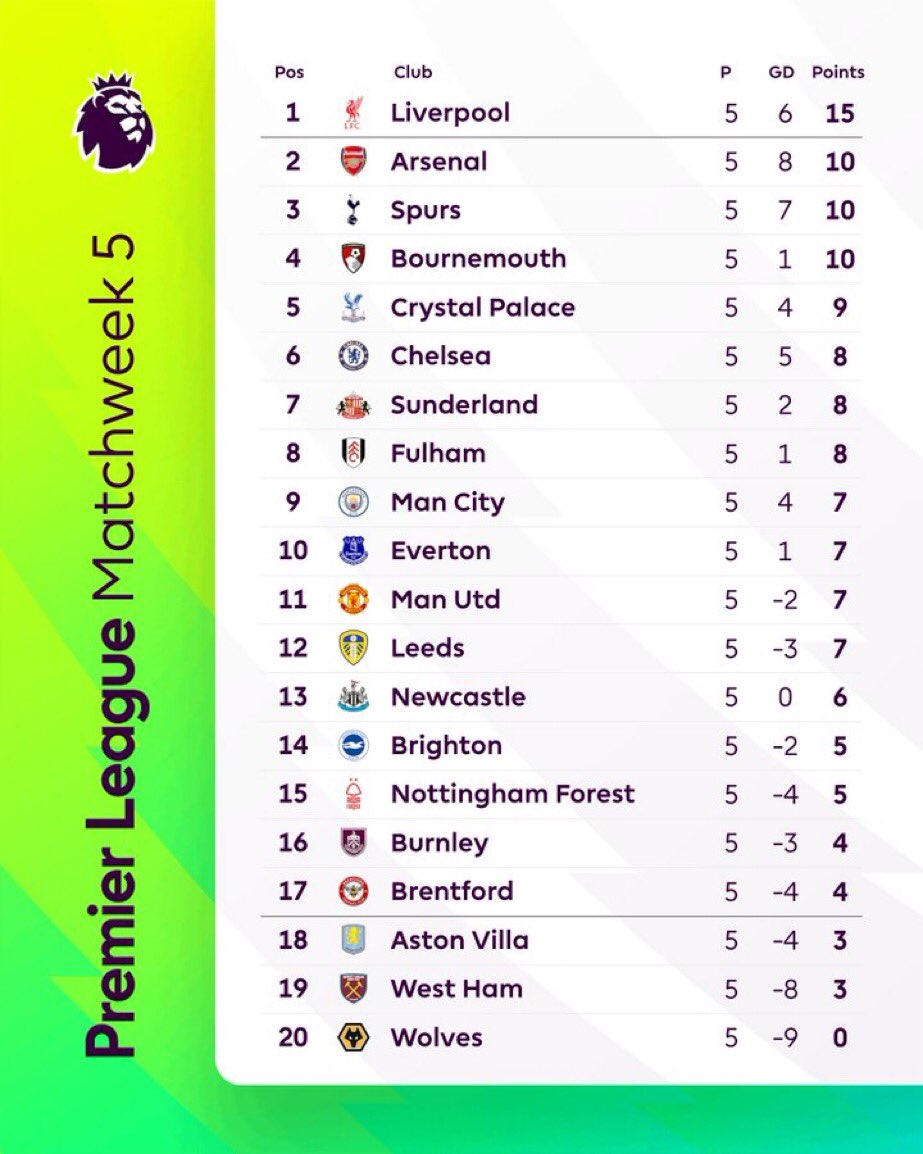
10th 💀
1
30
2,855
JAMES retweeted

22 Sep 2025
VIKTOR 🫱🫲 GYÖKERES
Com 63 golos em 58 jogos pelos Leões, @viktor_gyokeres conquistou o Troféu Gerd Müller, que elege o goleador do ano na gala do @ballondor 🏆

16
276
2,567
57,472
22 Sep 2025
Multiply his Ballon D’Ors count by 4x, because this organization hates him to the bone.
Against all odds. Against everything and everyone.
Cristiano Ronaldo dos Santos Aveiro. 🐐
2
9
136
3,237
22 Sep 2025
Fairs
22 Sep 2025

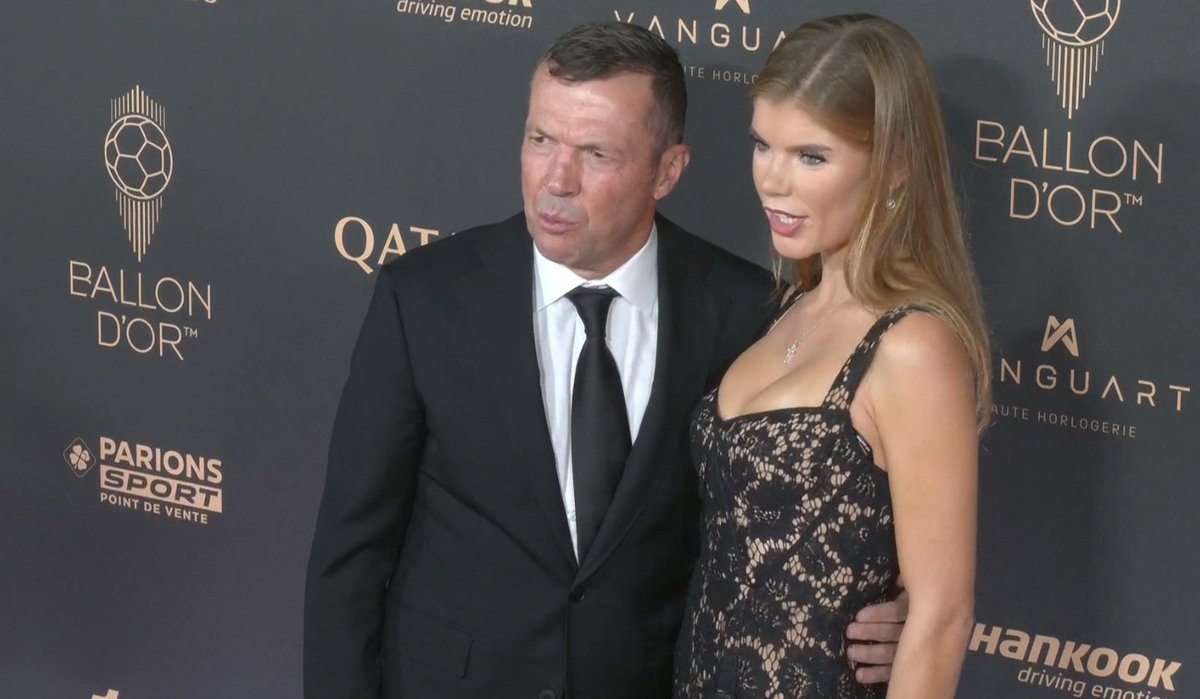
Lothar Matthäus (64) has arrived with his 26 year old girlfriend! 📸✨
1
2
30
25,214
22 Sep 2025
Football truly fell off

3
1
60
3,423
22 Sep 2025
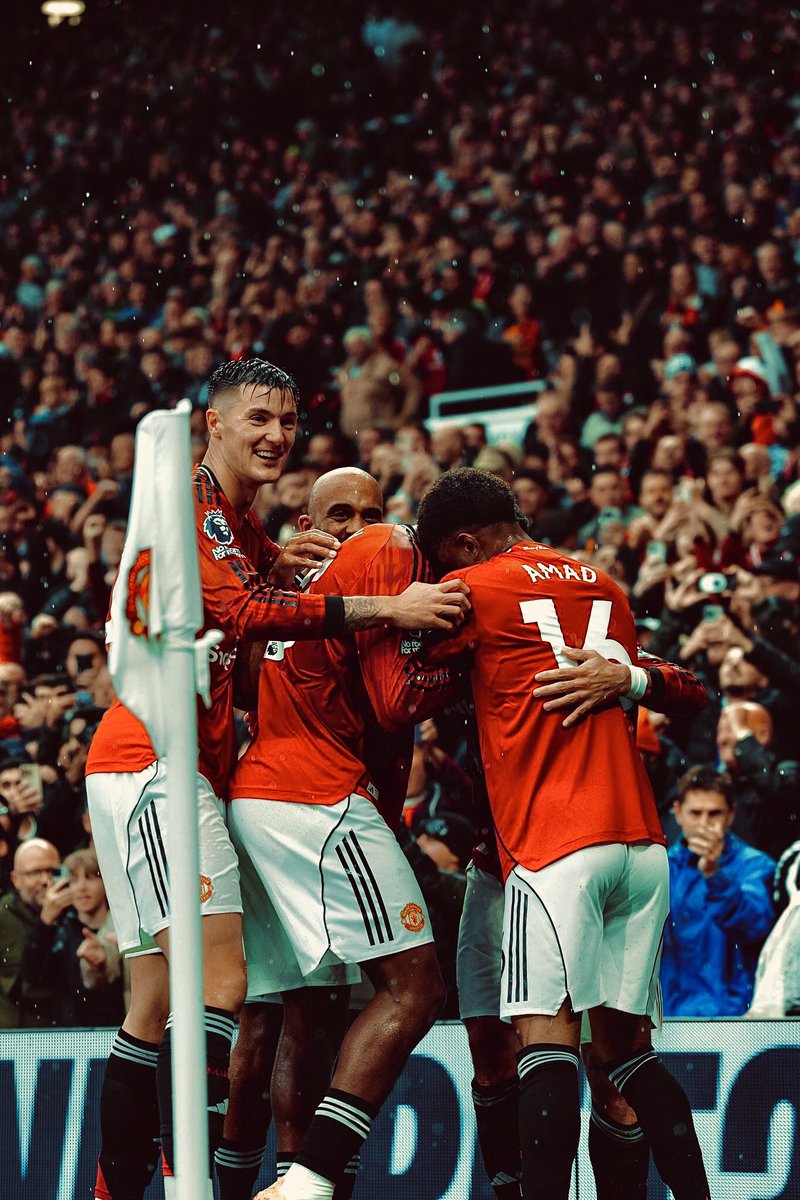
Don’t know if it’s true, but we’ll take it
We got a genius gaffer
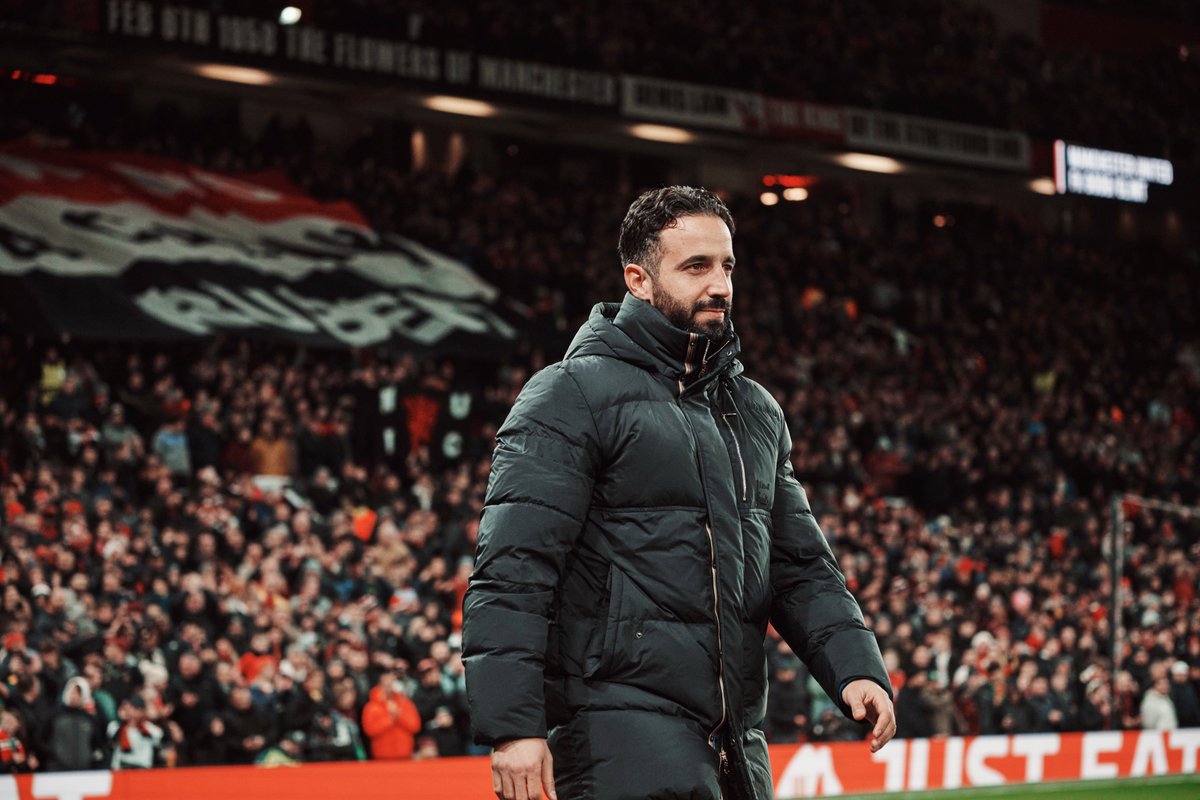
21 Sep 2025

I did my Uefa licenses with Amorim and he was by far the best on the course. He understood the game on a level that was different from everyone else around him.
Man Utd do not have a truly world class squad.
Give him time.
3
9
93
12,611
JAMES retweeted

21 Sep 2025
I did my Uefa licenses with Amorim and he was by far the best on the course. He understood the game on a level that was different from everyone else around him.
Man Utd do not have a truly world class squad.
Give him time.
21 Sep 2025
The worst side in Manchester United history are currently level on points with Pep Guardiola's team and just 3 points off Mikel Arteta's title challengers.
And they've played Man City, Chelsea and Arsenal. 👀
59
148
2,498
288,255
JAMES retweeted
22 Sep 2025
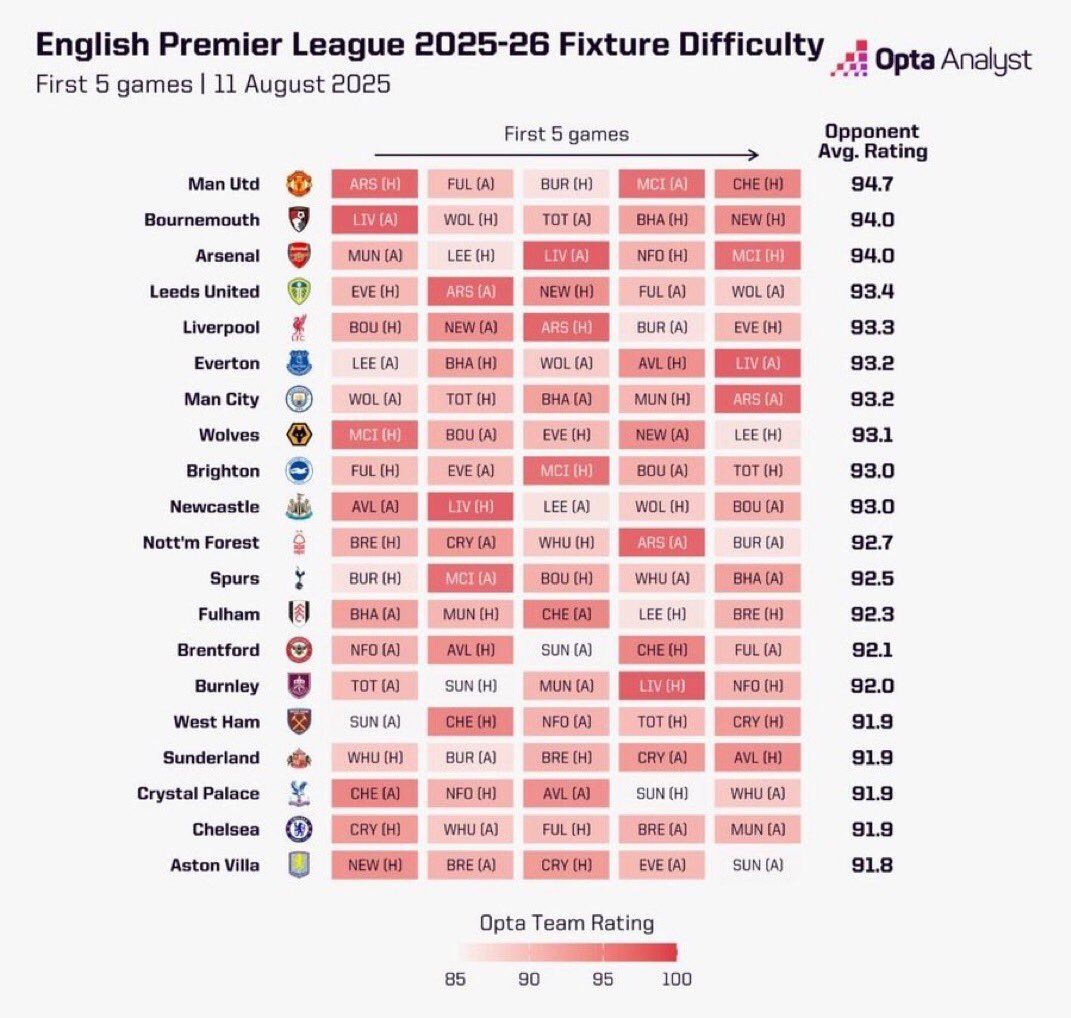
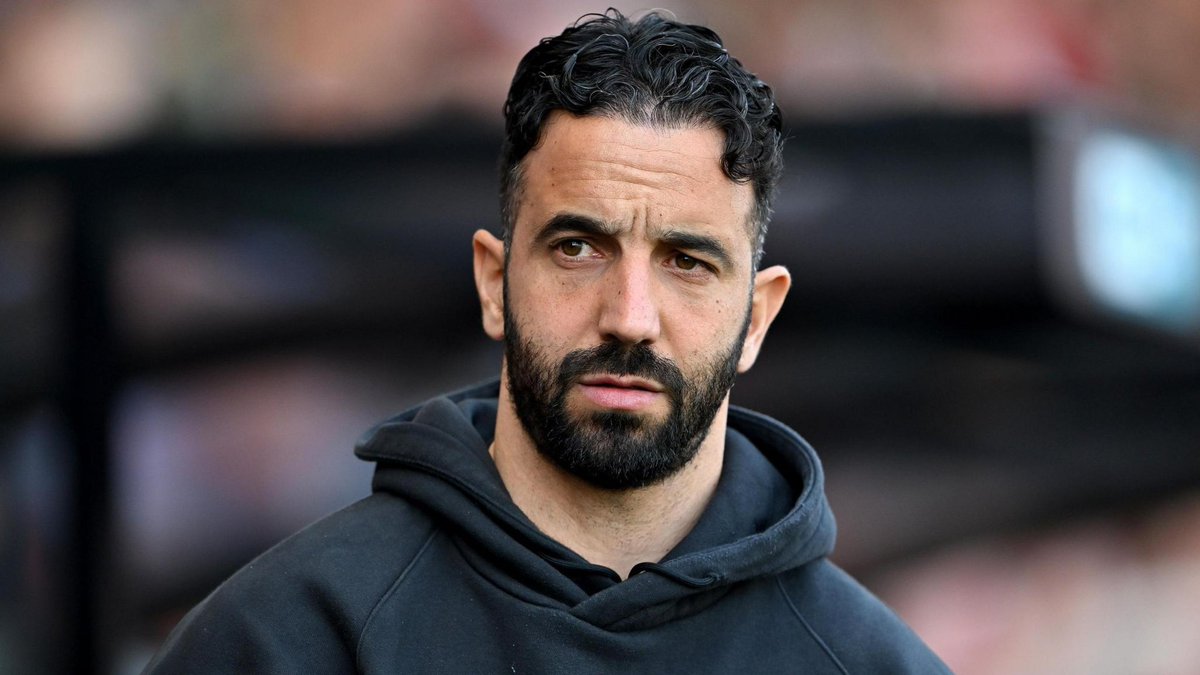
Per @OptaAnalyst, Ruben Amorim’s team had the most difficult fixtures with an average opponent rating of 94.7.
That context alone says a lot about @ManUtd still dominating a lot of metrics in the Premier League.
3 points off second place & 2 points off European Football.
Next-up: @BrentfordFC
1
4
23
5,161
22 Sep 2025
Premier League 25/26 updated data after GW5 📊
𝗘𝗫𝗣𝗘𝗖𝗧𝗘𝗗 𝗚𝗢𝗔𝗟𝗦 (𝘅𝗚):
1️⃣ Man Utd — 9.7
2️⃣ Man City — 9.3
3️⃣ Crystal Palace — 8.3
𝗦𝗛𝗢𝗧𝗦 𝗢𝗡 𝗧𝗔𝗥𝗚𝗘𝗧:
1️⃣ Liverpool — 23
2️⃣ Man Utd/Chelsea — 21
3️⃣ Man City — 20
𝗦𝗛𝗢𝗧-𝗖𝗥𝗘𝗔𝗧𝗜𝗡𝗚 𝗔𝗖𝗧𝗜𝗢𝗡𝗦:
1️⃣ Man Utd — 145 (29.00 p90)
2️⃣ Liverpool — 126 (25.20 p90)
3️⃣ Bournemouth — 122 (24.40 p90)
𝗧𝗢𝗨𝗖𝗛𝗘𝗦 𝗜𝗡 𝗢𝗣𝗣. 𝗕𝗢𝗫:
1️⃣ Arsenal — 150
2️⃣ Tottenham — 144
3️⃣ Liverpool — 142
(Man Utd is #4 with 138 touches)
𝗣𝗥𝗢𝗚𝗥𝗘𝗦𝗦𝗜𝗩𝗘 𝗖𝗔𝗥𝗥𝗜𝗘𝗦:
1️⃣ Liverpool — 124
2️⃣ Arsenal — 117
3️⃣ Man Utd — 111
𝗦𝗛𝗢𝗧𝗦 𝗣𝗘𝗥 𝟵𝟬 𝗠𝗜𝗡𝗨𝗧𝗘𝗦:
1️⃣ Man Utd — 15.80
2️⃣ Liverpool — 14.00
3️⃣ Bournemouth — 13.40
𝗧𝗔𝗖𝗞𝗟𝗘 𝗦𝗨𝗖𝗖𝗘𝗦𝗦:
1️⃣ Sunderland — 69.7%
2️⃣ Fulham — 66.7%
3️⃣ Man Utd — 65.1%
70
420
4,163
318,941
22 Sep 2025
Per @OptaAnalyst, Ruben Amorim’s team had the most difficult fixtures with an average opponent rating of 94.7.
That context alone says a lot about @ManUtd still dominating a lot of metrics in the Premier League.
3 points off second place & 2 points off European Football.
Next-up: @BrentfordFC
1
4
23
5,161