
Joined September 2025
- Tweets 180
- Following 37
- Followers 32
- Likes 338
12 Photos and videos


Pinned Tweet

May 26
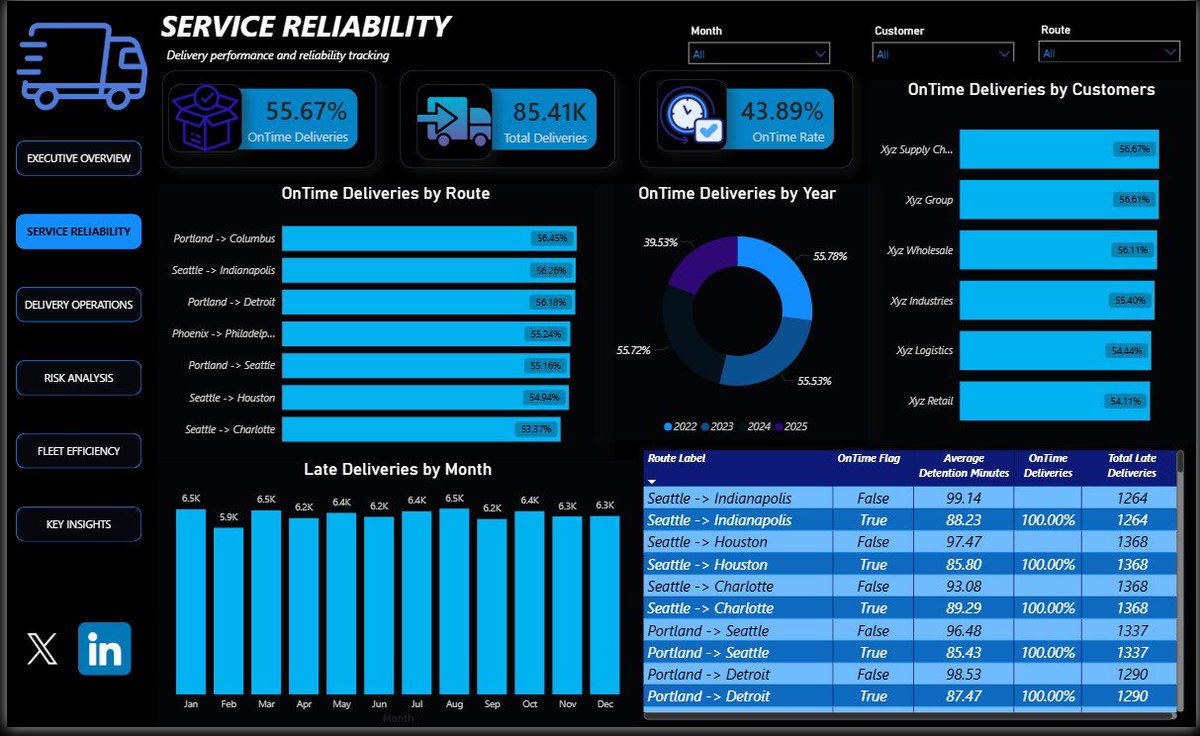
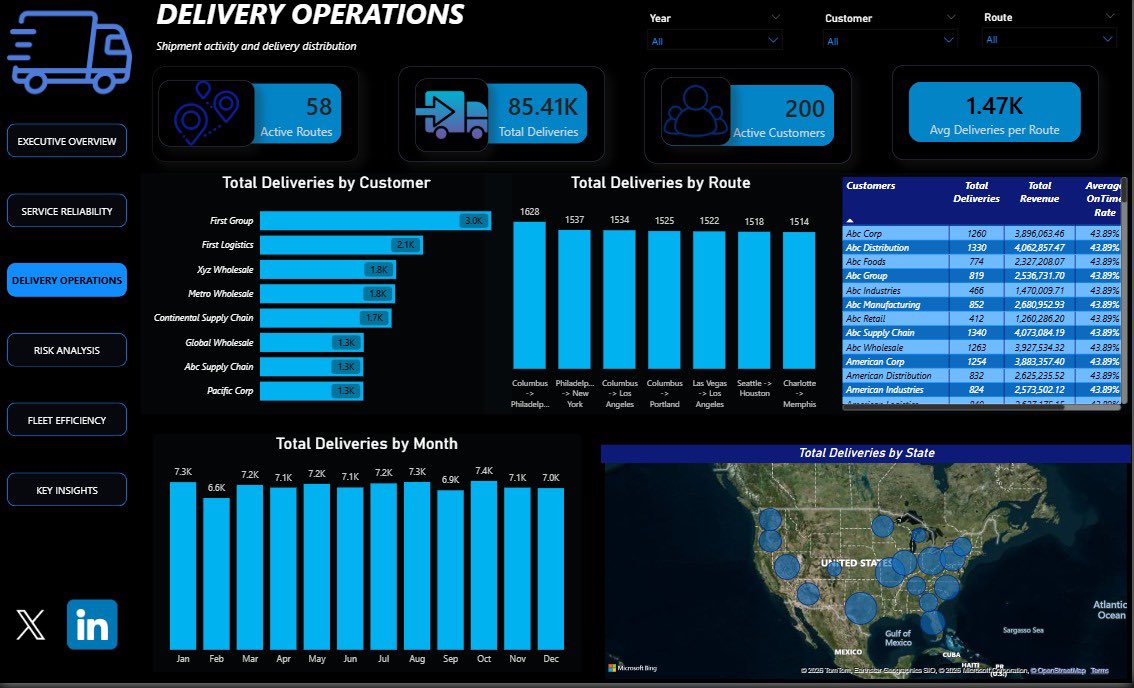
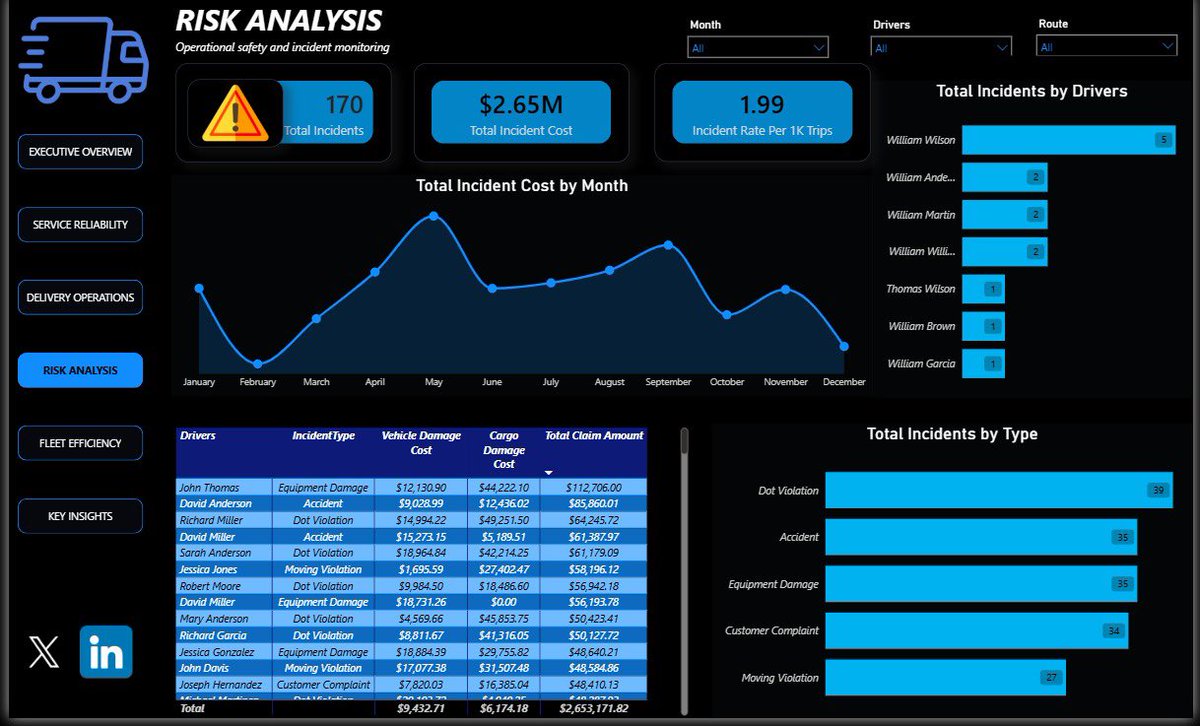
Finally completed my Capstone Project with @TechSphereAcad
I saw 14 tables and how voluminous the dataset was and I told myself I’ll keep the dashboards simple and clear. And I think I did just that.
Thank you @ezekiel_aleke for tutoring me, you’re amazing.👏🏽👏🏽
#DataAnalytics

2
2
20
275
Jun 14
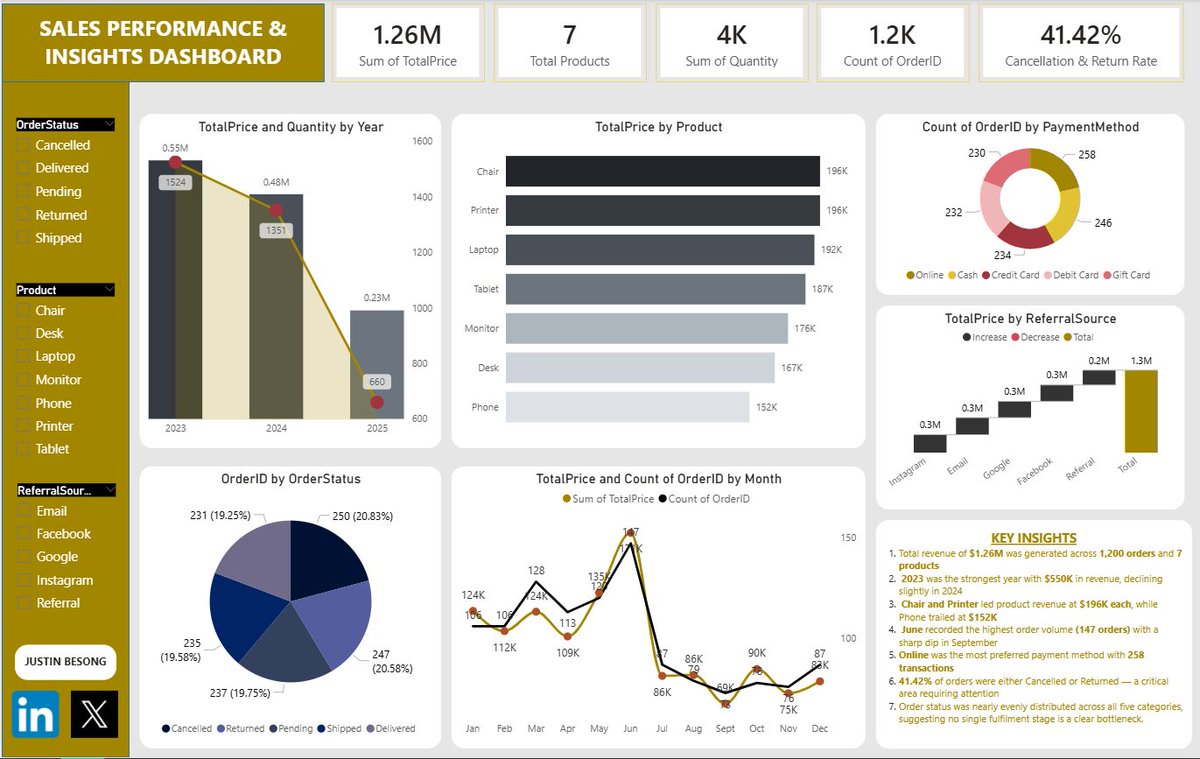
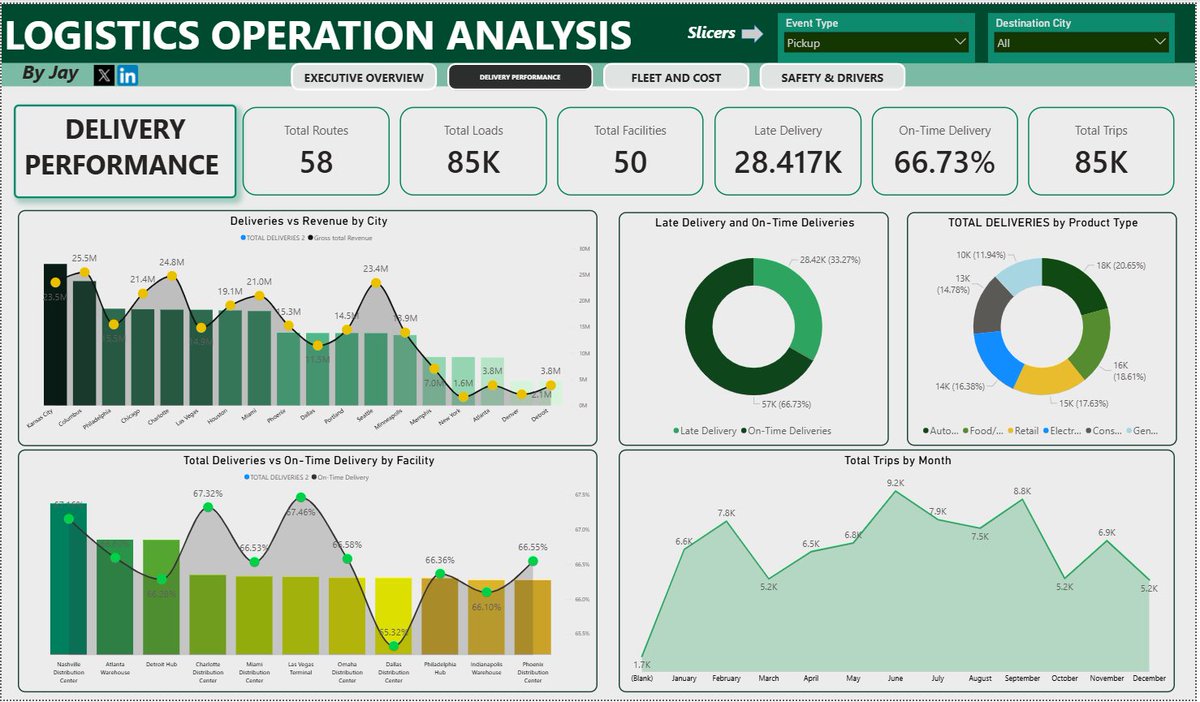
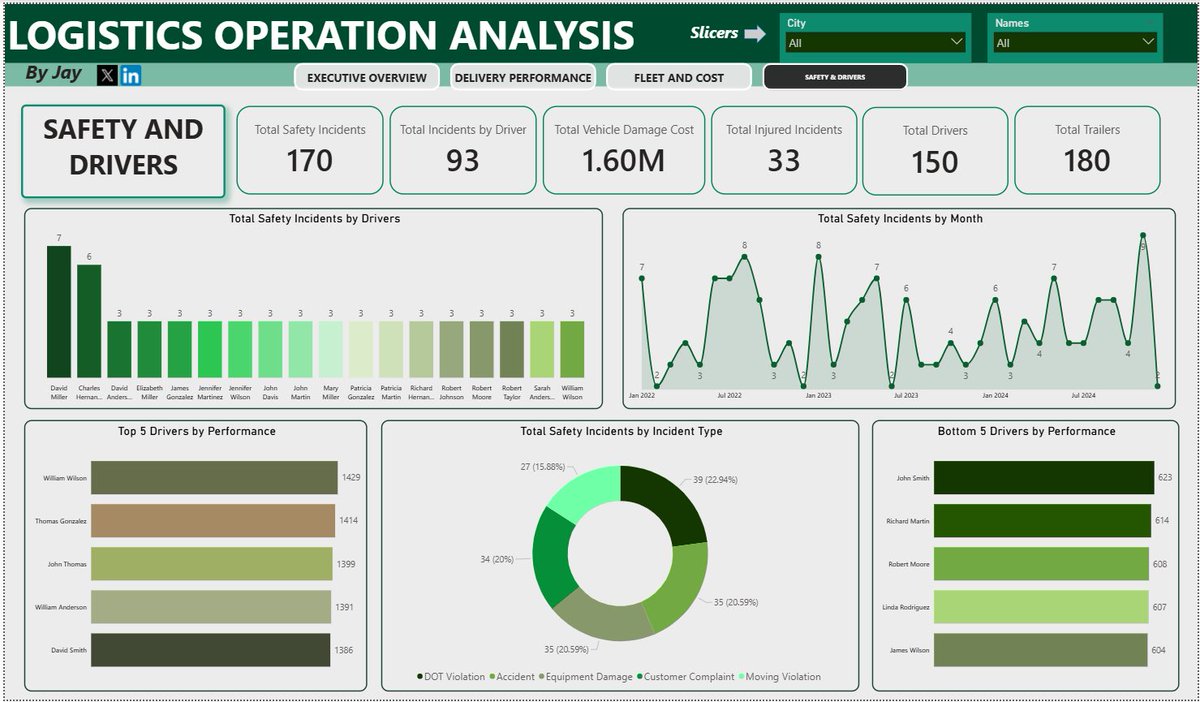
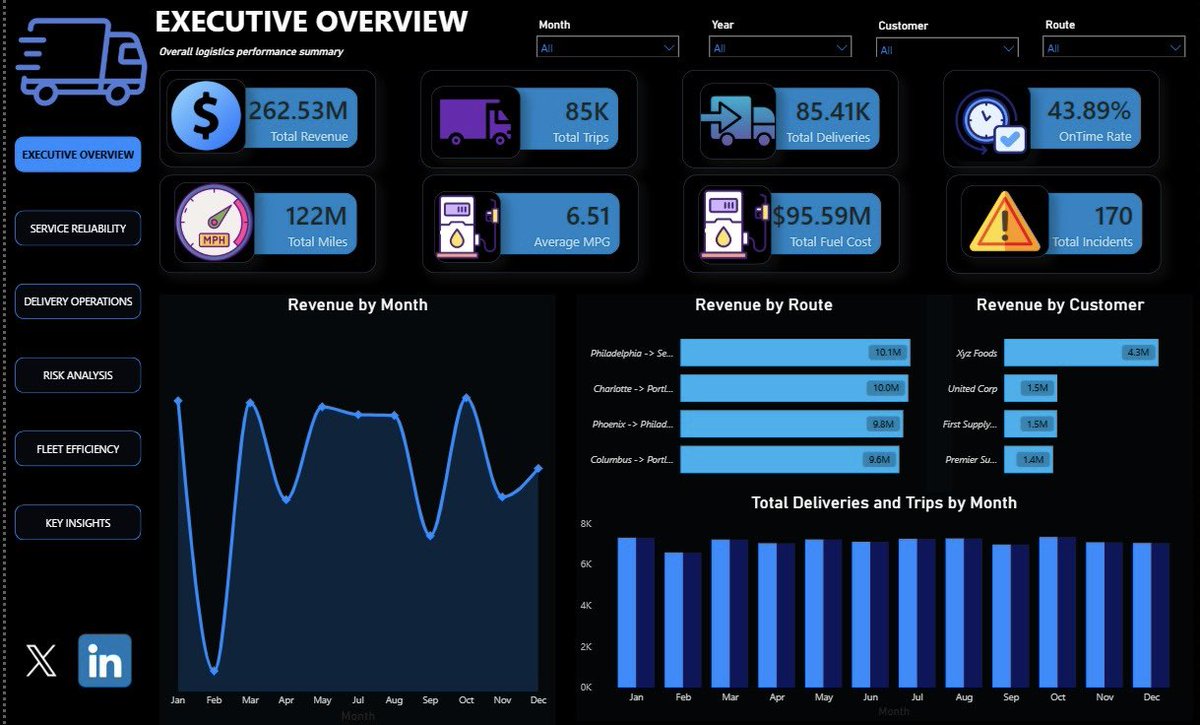
Built this interactive sales performance & insights dashboard for my internship at DecodeLabs!
Tool used: Power BI
1
8
Jun 14
I had completed my internship with DecodeLab but forgot to record my progress here so, here we go!
I really enjoyed this one.🕺
#DataAnalyst


3
1
14
Jun 14
Task 4 — Power BI Dashboard Built a Sales Performance & Insights Dashboard with 5 KPI cards, 6 visuals and custom DAX measures. Key finding — 41.42% of orders were Cancelled or Returned.
7
Jun 14
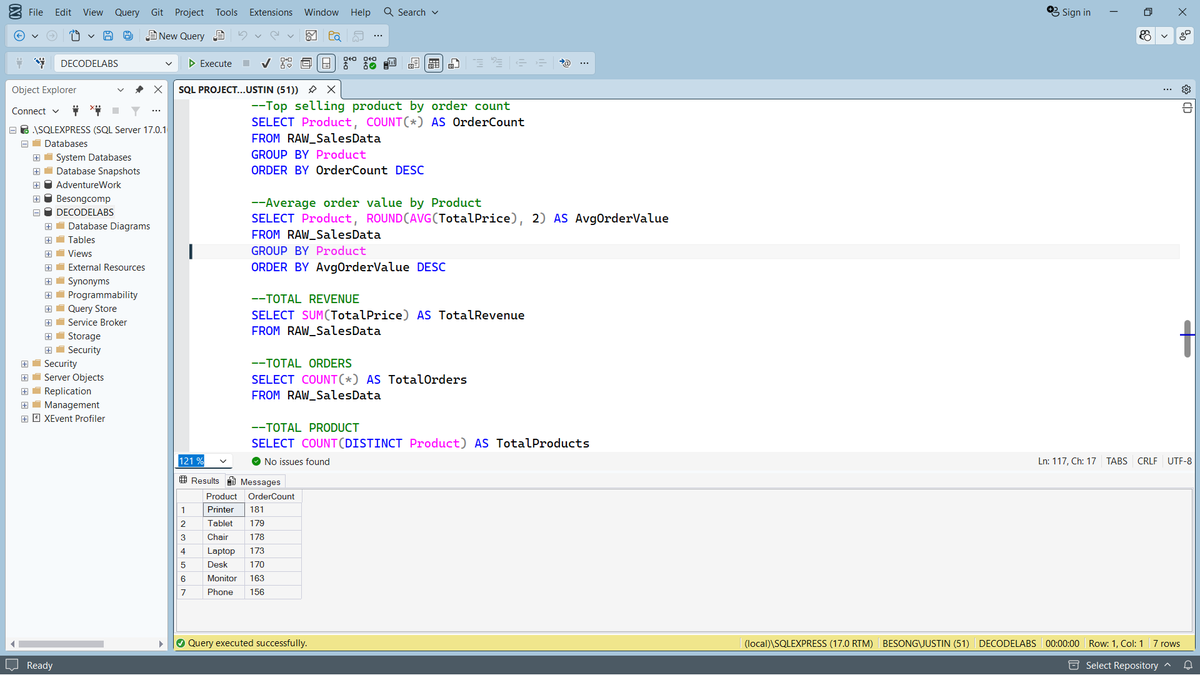
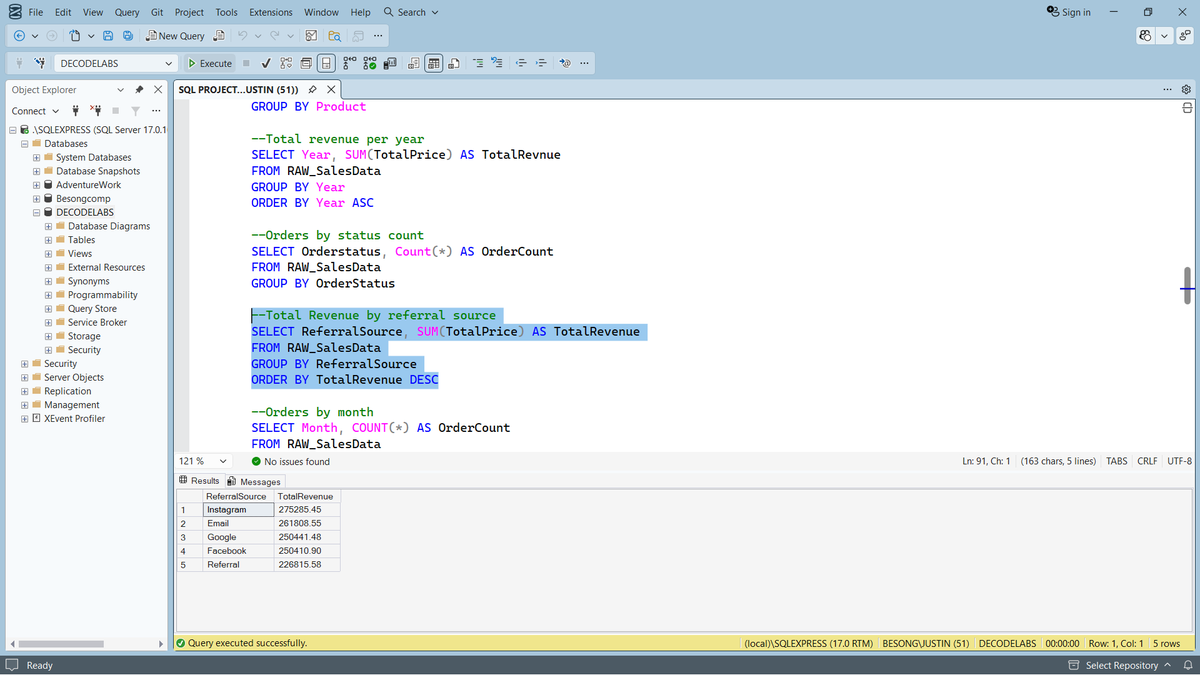
Task 3 — SQL Data Analysis
Cleaned the raw dataset in SSMS — handled NULLs, extracted Month/Year from dates, fixed data types. Then extracted insights using SELECT, WHERE, GROUP BY, ORDER BY and aggregations.
5
Jun 14
Task 1 — Data Collection
Loaded an e-commerce dataset of 1,200 orders across 7 products and understood its structure: columns, data types, missing values and what the data represents.
1
10
Jun 14
Task 2 — Excel EDA
Performed exploratory data analysis using SUMIF, COUNTIF, QUARTILE and more. Uncovered trends across months, products, and referral sources. Detected 8 outlier orders using the IQR method.
60
Jun 11
Exponential growth is never sudden even though it might appear that way; it is a function of daily tiny additions that are almost invisible.
Just keep showing up.
3
Totally forgot to post this video of my Capstone project. There’s a lot more to improve on but I absolutely love the work I did here.😌
May 26

Finally completed my Capstone Project with @TechSphereAcad
I saw 14 tables and how voluminous the dataset was and I told myself I’ll keep the dashboards simple and clear. And I think I did just that.
Thank you @ezekiel_aleke for tutoring me, you’re amazing.👏🏽👏🏽
#DataAnalytics
2
18
Jay_Analyst retweeted

After a few days away, I'm back and picking up right where I left off.
Honestly, this week has been really stressful but I finally have the chance to sit down and share this 😅
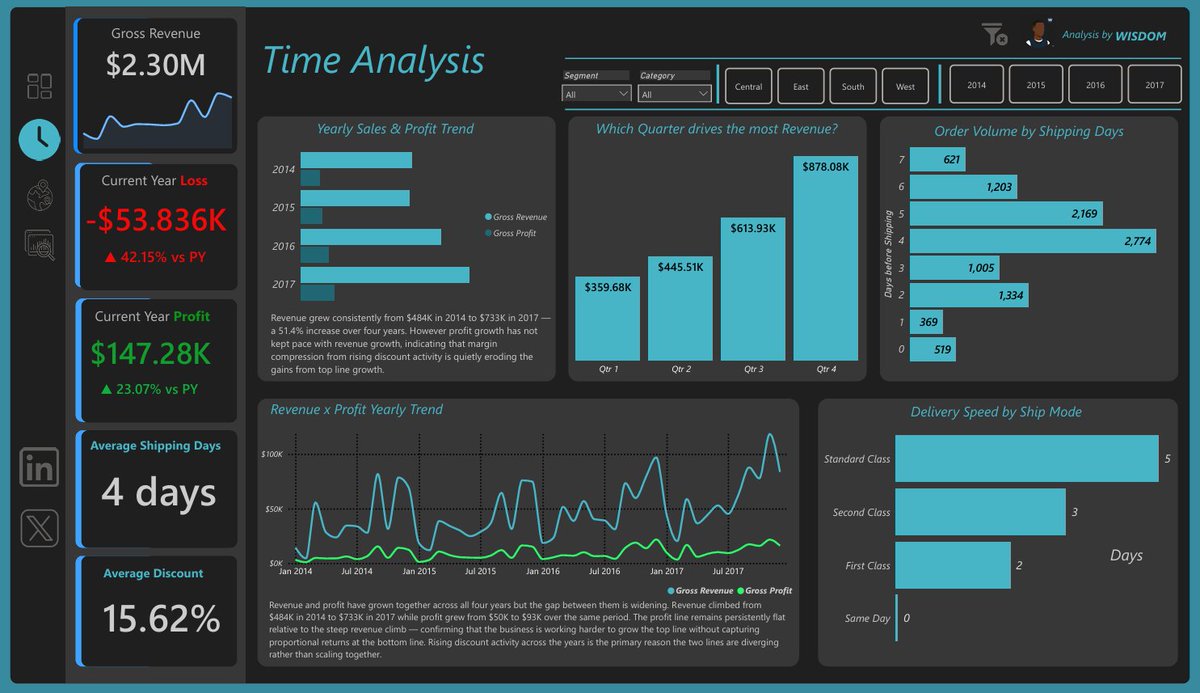
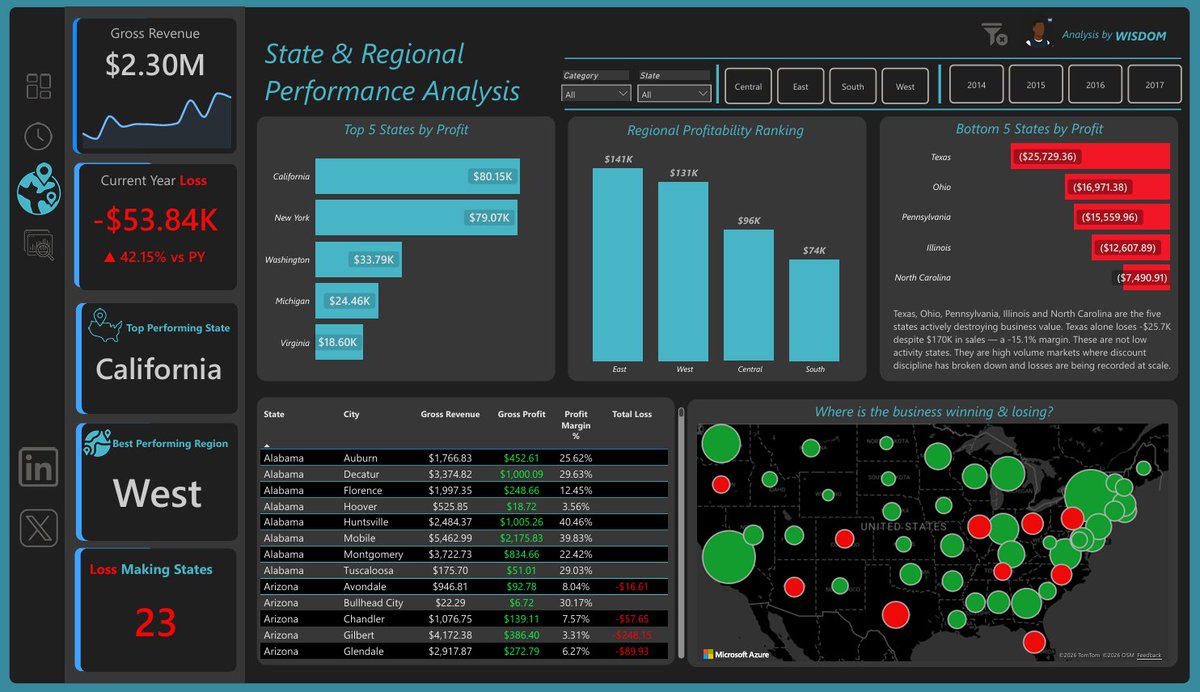
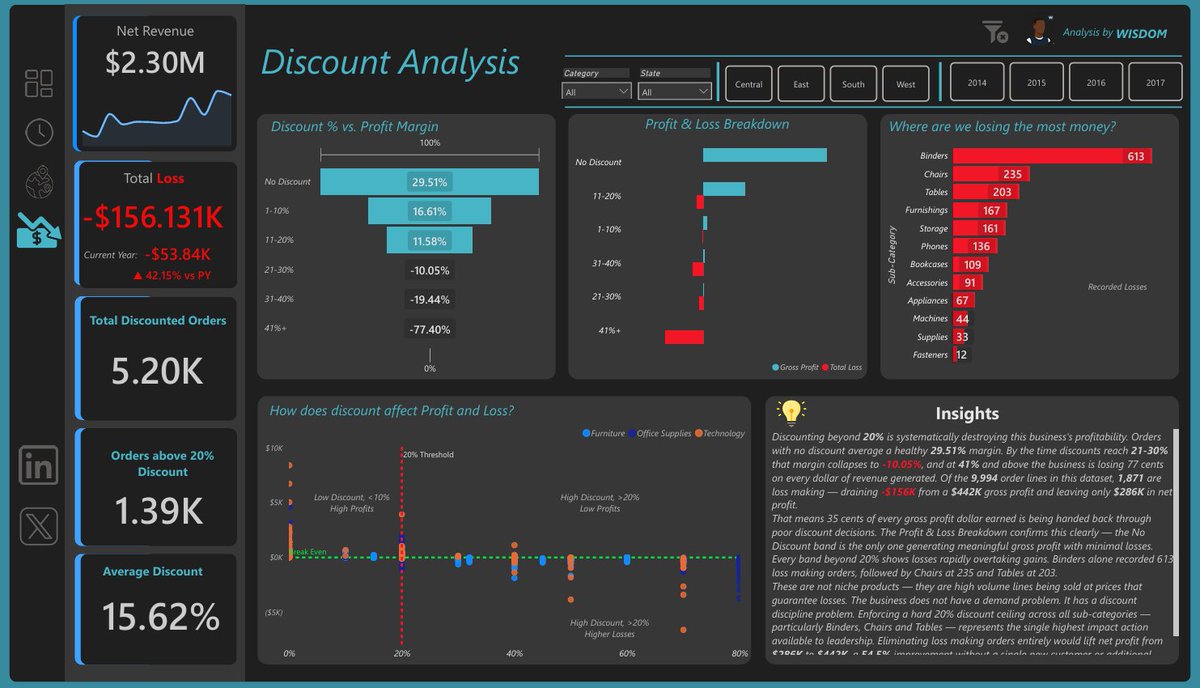
I completed a 4-page Power BI dashboard on the Sample Superstore dataset — and these are my findings👇

22
12
62
3,777
Jay_Analyst retweeted

Jun 3
finished this capstone over a week ago and almost kept it to myself because I didn’t like how the dashboard turned out.😭
In my defense, i was trying something new and it didn’t come out exactly how I imagined. but a friend convinced me to share it yesterday
What do you think?
May 25

Submitted my capstone project!!! 😭✨
24
10
125
4,435
May 26
Done and dusted. The Almighty Capstone Project.
Thank you, Jesus.😭😭
May 26
Finally completed my Capstone Project with @TechSphereAcad
I saw 14 tables and how voluminous the dataset was and I told myself I’ll keep the dashboards simple and clear. And I think I did just that.
Thank you @ezekiel_aleke for tutoring me, you’re amazing.👏🏽👏🏽
#DataAnalytics
1
1
8
92
Jay_Analyst retweeted

May 26
Sometimes the insight is obvious. Sometimes you rotate the chart 14 times first 😭
3
6
1,919
May 25
After what I’ve seen with this Capstone Project, I’ll never leave things for deadline day anymore.😔
12
May 25
Me and my Capstone Project.🤲🏽😭
May 25

Once you decide to start learning tech, 24 hours will suddenly start feeling like 4 hours 😭
1
1
126
May 25
I feel absolutely the same way.❤️
May 25

I genuinely enjoy data analytics because solving one issue feels like defeating a final boss.
1
1
15
May 25
My knowledge of UI/UX has really helped me in data visualisation, especially in building dashboards.
1
20