
Joined July 2015
- Tweets 516
- Following 773
- Followers 751
- Likes 471
175 Photos and videos


Today #Avalon #Technology made a Life Time High of 1777 ⬆️ 85% Stupendous Returns
Had entered on 30th March @ 963 and booked at 1625 with excellent 68% gains in 3 months
Company continues to do well but at 104 PE and 44% Promoter Holding - I feel the company is extremely richly valued.
Though it will continue to grow at 40-50% CAGR.
Fundamentally company is excellent and should continue to do well.
But Before I bought it at 963 the company traded at same valuation since 30 Nov 2024 to 30 March 2026 ie 1.4 Yrs.
So ->
If you want to invest in a 3-4 year story that’s promising 50-70% CAGR, one must enter at reasonable valuation.
If not, there is a 80% probability, you will feel stuck and sell it somewhere out of frustration saying that the price doesn't move.
Some stocks stay at same levels for months and then there are weeks where you get 30-50% moves
Best example is recently listed #Blue #Water #Logistics
It stayed at same value of 140-150 for an year from June '25 at listing to Mar '26
It then delivered 100% gains (27-Apr to 15 Jun) and today trades at 330
Same is applicable for #GSM #foils too which is a consistent performer
Going up and growing everyday is not possible 👍🏻
Mar 30

Avalon Technologies @ 963
- Management has significantly raised the full-year FY26 revenue growth guidance to ~40% (up from 28%–30%).
- This reflects the sixth consecutive quarter of sequential improvement and strong momentum in the high-margin industrial and mobility segments.

88
Significand and continuous stake addition by #PNGS #Reva management since last few months at an average price of 370/share.
39.76 cr worth purchase for a 1200 cr Market Cap company.
Increased stake by ~ 3%
REVA IPOed at 386 per share and made a 52 week high at 467 and 52 week low at 324
#PNGS #REVA @ 450
1400 cr M Cap
17 PE
Comparing #Gargi & #Reva
- Growth for Gargi has now consolidated but lot of headroom is visible for PNGS Reva
- Valuation comfort 32 PE vs 16 PE
- Excellent quarterly update where Q4 revenue grew by 96.9% ie almost 100% YoY
- Akshay Tritiya sales ⬆️ 267.49% 2.67 Times YoY
- EBO - 2nd Exclusive Brand Outlets opened on 15 march 2026 1st was opened on 4 Sept 2025
- Both together contributed to Rev of 6.87 Million


2
465
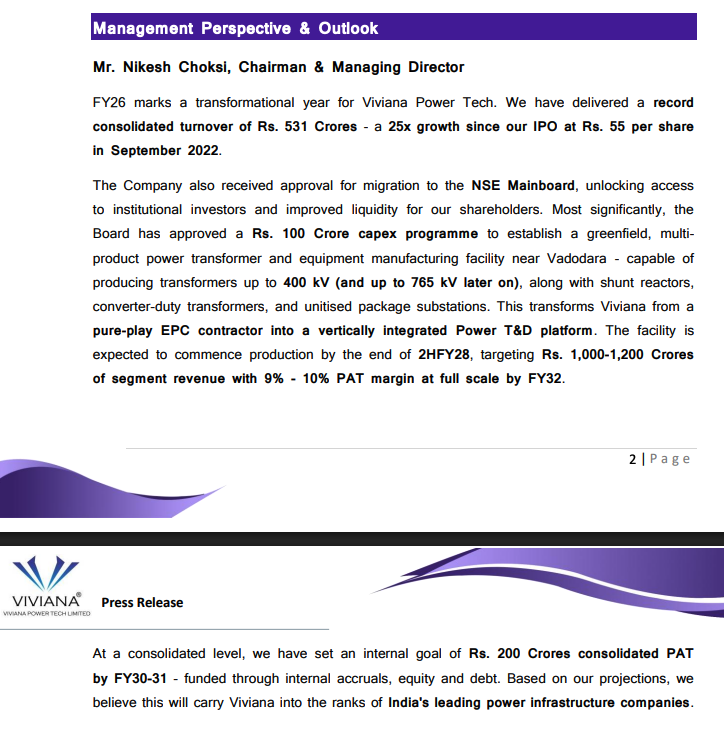
Viviana Power @ 885
Interesting play lined up
- Good company in Power T&D Enterting Transformer Manufacturing BESS
- Shifted to Mainboard from SME
Available at 16x multiple
- ₹950 Cr order book including BESS opportunities.
- ₹1,240 Cr active bidding pipeline
- ₹100 Cr capex approved for greenfield transformer manufacturing facility.
- Planned manufacturing capability up to 765 kV (phased).
- Expanding from pure EPC to vertically integrated power equipment platform
- Looks well positioned to meet its FY27 guidance of a PAT of Rs. 80-90cr.
- Closed FY 26 at 50 cr PAT & FY 25 at 17 cr PAT
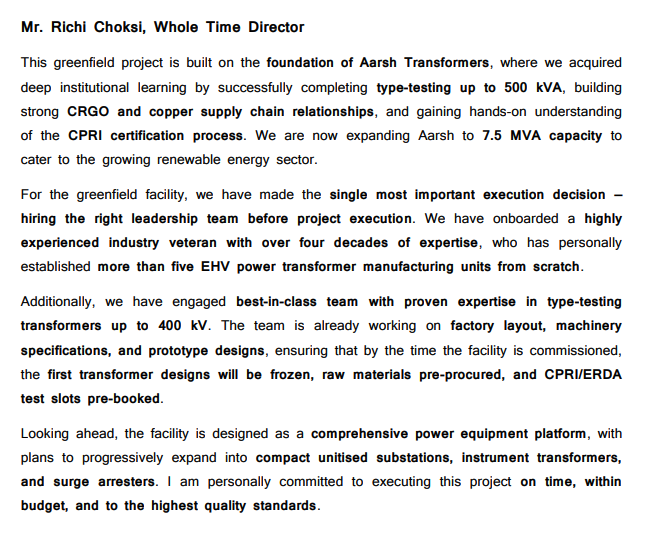
- Aarsh Transformers should start delivering from FY27 with push to develop high-rated transformers in coming years
Jun 8

Viviana Power : Quite an interesting development. Expanding into power equipment segment by building on experience gained on Arsh Transformer. Vertical integration into premium segment of transformer market and other power equipment products like shut reactors, Data Centre transformers and with good talent already hired.
With FY27 guidance of Rs.80cr PAT, trading at 11x on FY27 on mainboard.
With the pivot into power equipment and niche segment of transformers, should command better valuation multiple in coming years.
2
13
1,971
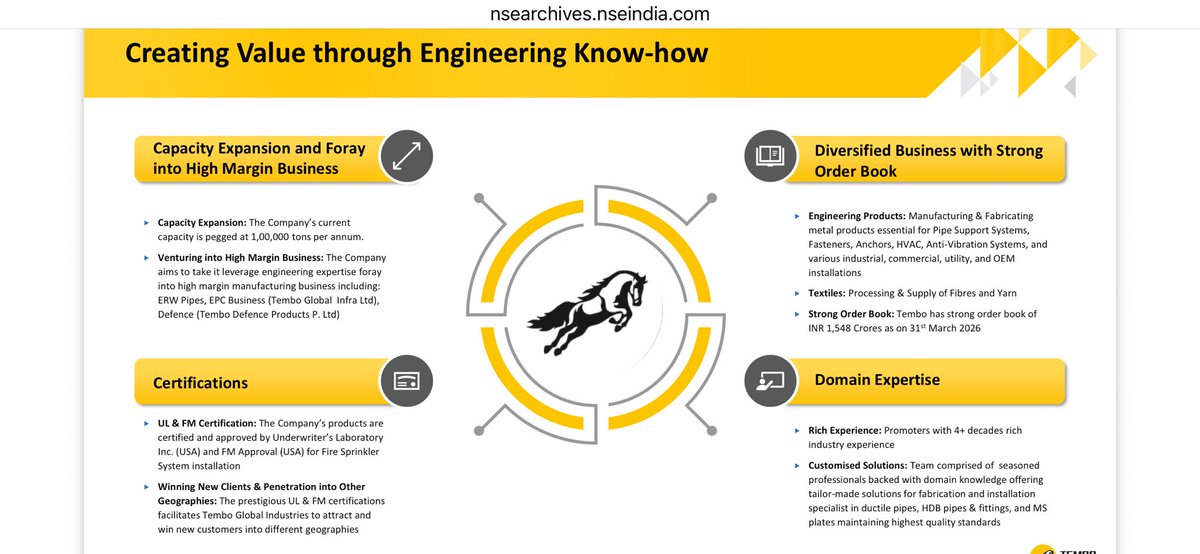
#Tembo #Global Industries @ 600
Con-call Highlights
Management targets a 30% to 40% topline growth to hit roughly Rs 1,600 crore in FY27.
Core growth will be led by scaling the Engineering Solutions and EPC operations.
Group PAT margin is targeted at 10% - 12%.
Engineering and EPC segments aim for 12% to 14% margins.
Group EBITDA margins are expected to remain above 13%, but achieving the 10% to 12% PAT target requires an eventual expansion to 17% to 18% EBITDA margins which will be possible after the defence vertical starts billing.
Revenue mix is 60% Engineering Products and 40% Textiles with 88% Domestic and 12% Exports.
Fluctuations in oil and gas prices do not affect operations.(War)
Order book at Rs 1,548 crore, coming entirely from the Engineering Solutions and EPC division.
Bidding pipeline stands at over Rs 2,256 crore.
Additional pipeline opportunities exceed Rs 700 crore across civil, MEP, and HVAC for port construction and fuel farms.
The company is the L1 bidder for a Rs 300 crore offshore revamp project in Kuwait.
Planned debt addition for FY27 is Rs 300 to 350 crore.
This debt will fund upcoming CAPEX for the solar power vertical and defense manufacturing, as well as general working capital.
Solar - 28 total sites with a capital expenditure of Rs 600 crore, of which Rs 300 crore is already deployed.
Currently, 7 to 8 sites are close to commissioning, with the remaining balance finishing over the next 3 to 4 months.
All 28 sites are targeted to be fully operational by the end of Q2 FY27.
Commercial operations will start in Q3 FY27, providing a stable and diversified revenue stream.
No revenue from defense in FY26.
Co has secured a small arms manufacturing license on December 31, 2025, and an ammunition license on April 19, 2026.
An NDA was signed with a leading Indian defense PSU for collaborative design, development, and production.
Initial defense operations focus on small arms, with ammunition rolling out over 3 years with an Austrian multinational with agreed complete buy back for 5 Years
Defence revenue is projected to hit a 5% to 10% share of total revenue in H2 FY27 with lucrative segment margins of 30% to 35%.
Commercial production begins in Q4 FY27.
The first full year of operations in FY28 targets a Rs 300 to 400 crore topline and a PAT of Rs 170 to 180 crore.
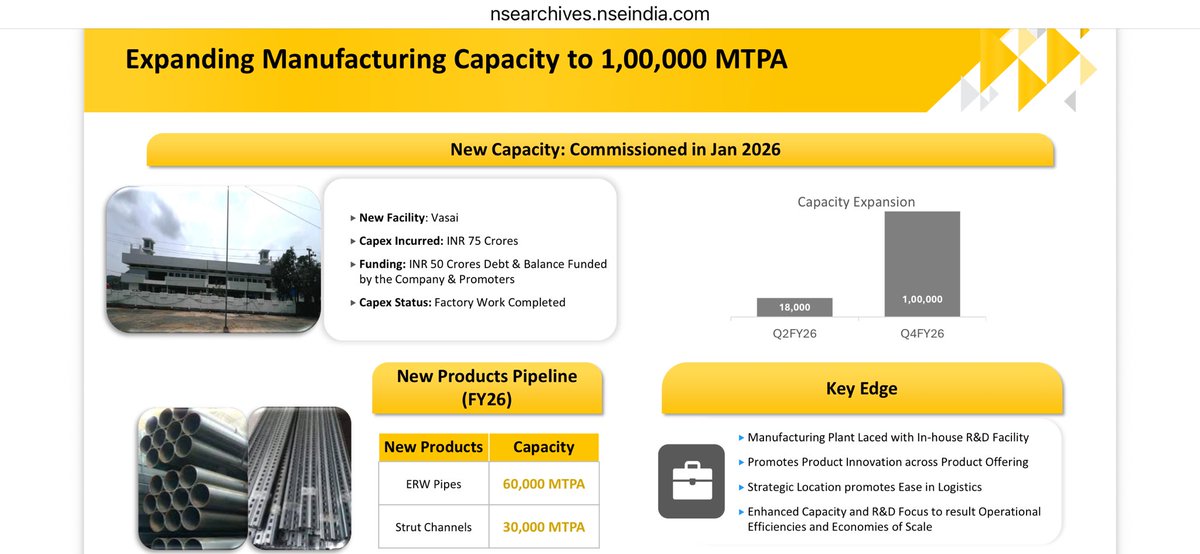
Facilities at Vasai-Thane currently run two full shifts to handle daily order inflows.
A massive ramp-up to expand capacity from 18,000 MTPA to 1,00,000 MTPA was initiated in January 2026.
Delay : the Mazar JV project in the Middle East is facing delays and is on a slow track.
Management anticipates execution pace will pick up in Q3 FY27.
AIM / TARGET: The company has set a long-term revenue target of Rs 20,000 crore by the year 2030
Q4 Performance
FY26: Consolidated revenue rose 28.9% year-on-year and 41.1% quarter-on-quarter to Rs 354.33 crore.
Net profit grew 105.1% year-on-year and 15% sequentially to Rs 30.07 crore.
FY26 Performance
Annual sales grew 46.7% to Rs 1,090 crore.
Net profit surged 79.7% to Rs 98 crore.

2
9
721
#GSM #FOILS @ 210
Watch out some videos of the Manufacturing Facility at Mumbai and Ahmedabad
Both the plants look amazing 👍🏻
Mumbai - Vasai Plant
youtu.be/HPcRiwqBF4c?feature…
Ahmedabad Plant
youtu.be/rIHd953KQ6Y?feature…
Apr 14
#GSM #FOILS @ 197
Market Cap 278 cr
Ahmedabad Plant - newly commissioned 17,000 sq. ft. facility with a 10,000 MT annual capacity.
Currently at 20–30% utilization &
targeting 40–50% by March 2026 & 100% by FY27
Monthly sales have already hit
₹5–6 crore
Projected to reach
₹10–12 crore at 50% utilization and
₹25–30 crore at full capacity in FY27
Vasai Plant - Currently operating at 85–87% utilisation
Minor capex is underway to de-bottleneck and reach 100% utilization in FY26.
Expected monthly revenue ceiling of ₹28–30 crore
Future Plans: Active evaluation of a third unit near Vasai is ongoing, with a decision expected by mid-2026.
Co. operates on a "metal pass-through" model linked to Hindalco’s monthly weighted average prices.
Management tactically adjusts inventory levels around the 15th of each month based on aluminum price trends to protect or enhance spreads.
The Ahmedabad facility is expected to be more cost-efficient, potentially providing a 100–200 bps improvement in margins as it scales.
While focused on core blister/strip foils for now, the company plans to move into higher-margin laminates / multi-layer structures in FY27.
Co. is intentionally avoiding Tier 1 pharma giants that demand 120–150 day credit terms and low margins via tenders.
Focus remains on "A or B " grade customers who offer better margins and shorter payment cycles approx 30–60 days.
Growth is fueled by keeping higher stock and debtors.
Co. explicitly prioritizes growth economics over CFO, noting that negative CFO is a byproduct of their current expansion phase.
Transparency - Notably high for an SME, practicing quarterly results and monthly sales disclosures.
Mainboard Migration: Targeted within the next 1.5 to 2 years
100% of the proceeds from the recent issue have already been deployed.
Execution Risk: The ramp-up speed at Ahmedabad is the primary driver for FY26/27 performance
CFO Volatility: Investors should expect continued negative cash flows as long as the company aggressively builds inventory and debtors to support revenue growth.
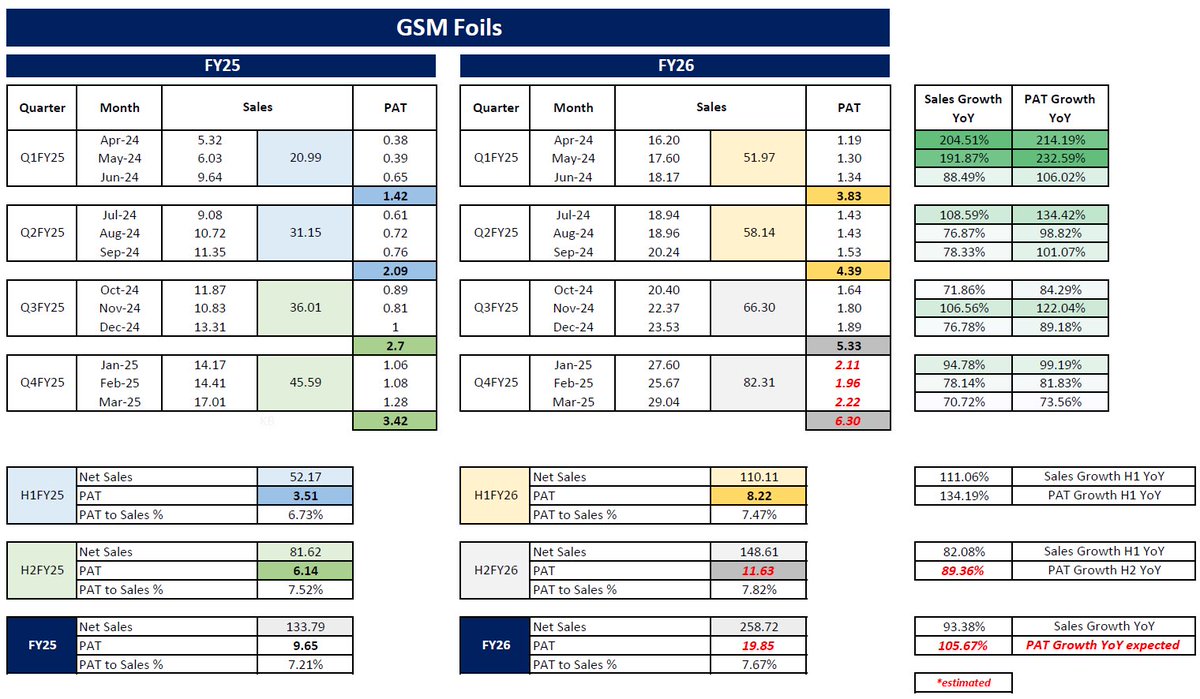
Attached is the YoY comparison of Monthly Sales and PAT.
Based on the exchange disclosures made around 5th of each month.
Figures in red indicate expected PAT
Q4 PAT expected at around 6.3 cr which is 85% YoY growth.
H2 FY26 expected at 11.63 cr indicating 89% YoY growth.
Full Year expected at 19.85 cr, which if delivered will indicate 105% YoY PAT growth.
1
8
967

May 29
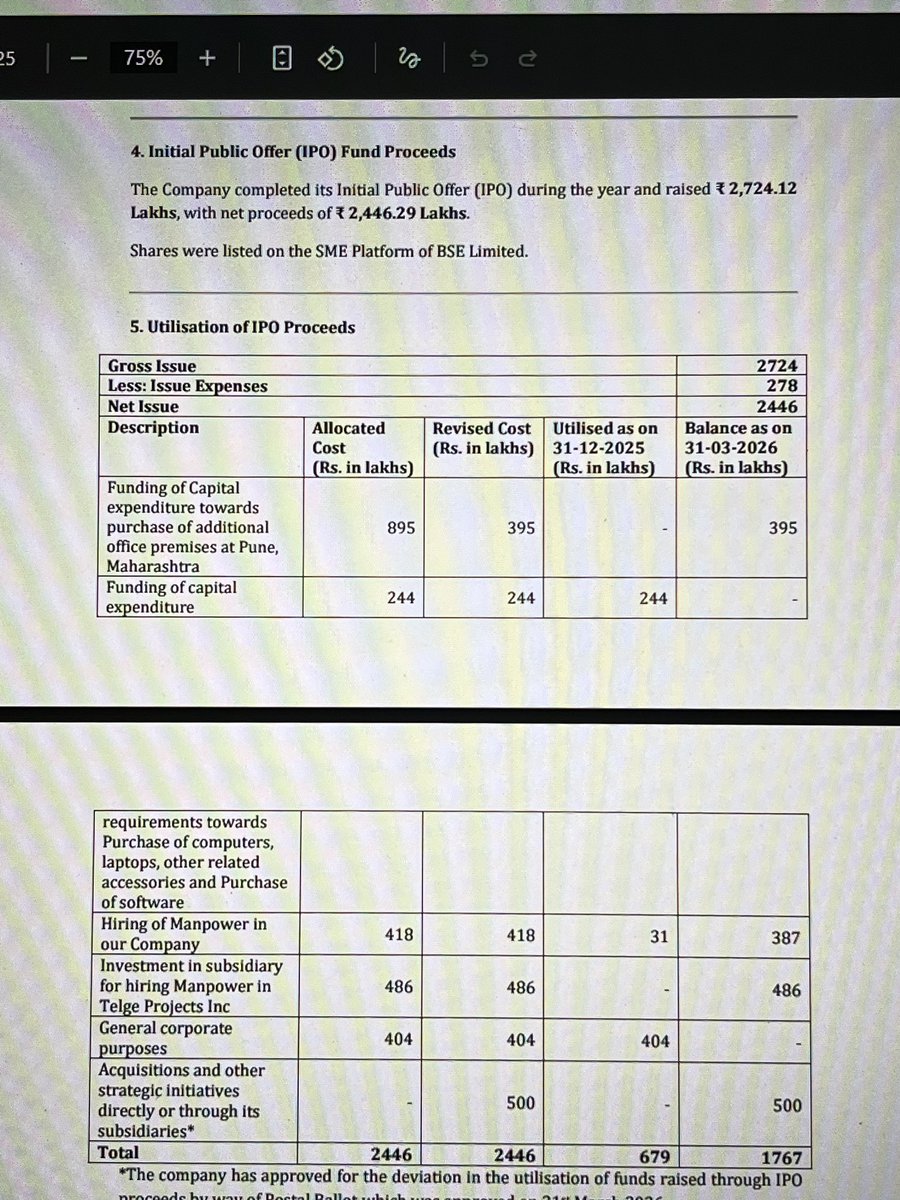
Smart move - #Telge #Projects
Reallocated 5 CR of 8.95 CR raised from IPO proceeds earmarked for purchased of additional office at pune towards the object of 'Acquisitions and Strategic Initiatives directly or through its subsidiaries'
Total amount raised was 27.24 CR in Oct 2025
Total utilisation stands at 6.79 cr
Balance IPO fund for utilisation 17.67 cr
Objective
3.95 cr : New office space in pune
3.87 cr : Manpower India
4.86 cr : Manpower US
5.00 cr : Acquisition via subsidiary
1
3
219
May 29
#RNFI @ 285
Stock still near its Pref price of 270
Expecting solid margin expansion and good results
Thesis 👇🏻
- Long-term vision to build a scalable, trust-based BFSI platform acting as a force multiplier for banks and financial institutions.
- Strong emphasis on transparency and governance. Promoter shares parked in a trust; transfer completed.
- Independent board structure.
- Voluntary early compliance with NSE & LODR requirements.
- Promoters KMP subscribed to 17.6% of warrant issue in Oct 2025, at 270/- per share and current price is in same range in May 2026.
- RNFI operates a B2B2C platform model connecting Banks / BFSIs / Insurance companies. Products (banking, insurance, payments, forex, collections, etc.) sold through Ground-level agents Sahayaks.
- Platform handles compliance, FRM, accounting, reconciliation & technology, enabling scalability.
- Plan to Increase agents, clients and products without proportionate increase in manpower.
- Pan-India presence covering a large number of PIN codes. Growing base of active sites and monthly transaction volumes. Client count increased from 5 clients in FY21 to 112 clients in FY26.
- Increasing cross-sell intensity: 8 new clients added with at least one product in H1. Several clients migrated from single product to multiple product.
- Multiple new partnerships with banks and financial institutions. Launch of in-house tele-marketing insurance portal.
- Paysprint is the company where they hold 67%. Launch of Escrow & Excode products. Fundraise completed at INR 120 Cr valuation.
- RNFI Received ISNP approval from IRDAI.
- Large-scale doorstep banking engagement with a universal bank - expected to be highly scalable.
- AD-II (Authorised Dealer Category-II) license received for forex/remittance business.
- Launched : Cash Management Services (CRA role), Motor Insurance (ReliAssure platform) and Air Ticketing platform (B2B2C via Sahayaks).
- In line RNFI Money Forex Portal (post bank integration). Out of 12 planned products:
- Aggressive deployment of AI & automation to reduce manpower dependency.
- In-house development of: OCR & identity verification, Auto fund-clearing requests, Automated reconciliation (Python-based), Proprietary dialer system (cost reduction in collections business which has a huge TAM).
- Shift toward higher-margin products, leading to Non-forex PAT margin improvement to 6.5% vs 4%.
- ARPU impacted temporarily due to Payworld consolidation. Normalised ARPU expected to trend higher going forward.
- Active site base increased by 18.8% HoH. Management confident of sustained ARPU expansion as mix improves.
- DMT Business : Decline already absorbed; no further downside expected.
- Historically high volume, very low margin. Replacement with diversified, higher-margin products underway.
- Forex & Remittance Business : AD-II license received. Systems ready; bank integrations in progress.
- Expecting a gradual scale-up from Q4 FY26, with stronger traction in FY27.
- Focusing on Outward remittances, Forex card, Lower working-capital intensity vs physical currency business.
- Paysprint : As per last concall Management expects profitability improvement from Q4.
- Payworld : Active agents: 40,000 (post consolidation). Short-term agent decline due to cost rationalisation.
- Expected hockey-stick recovery post consolidation.
- IPO funds largely unspent on opex; used for working capital. INR 25 Cr still unutilised.
- Preferential issue: Working Capital required more in CRA business, Insurance expansion, AD-II & cross-border remittance opportunities, Proposed composite insurance license.
- Margin trajectory expected to improve further.
- Product diversification remains key growth lever.
- Focus remains on B2B2C model via Sahayaks, not cash-burn heavy B2C expansion.
- Strong belief in technology-led scalability and compliance-first execution.
3
569
Kaustubh Babrekar retweeted

May 28
All those high growth investors who get hounded by positive cash flow cashing guys, please remind naysayers that negative cash flow is often feature not bug of a high growth phase.
And many a time positive cash flow also shows either due to size or other factors, exceptional high growth not possible anymore.
A company can only grow upto X % via internal accrual and still have positive cash flow.
Any growth more than X will result into negative cash flow and might require additional debt or equity funding.
Where X = PAT Margin % * ( 365 / cash conversion cycle in days)
CCC = DIO DSO - DPO
DIO (Days Inventory Outstanding): Average time it takes to turn inventory into sales
DSO (Days Sales Outstanding): Average time it takes to collect cash from customers
DPO (Days Payable Outstanding): Average time it takes to pay suppliers for goods
7
10
99
7,563
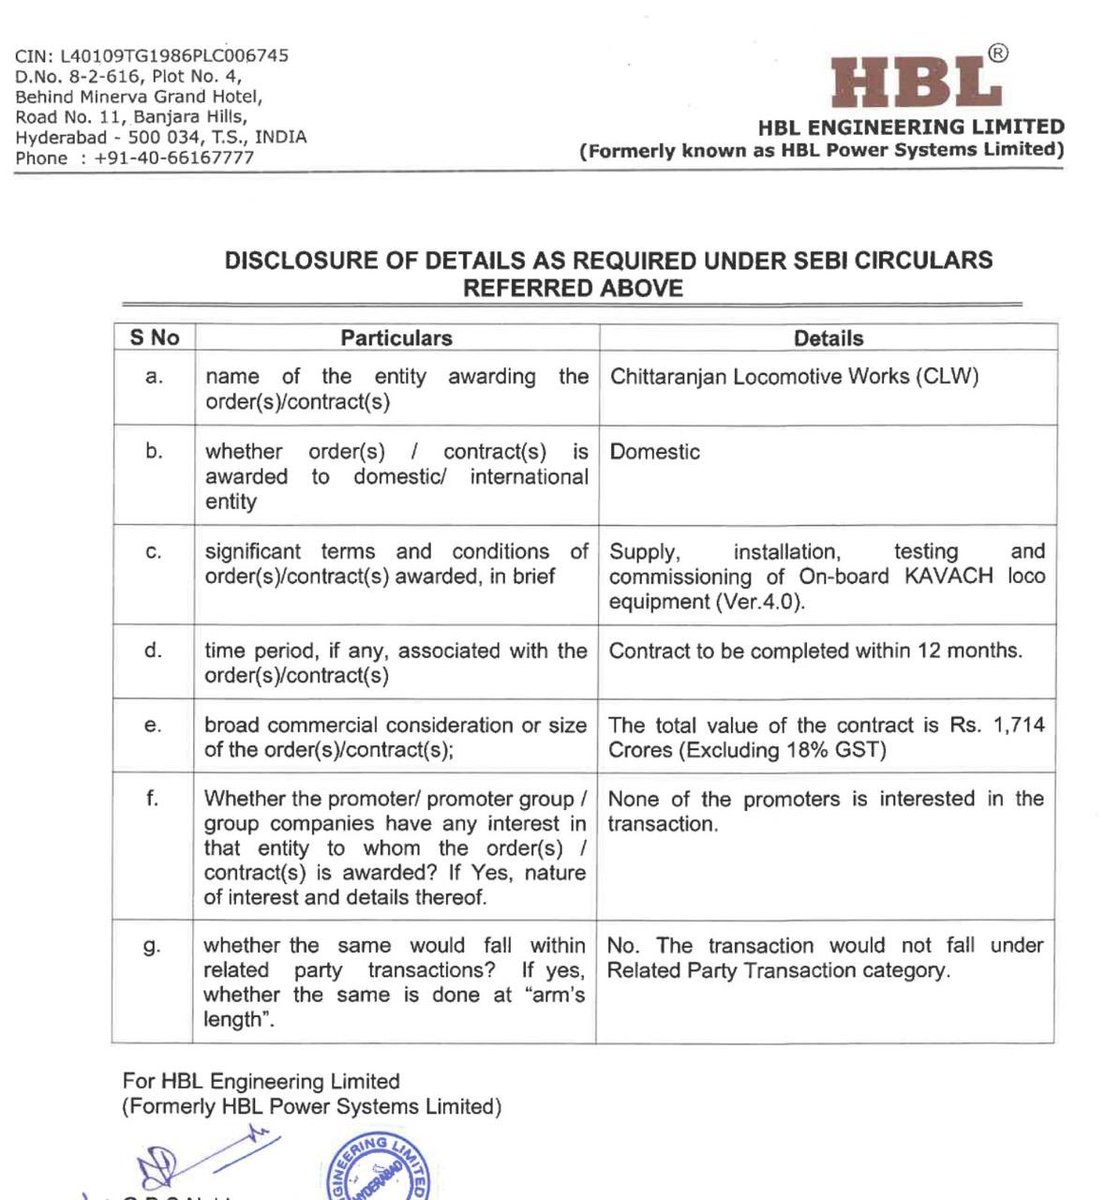
May 28
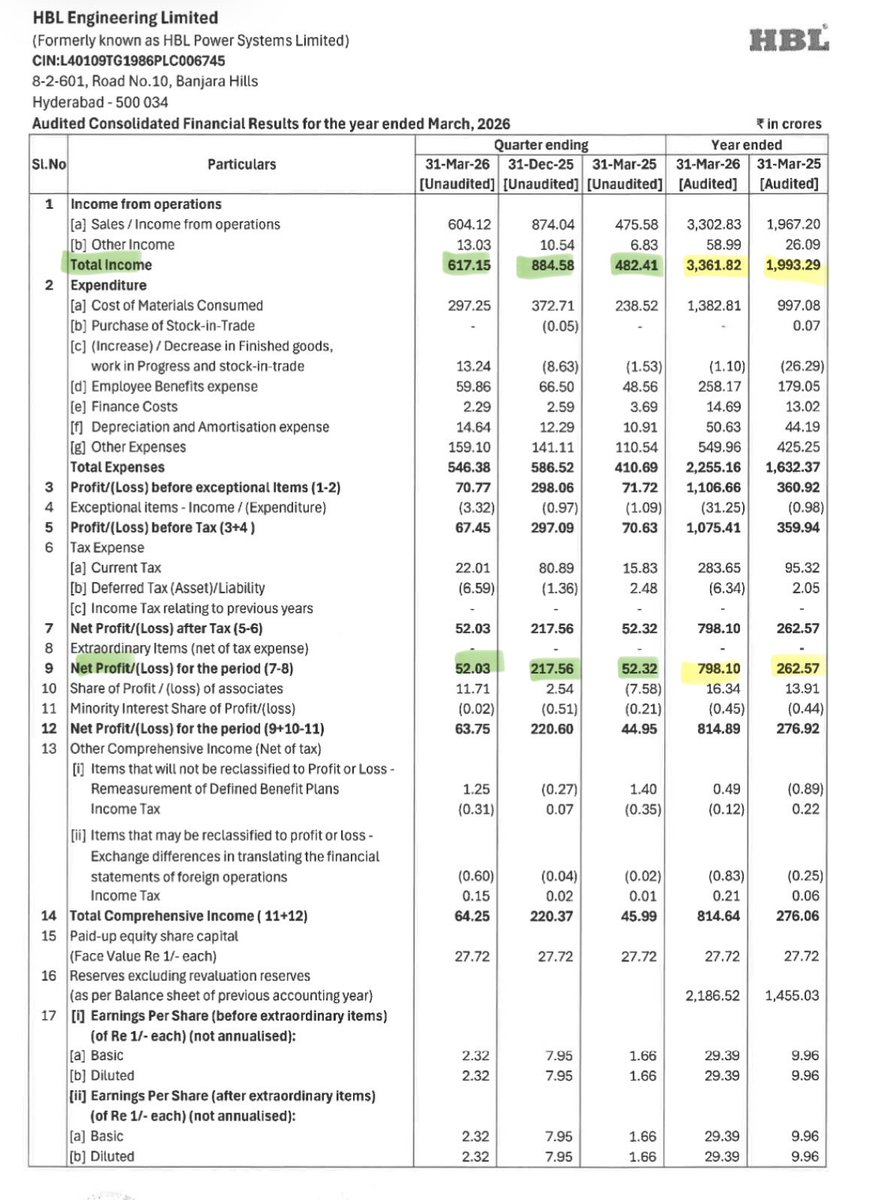
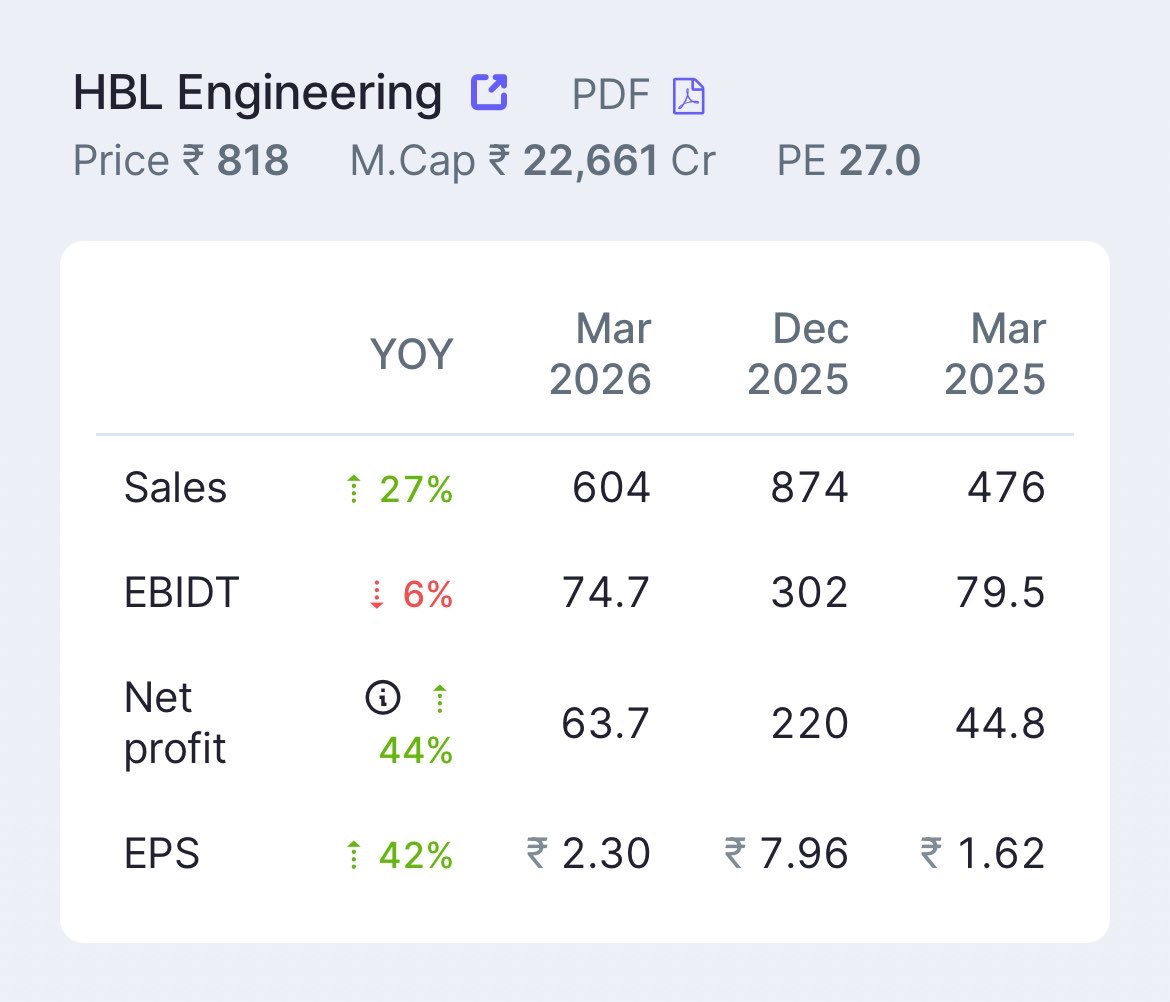
HBL @ 800 is now at attractive valuations
PE stands at 27
Solid Management and Comfortable Valuation as compared to peers like Kernex
Q3 was one off due to Kavach orders and now these orders are back!
7
524
May 27
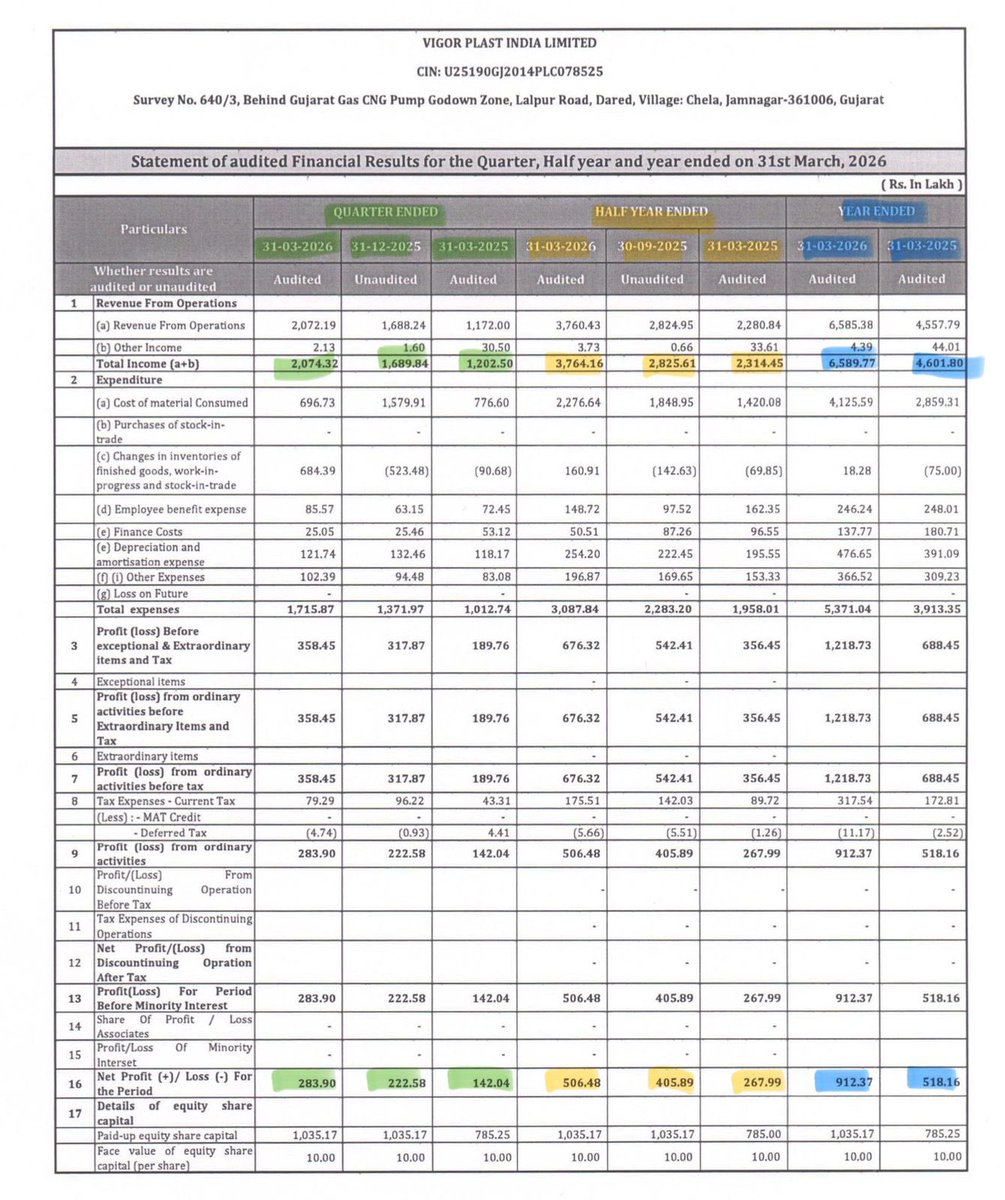
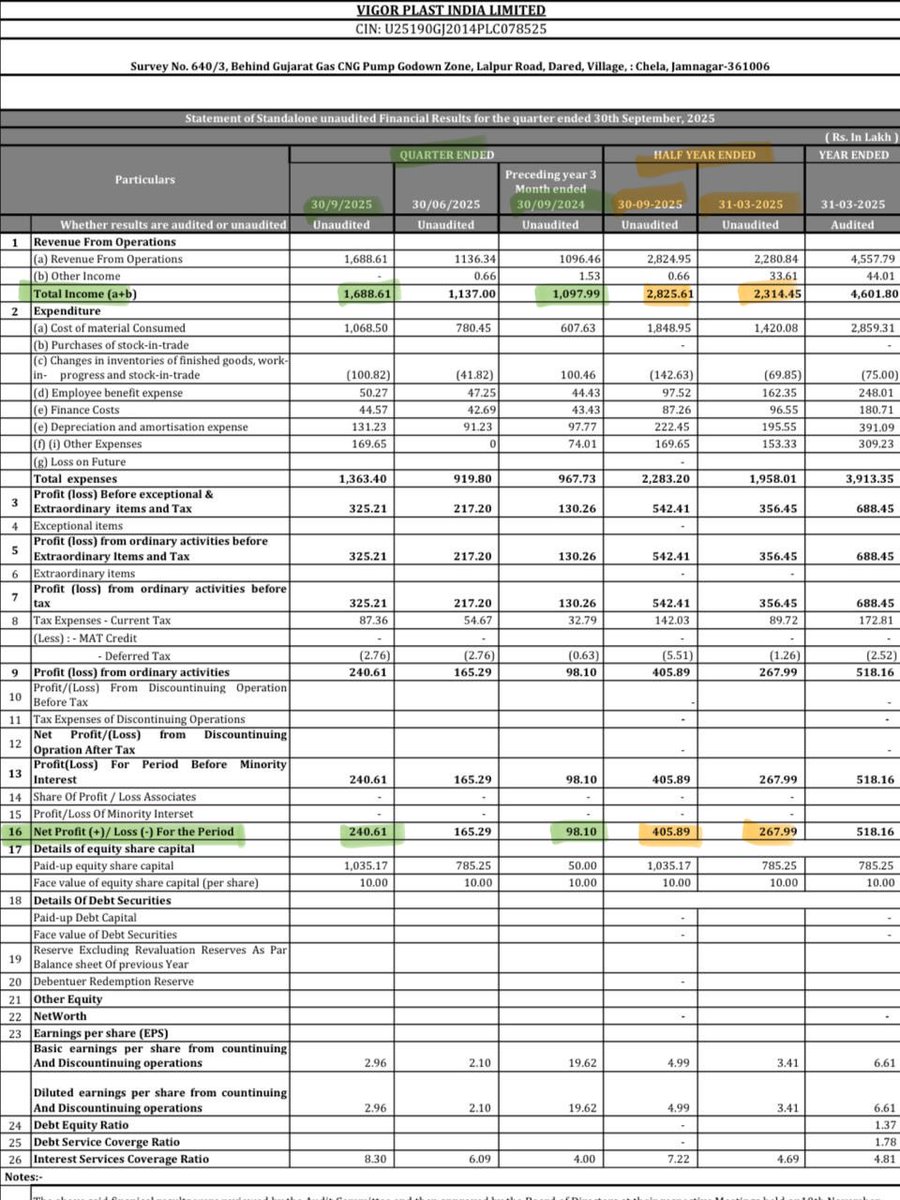
VIGOR Plast @ 56 🔥
Excellent set of numbers!
Q4FY26 vs Q4FY25
REV 20.74 vs 12.03 ⬆️ 72.4% 🔥
PAT 2.84 vs 1.42 ⬆️ 100.0% 🔥
Q4FY26 vs Q3FY26
REV 20.74 vs 16.90 ⬆️ 22.7% 🔥
PAT 2.84 vs 2.23 ⬆️ 27.4% 🔥
FY26 vs FY25
REV 65.90 vs 46.02 ⬆️ 43.2% 🔥
PAT 9.12 vs 5.18 ⬆️ 76.1% 🔥
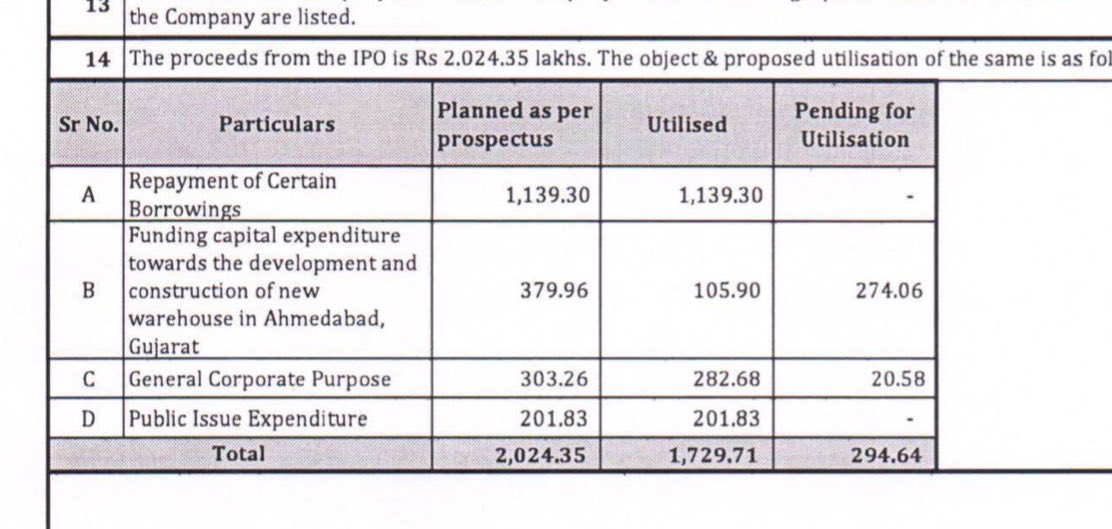
Company achieved 65 cr in sales for full year as against its guidance of 60cr 8.5% more
Trade Receivables at 10.61 Cr, compared to 5.43 Cr as of March 31, 2025
Operating Cash Flows remains positive : Net Cash Flow from Operating Activities of 4.19 Cr for FY26, ⬇️ from 6.25 Cr in FY25
Net Profit Margin at 13.9% vs 11.3% YoY ⬆️ 259 bps for full year
With the loan re-payed Interest costs have reduced loan on balance sheet
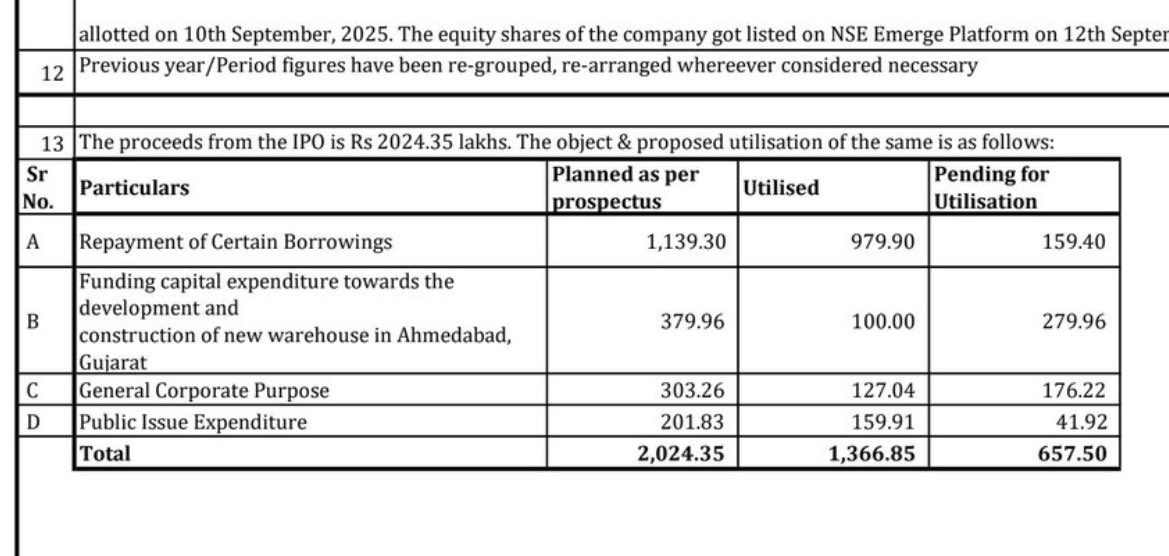
2.74 cr are still pending to be utilised from 20.24 cr of IPO money that was raised
10 Nov 2025
Vigor Plast 🔥
HLY YoY
Rev ⬆️ 23.5%
28.25 vs 22.87 cr
PAT ⬆️ 62.4%
4.06 vs 2.5 cr
Quarterly compared YoY
Rev ⬆️ 54%
16.88 vs 10.98 cr
PAT ⬆️ 145%
2.40 vs 0.98 cr
QoQ
Rev ⬆️ 3%
11.37 vs 10.97
PAT ⬆️ 68%
1.65 vs 0.98
7
946
May 22
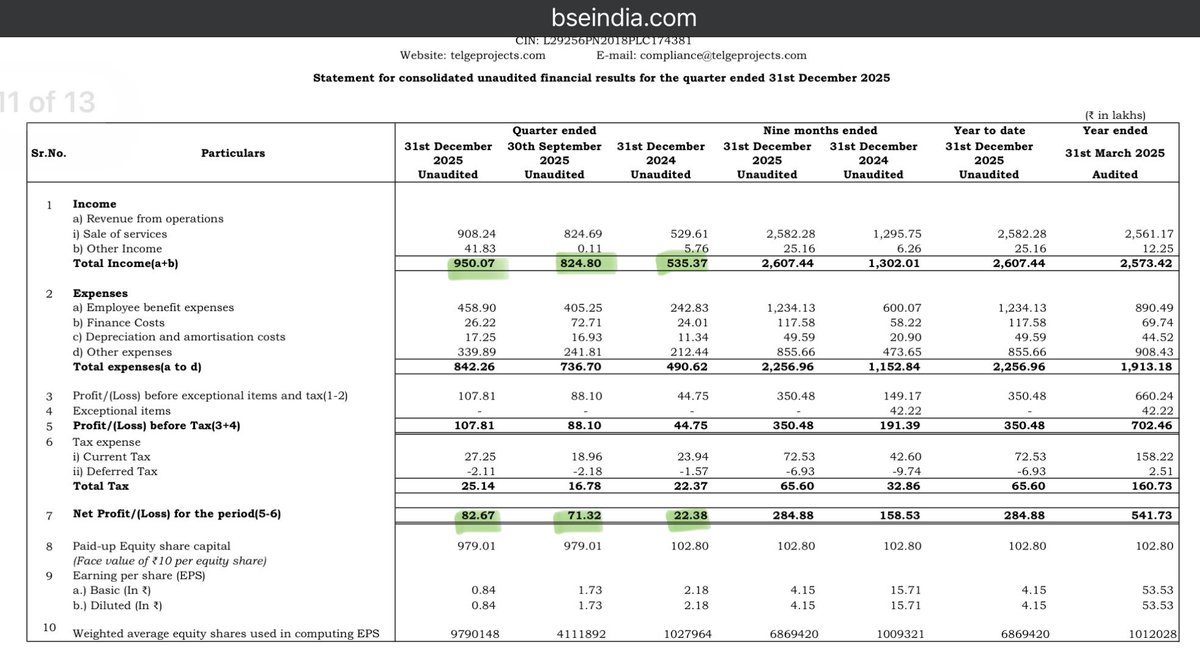
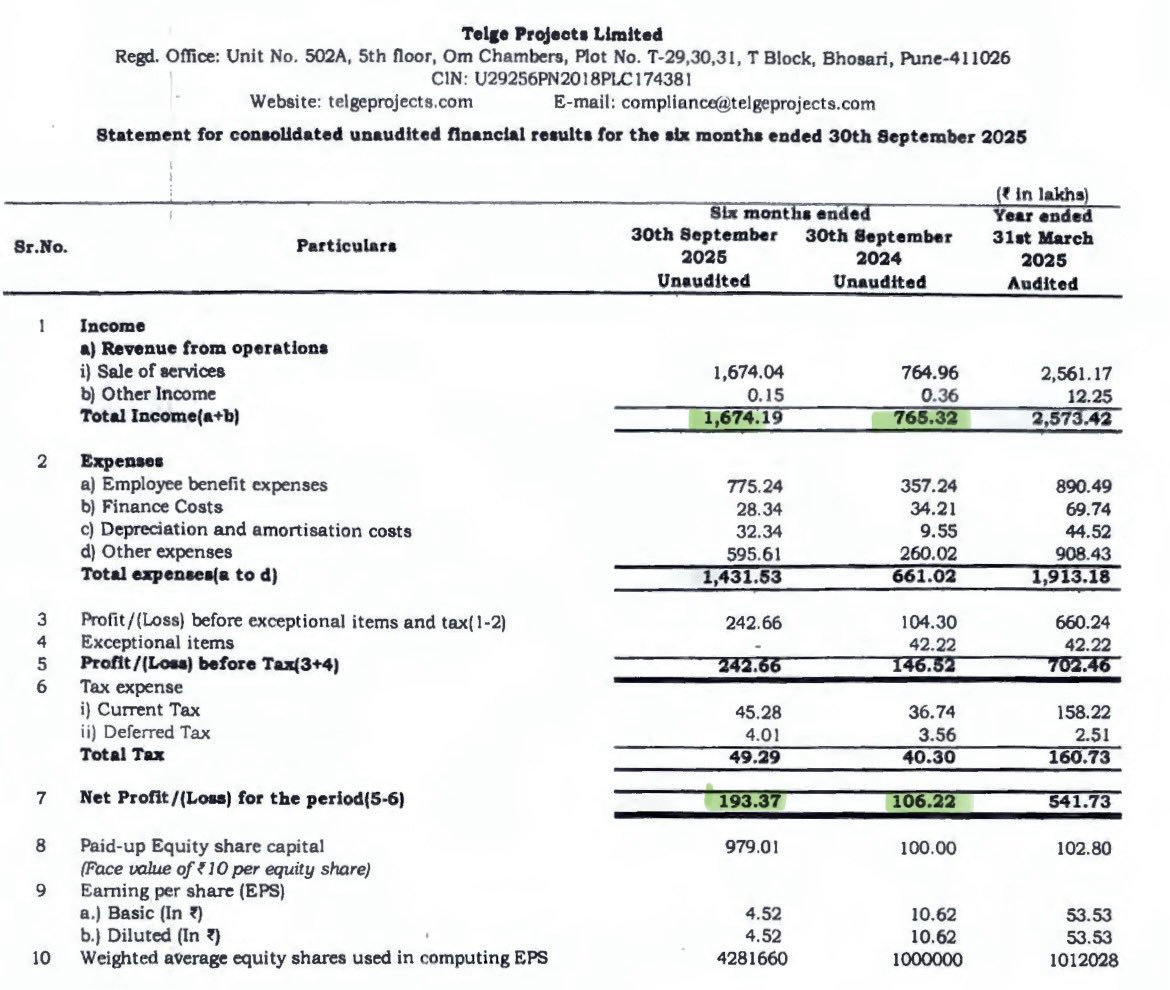
Telge Projects Limited @ 110
Management guides for a strong 60-70% CAGR revenue growth in FY27 and over the medium term.
Growth driven by market expansion, capacity additions, and larger project ticket sizes (targeting ₹8-10 Cr vs historic ₹2-3 Cr).
Active order book stands at ₹25 Cr (80% from the US); newly acquired Edward Farr’s architectural business contributes ~₹10 Cr of this.
An additional ₹6 Cr worth of RFQs are in the bidding stage, expected to convert within a month.
High revenue visibility with 60-70% recurring business from long-term global clients.
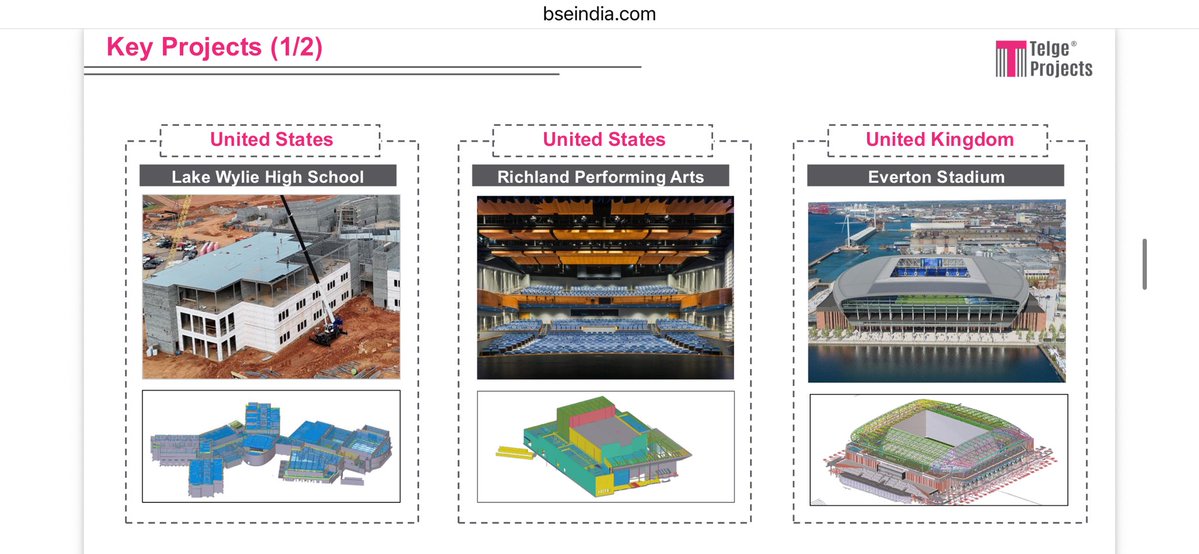
Track record of 2,000 completed global projects, serving 50 clients across 10 countries.
Dynamic order book pipeline, consistently adding ₹4-5 Cr of new orders every month last year.
Global delivery model (US, UK, Europe, Australia) with low-cost, offshore execution in India.
Three US subsidiaries (Midwest, Draftco, Edward Farr) are fully integrated for front-end sales and project management, while backend execution stays in India.
Actively evaluating further niche acquisitions in Mechanical, Electrical, Plumbing (MEP) and design services to expand the AEC portfolio.
Acquired US-based Edward Farr Architects at 2.5x EBITDA to vertically integrate structural and architectural capabilities.
Targeting sustainable EBITDA margins of 30-35% and PAT margins of 20-23% for coming quarters.
Q3 margin dip was a one-off due to deliberate leadership hiring (Business Development Executives, regional heads).
Leadership team expansion is now frozen; future hiring is strictly focused on execution teams.
Margins optimized via proprietary workflow tools and AI automation (custom scripts/plugins in Tekla, SDS2, Revit) to drive non-linear growth.
Cost efficiencies supported by tier-2 India expansion (Nashik, Latur) and improved US pricing ($45-60/hr vs historical $25-35/hr).
M&A Strategy: No plans for debt or equity dilution during the upcoming financial year.
Debtor days stood at 108 days at year-end due to related-party receivables, but accelerated collections in April/May brought it back to a healthy ~60 days.
Solid balance sheet post-IPO with a very comfortable cash and liquidity position.
Edward Farr Architects recorded standalone CY25 revenue of ~₹14 Cr with stable 10-12% PAT margins.
Due to a March closing, only one month of Edward Farr's financials was consolidated in FY26, contributing ₹1.5 Cr to revenue and ₹30-40 lakhs to PAT.
Total headcount stands at 200-250 employees ( 70 added in FY26). ~25 personnel are on-ground in the US, with the rest executing across Pune, Latur, and the new Nashik hub.
Employee attrition is highly controlled at 10% for Indian operations and at 0% across international subsidiaries.
Strong Q4 seasonality due to global client budgeting cycles; slower Q2 performance is systematically hedged via multi-geography client exposure in Europe and Australia.
Employee Costs: Spiked to ~45% of revenue in FY26 (vs 35% in FY25) due to upfront investments in department heads and regional leadership to handle scale. Costs will normalize in FY27 as team structure stabilizes.
Revenue Trajectory: Aiming higher than the previous ₹4.5 Cr/month run rate seen in early 2026, backing the strong 60-70% medium-term CAGR outlook.
Client Additions: Catered to 96 active clients in FY26, aggressively adding 20 brand-new clients in Q4 alone, primarily from the US market.


1
4
270
May 21
SIEMENS ENERGY #ENERIN @ 3685
Makes new All Time High!
May 16
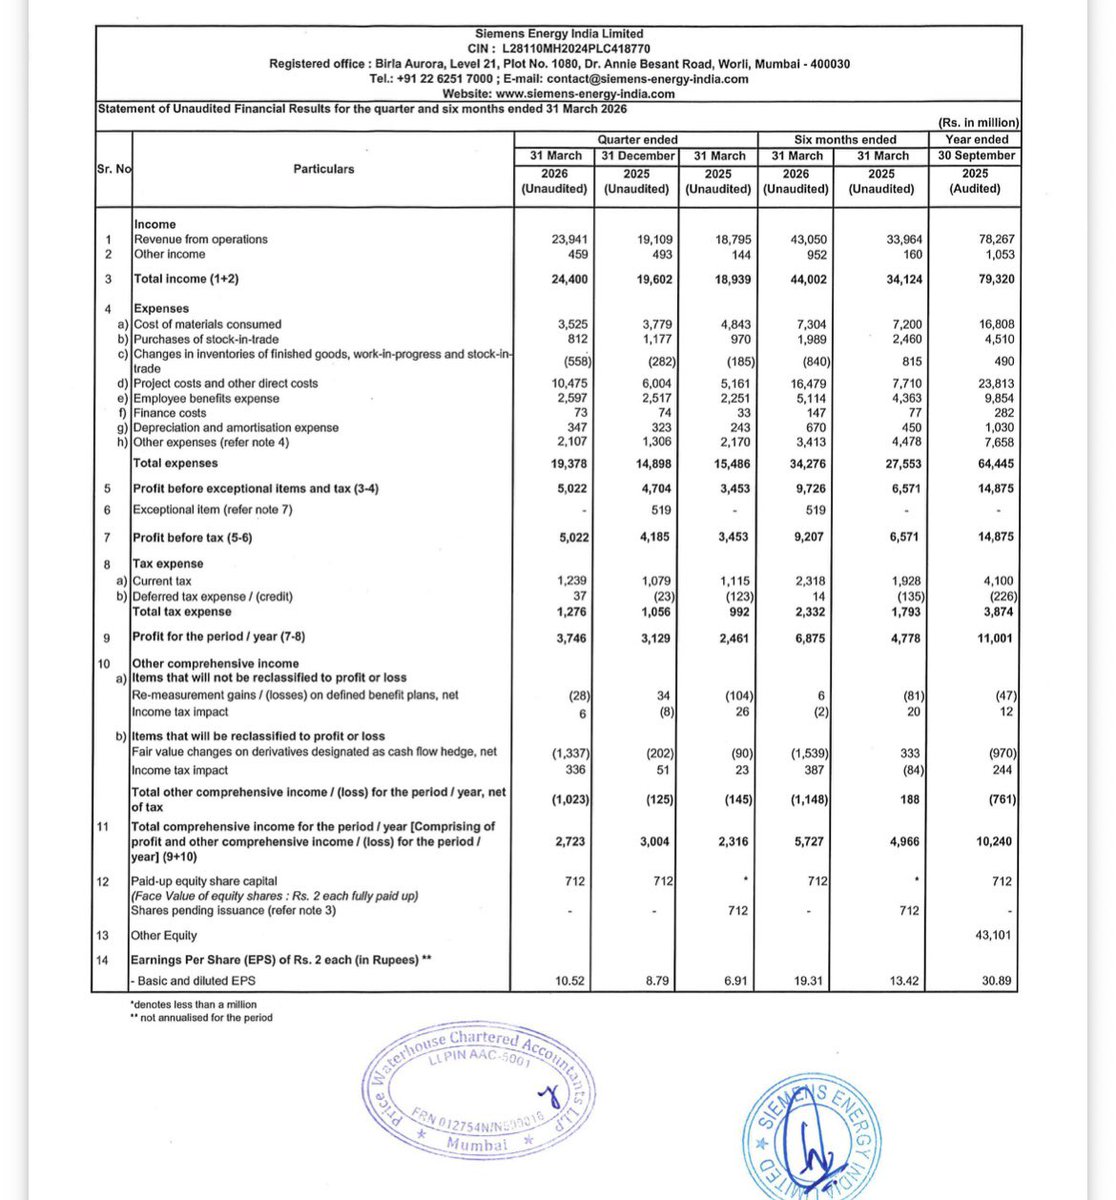
#SIEMENS #ENERGY #INDIA #ENERIN @ 3100
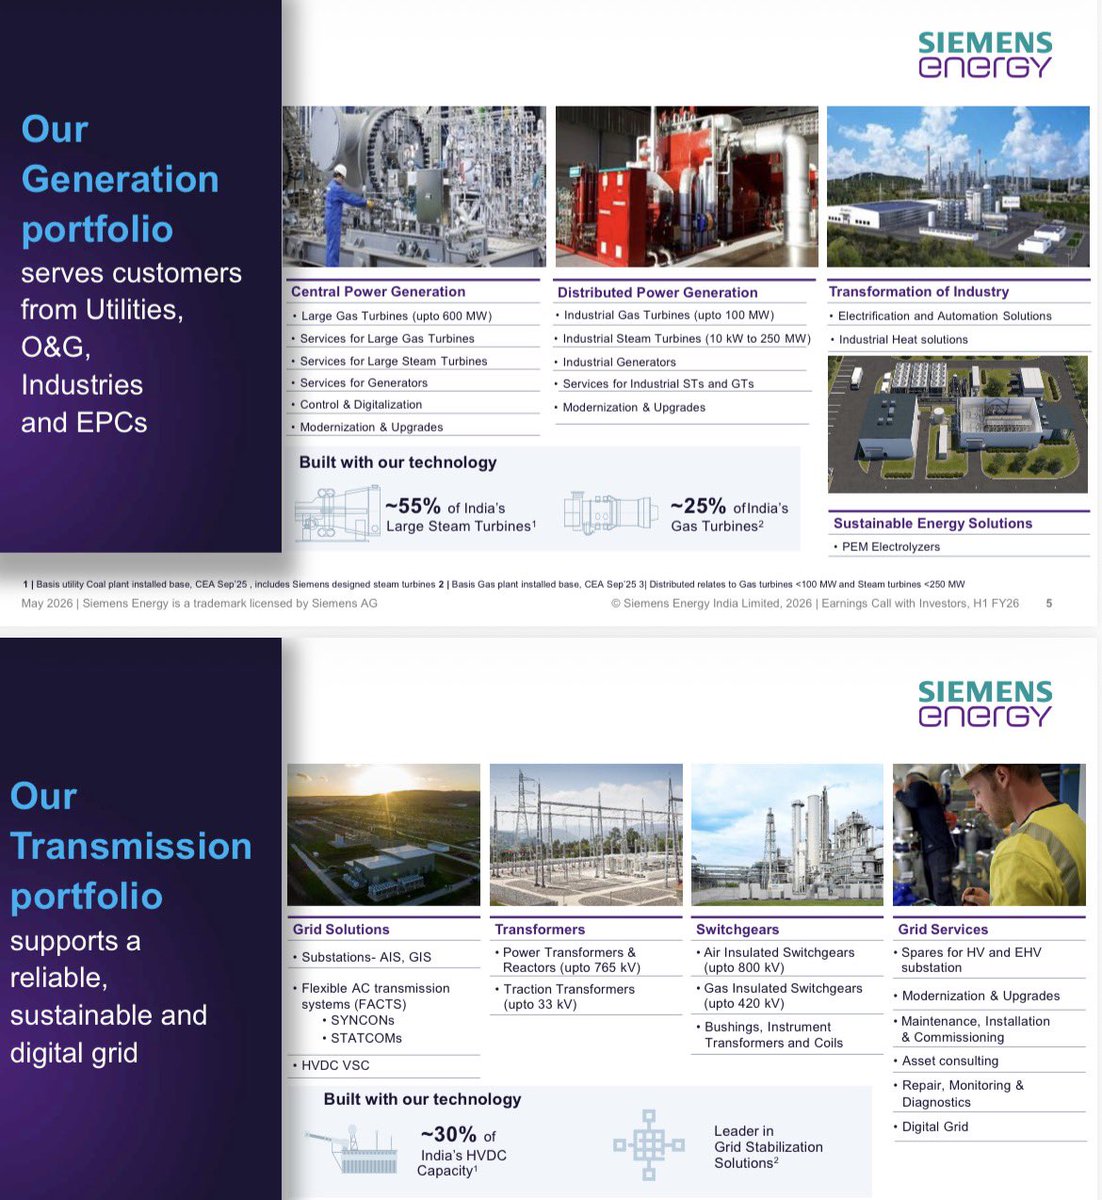
Pureplay Power Company ⚡️
Company Strategy and Operations
SEIL is a pure-play energy company covering the entire value chain through Power Generation (PG) and Power Transmission (PT).
Key verticals include Power Utilities, Metal and Cement, Oil and Gas, Petrochemicals, Data Centers, and Railways.
Local manufacturing is a core strength with 8 factories, 4 Engineering/R&D centers, 6 sales offices, and 4 service centers across India.
The company focuses on low-carbon or zero-emission power generation, specifically gas power and related services, but does not manufacture gas turbines or green hydrogen electrolyzers locally.
SEIL supports global operations through exports of products and engineering services (Local to Global).
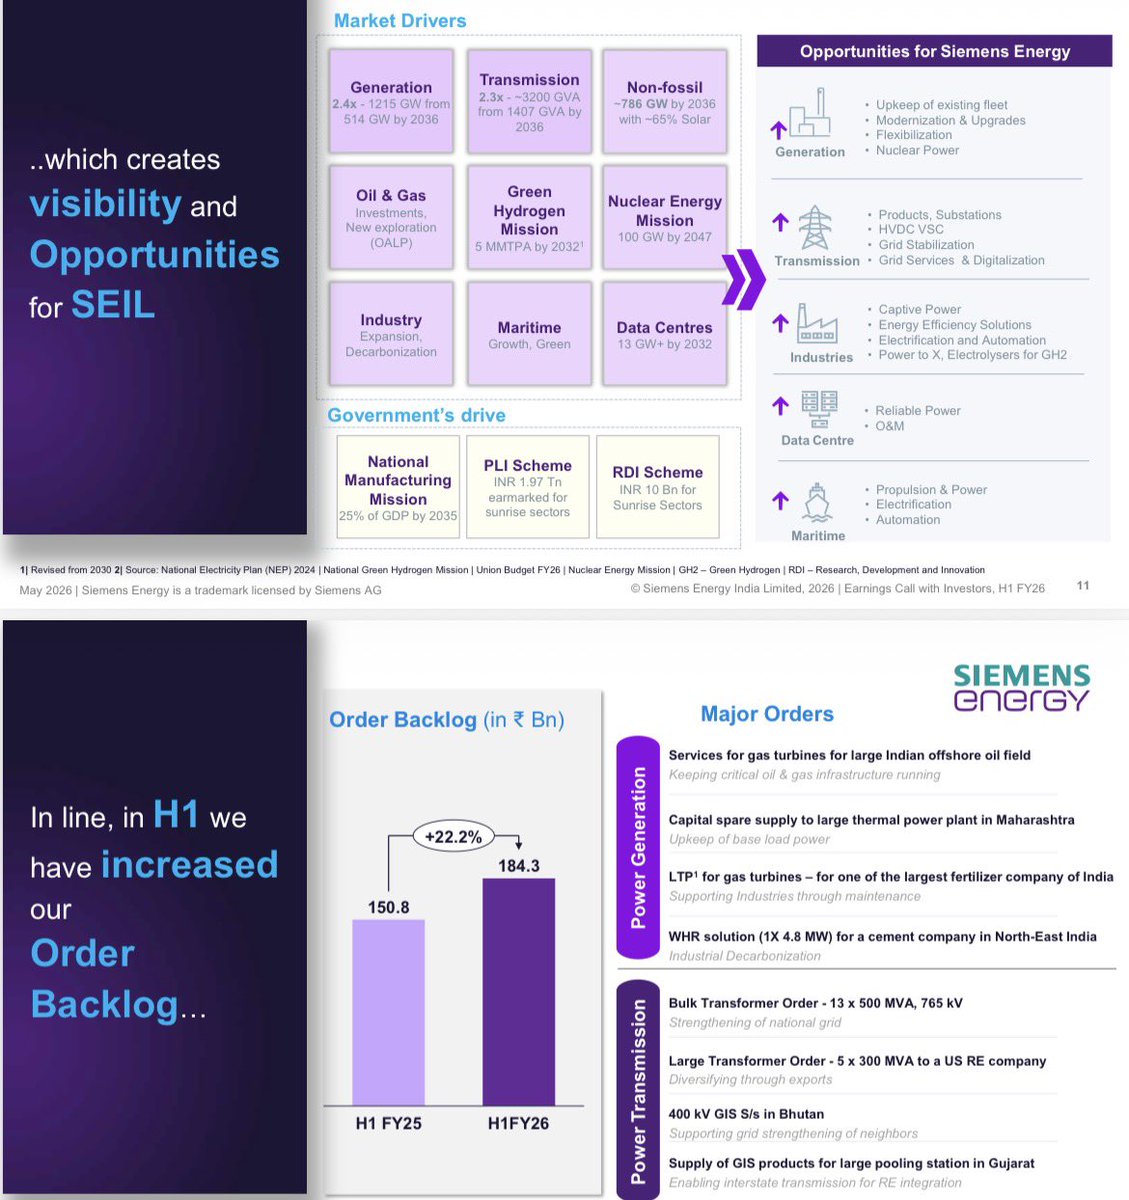
Market Outlook and Dynamics
India projects GDP growth of 7.4% for FY26, showing strong resilience despite global geopolitical crises.
Electricity demand is projected to reach 3365 TWh by 2035-36, with total generation capacity hitting 1215 GW (65% non-fossil sources).
Per capita consumption is expected to reach 13,000 kilowatt hours by 2070.
Data centers are a major growth driver, with India's capacity expected to reach 7 to 18 gigawatts.
Growth is further driven by the Green Hydrogen Mission, National Manufacturing Mission, and nuclear energy plans (targeting 100 GW by 2047).
Financial Performance (H1 FY26 vs. H1 FY25)
Total revenue ⬆️ 27% YoY
PAT ⬆️ 52% YoY
Order book ⬆️ 22.2% to 18,430 Crores.
Operating profit margin improved to 20.7% from 19.1%, driven by operating leverage and favorable export mix.
Export contribution ⬆️ 28.5% of total revenue.
Revenue mix consists of Products (37.6%), Solutions (35.5%), and Services (26.9%).
Segment Highlights
Power Transmission:
Revenue rose 29.7% to 2,400 Crores with a 12,520 Crores backlog.
Success was driven by bulk 765 kV transformer orders and GIS products for renewable energy.
Power Generation:
Revenue rose 23.3% to 1,900 Crores with a 5,920 Crores backlog.
Highlights include steady demand from utilities and industry sectors.
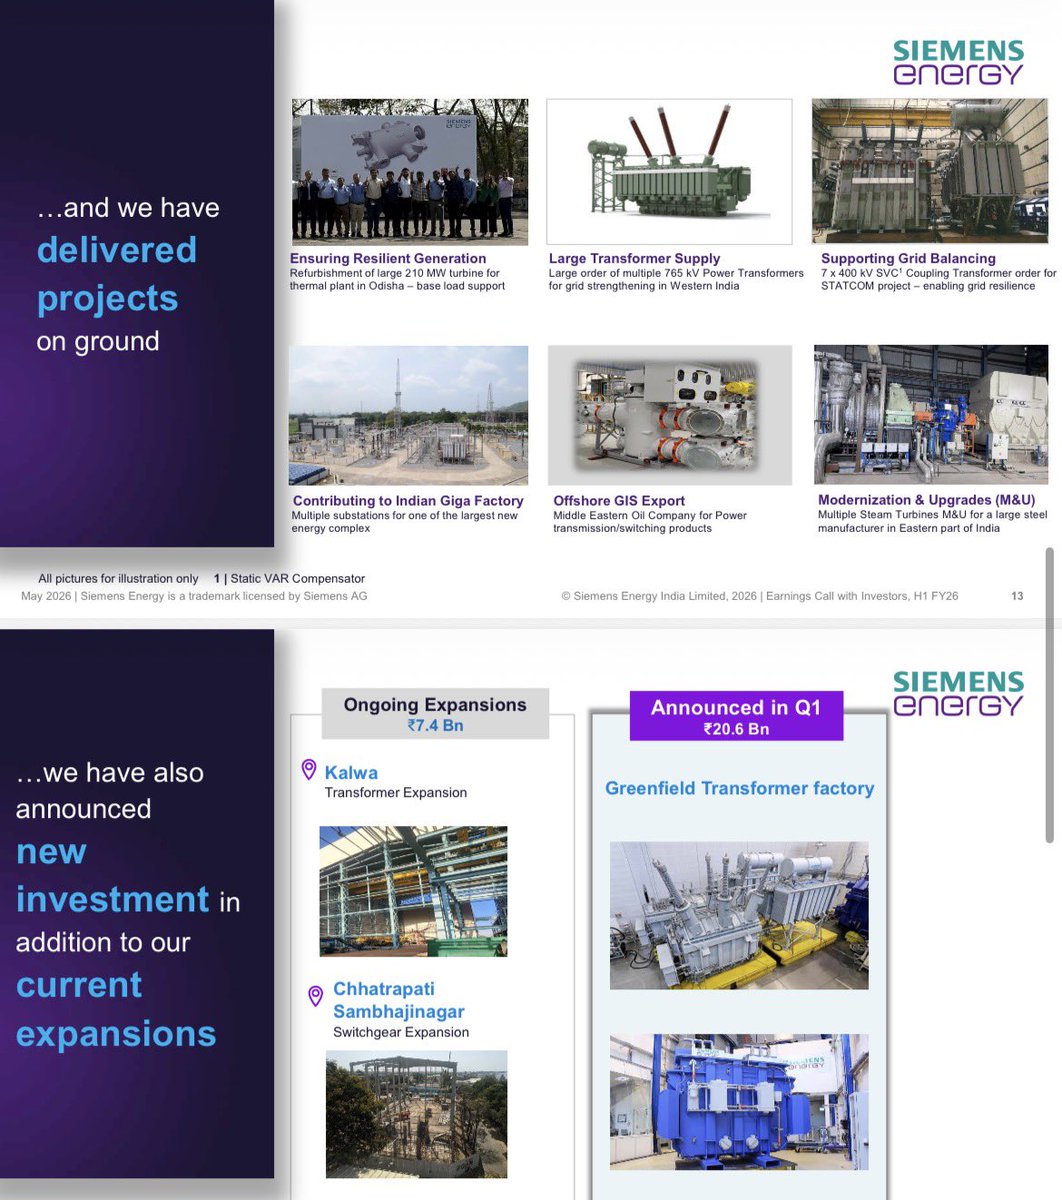
Important Projects and Deliveries
Received an order for 13 large 765 kV transformers (500 MVA) for domestic grid expansion.
Winning transformer orders for the US market driven by data center and renewable energy needs.
Refurbished a 210 megawatt turbine in Odisha, highlighting growth in modernisation services for the thermal fleet.
Exporting offshore Gas Insulated Switchgear (GIS) to the Middle East for oil and gas expansion.
Guidance and Future Highlights
Order Intake: No specific numerical forward guidance provided, but a strong 1.5 book-to-bill ratio suggests healthy development.
New CAPEX: Announced 2,060 Crores for a Greenfield Transformer factory (location pending).
Ongoing Expansions: Brownfield investments of 740 Crores at Kalwa and Chhatrapati Sambhajinagar are in progress, expected to come online by mid-2027.
Profitability: Margin improvements are expected to be sustainable through economies of scale and high-value project selection (value over volume).
ESG and Safety
Aiming for climate neutrality in operations by 2030; achieved a reduction of 7,500 tCO2e in H1.
Achieved 15.3% gender diversity and maintained a "Zero Harm" safety record with no fatalities or lost time injuries.
4
316
May 18
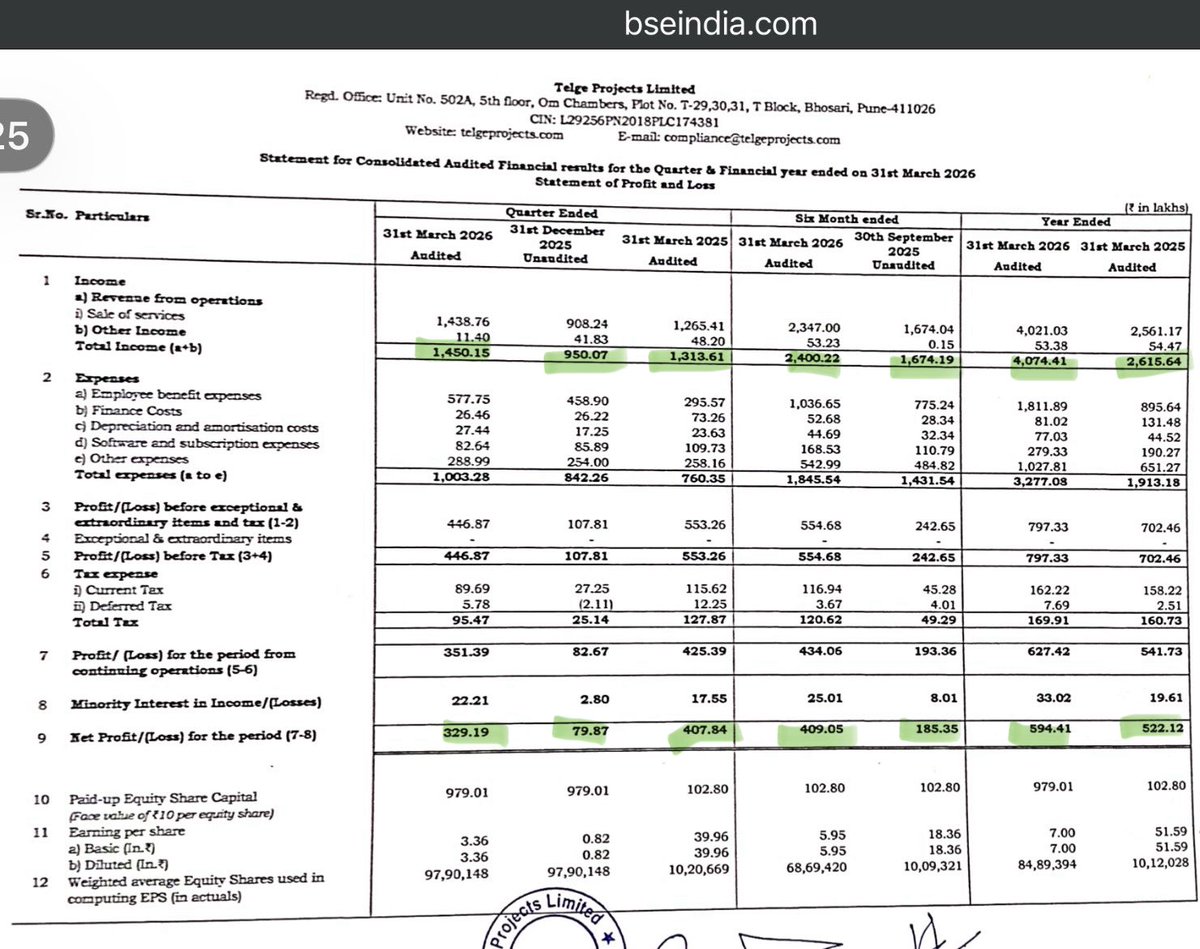
Good Set from #Telge #Projects @ 105
Slow and Steady Growth!
Looking at the numbers first concern is - Total income grew by 55% YoY but PAT growth was only 13.8% ?
Employee Cost hit hard in Q3 which is Very Well recovered in Q4 👍🏻
Telege projects hired people for Business Development in the US and this impacted their P&L specially in Q3
Also an increase in software and licences cost was see
The NPM degraded from 20.3% to 14.6% YoY while the OPM dipped from 33% to 25% for full year
Employee expense more than doubled from 8.9 cr to 18.11 cr for whole year ⬆️ 103.5% against Revenue growth of 55%
Employee cost was 35% of Total income which increased to 44% in FY26
But the answer is here
👇🏻
This major dip in profit is seen as the company is very small, Hiring 2 engineers in the US for business development can cost upto 1 CR per annum. This effect of employee expense wont be seen on a bigger base as company grows
But remember in technology companies people and software are the Assets and company has to spend on assets to build itself
OPM for Q3 was at 16% which recovered very well to 33.5% in Q4
This is growth phase of the company and FY27 could be a good growth year with all growth triggers ready
As guided during the IPO management achieved the 40 cr topline number 👍🏻
FY26 vs FY25
REV : 40.74 vs 26.15 ⬆️ 55%
PAT : 5.94 cr vs 5.22 ⬆️ 13.8%
Q4FY26 vs Q4FY25
REV : 14.5 cr vs 13.13 ⬆️ 10.4%
PAT : 3.21 cr vs 4.13 cr ⬇️ -22.3%
Q4FY26 vs Q3FY26
REV : 14.5 cr vs 9.5 cr ⬆️ 52.6%
PAT : 3.29 vs 0.83 cr ⬆️ 300%
H2FY26 vs H1FY26
REV : 24.00 cr vs 16.74cr ⬆️
PAT : 4.09 cr vs 1.85 ⬆️
H2FY26 vs H2FY25
REV : 24.00 cr vs 18.5 cr ⬆️
PAT : 4.09 vs 4.35 ⬇️
One must see this with a view of FY27 and with growth triggers like Acquisition.
Q1 results can be watched out for understanding the potential growth journey
Personally like the management and look forward to hear in the con-call
1
6
415
May 16
#SIEMENS #ENERGY #INDIA #ENERIN @ 3100
Pureplay Power Company ⚡️
Company Strategy and Operations
SEIL is a pure-play energy company covering the entire value chain through Power Generation (PG) and Power Transmission (PT).
Key verticals include Power Utilities, Metal and Cement, Oil and Gas, Petrochemicals, Data Centers, and Railways.
Local manufacturing is a core strength with 8 factories, 4 Engineering/R&D centers, 6 sales offices, and 4 service centers across India.
The company focuses on low-carbon or zero-emission power generation, specifically gas power and related services, but does not manufacture gas turbines or green hydrogen electrolyzers locally.
SEIL supports global operations through exports of products and engineering services (Local to Global).
Market Outlook and Dynamics
India projects GDP growth of 7.4% for FY26, showing strong resilience despite global geopolitical crises.
Electricity demand is projected to reach 3365 TWh by 2035-36, with total generation capacity hitting 1215 GW (65% non-fossil sources).
Per capita consumption is expected to reach 13,000 kilowatt hours by 2070.
Data centers are a major growth driver, with India's capacity expected to reach 7 to 18 gigawatts.
Growth is further driven by the Green Hydrogen Mission, National Manufacturing Mission, and nuclear energy plans (targeting 100 GW by 2047).
Financial Performance (H1 FY26 vs. H1 FY25)
Total revenue ⬆️ 27% YoY
PAT ⬆️ 52% YoY
Order book ⬆️ 22.2% to 18,430 Crores.
Operating profit margin improved to 20.7% from 19.1%, driven by operating leverage and favorable export mix.
Export contribution ⬆️ 28.5% of total revenue.
Revenue mix consists of Products (37.6%), Solutions (35.5%), and Services (26.9%).
Segment Highlights
Power Transmission:
Revenue rose 29.7% to 2,400 Crores with a 12,520 Crores backlog.
Success was driven by bulk 765 kV transformer orders and GIS products for renewable energy.
Power Generation:
Revenue rose 23.3% to 1,900 Crores with a 5,920 Crores backlog.
Highlights include steady demand from utilities and industry sectors.
Important Projects and Deliveries
Received an order for 13 large 765 kV transformers (500 MVA) for domestic grid expansion.
Winning transformer orders for the US market driven by data center and renewable energy needs.
Refurbished a 210 megawatt turbine in Odisha, highlighting growth in modernisation services for the thermal fleet.
Exporting offshore Gas Insulated Switchgear (GIS) to the Middle East for oil and gas expansion.
Guidance and Future Highlights
Order Intake: No specific numerical forward guidance provided, but a strong 1.5 book-to-bill ratio suggests healthy development.
New CAPEX: Announced 2,060 Crores for a Greenfield Transformer factory (location pending).
Ongoing Expansions: Brownfield investments of 740 Crores at Kalwa and Chhatrapati Sambhajinagar are in progress, expected to come online by mid-2027.
Profitability: Margin improvements are expected to be sustainable through economies of scale and high-value project selection (value over volume).
ESG and Safety
Aiming for climate neutrality in operations by 2030; achieved a reduction of 7,500 tCO2e in H1.
Achieved 15.3% gender diversity and maintained a "Zero Harm" safety record with no fatalities or lost time injuries.
1
1
20
1,487
May 15
Good Going @ProjectsTelge !
May 15

Our work on the Lake Wylie High School project is now featured as an official case study by Trimble on their global platform.
Read more: trimble.com/resources/constr…
#TelgeProjects #Trimble #BIM #TeklaStructures #StructuralSteel #Construction #Engineering

1
203
May 14
Still Performing!
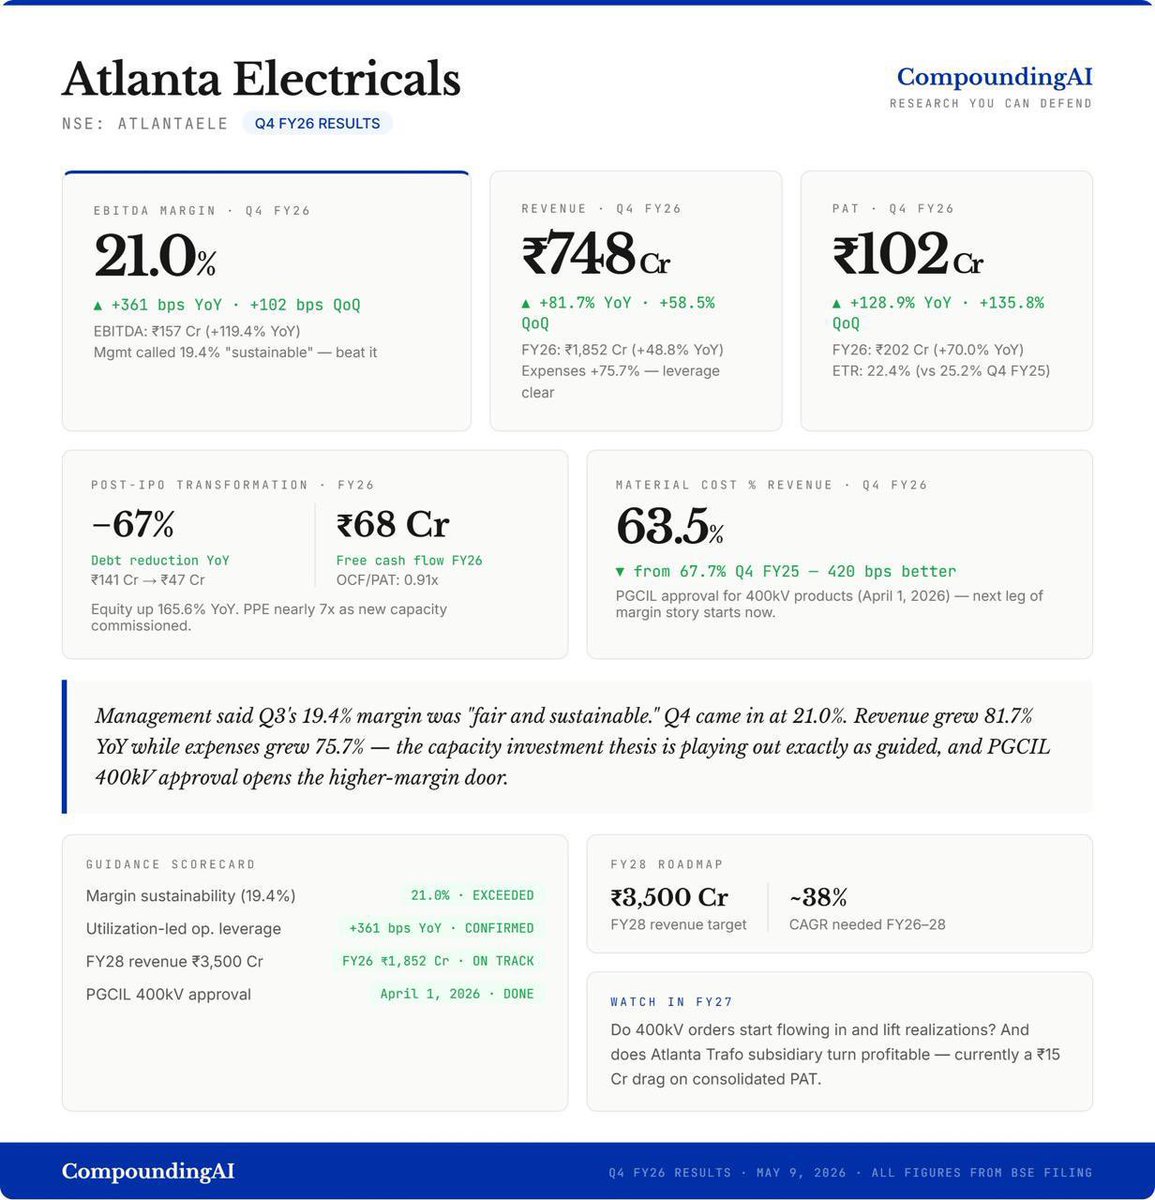
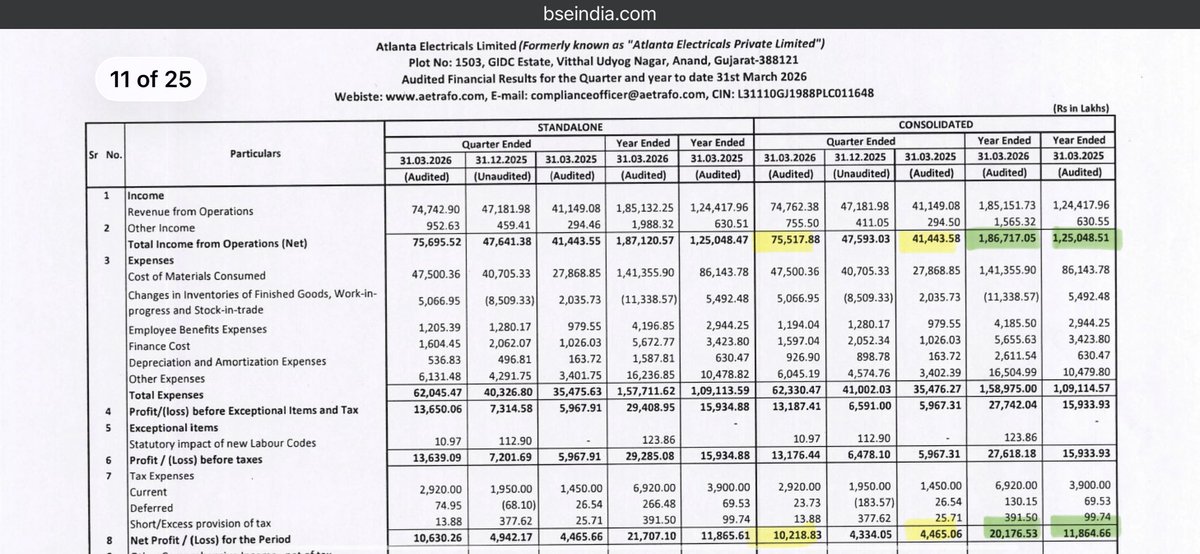
Atlanta Electricals @ 1902 has been a Super Performer! 🚀
Makes life time high today! 💥
Super Numbers by #Atlanta #Electricals @ 1646 was 81 PE rerated to 63x
I expect it to perform continuously henceforth too with 4x capacity increase✨
IPO at Rs.754 at 48 p/e
Revenue 747.62 Cr vs 411.49 Cr
81.69% ⬆️ YoY
58.46% ⬆️ QoQ
PAT 102.19 Cr vs 44.65 Cr
128.86% ⬆️ YoY
135.78% ⬆️ QoQ
H2 FY26 Vs.H1 FY26
REV:Rs. 1231Cr Rs. Vs Rs. 636Cr
PAT:Rs. 145Cr Vs Rs. 57Cr
H2FY25
Rev:Rs. 677Cr
PAT:Rs. 67Cr
Consolidated Trade Receivables
• FY26: ₹45,516.32 lakhs.
• FY25: ₹35,171.22 lakhs.
YoY Change: ⬆️ 29.4%
Consolidated Operating Cash Flows (OCF)
Operating cash flows showed strong growth, nearly doubling compared to the previous fiscal year.
• FY26: ₹11,184.23 lakhs.
• FY25: ₹6,241.13 lakhs.
YoY Change: ⬆️ 79.2%.
402
May 13
Quality Power @ 1250
Update on Capital Expenditure and Strategic Initiatives
1. Sangli Plant: Completion is slightly delayed due to global supply and labor issues. Production is now expected to start in the first week of August 2026. Construction of a new Engineering Centre will begin shortly.
2. Mehru Expansion: An investment of Rs 17.2 crore is planned for FY 2026-27 for high-voltage and GIS equipment. They are also developing new 765 kV equipment.
3. Endoks PCS Facility (Turkey): A new USD 2 million facility is being set up in Nigde, Turkey, to support Battery Energy Storage projects. It is targeted for completion by December 2026.
4. Magnet Wire Facility: The HVDC CTC project is on track and expected to start operations in Q3 of FY 2026-27.
5. Veeral Controls Acquisition: The deal has been put on hold because the sellers have not yet met certain required conditions and compliance steps.
6. Fund Raising: The Board has authorised raising up to USD 75 million. This money will be used for international expansion, potential acquisitions, and new technology investments.
7. Corporate Merger: The company will merge its subsidiary, S&S Transformers & Accessories, into the main company to reduce costs and simplify operations.

6
415
May 13
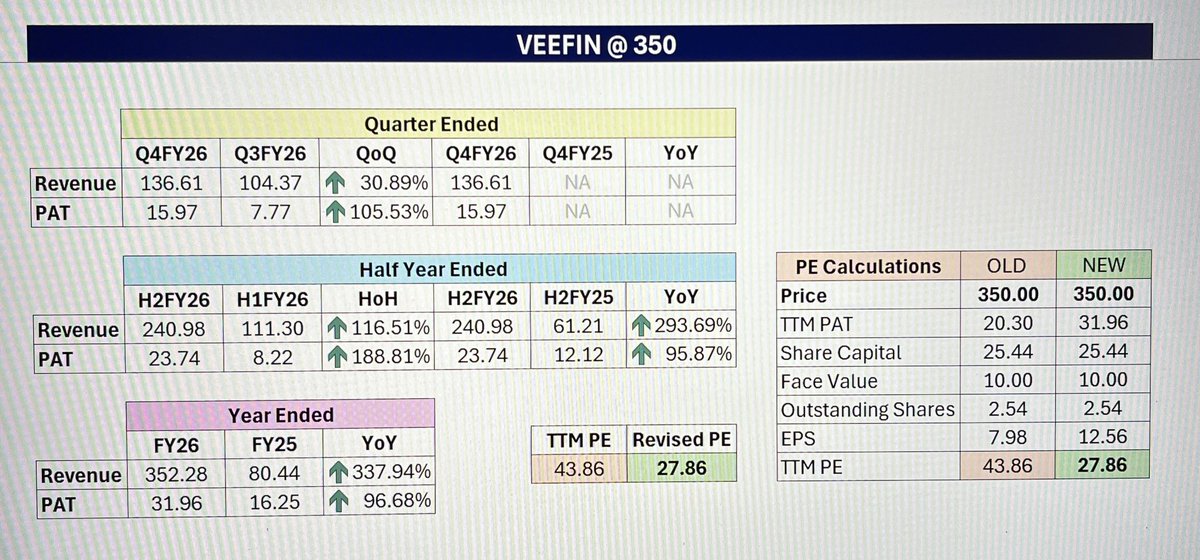
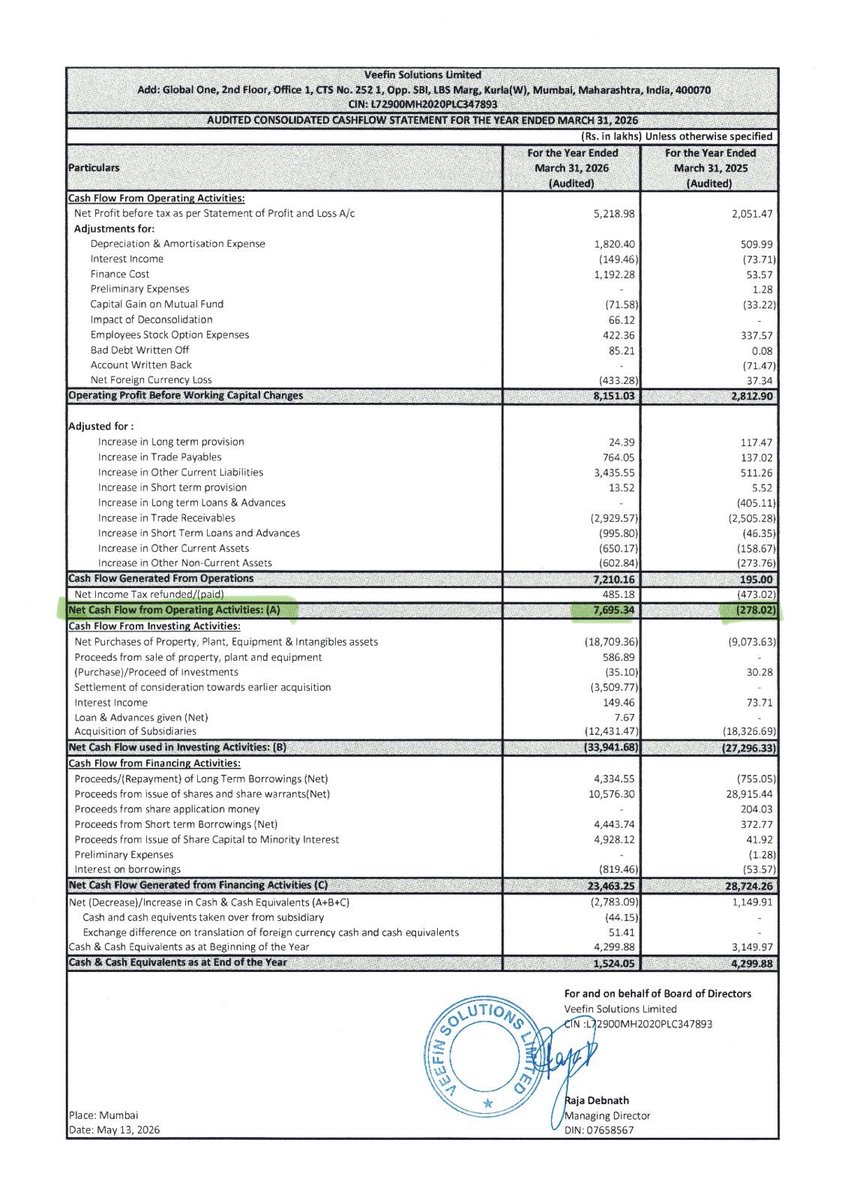
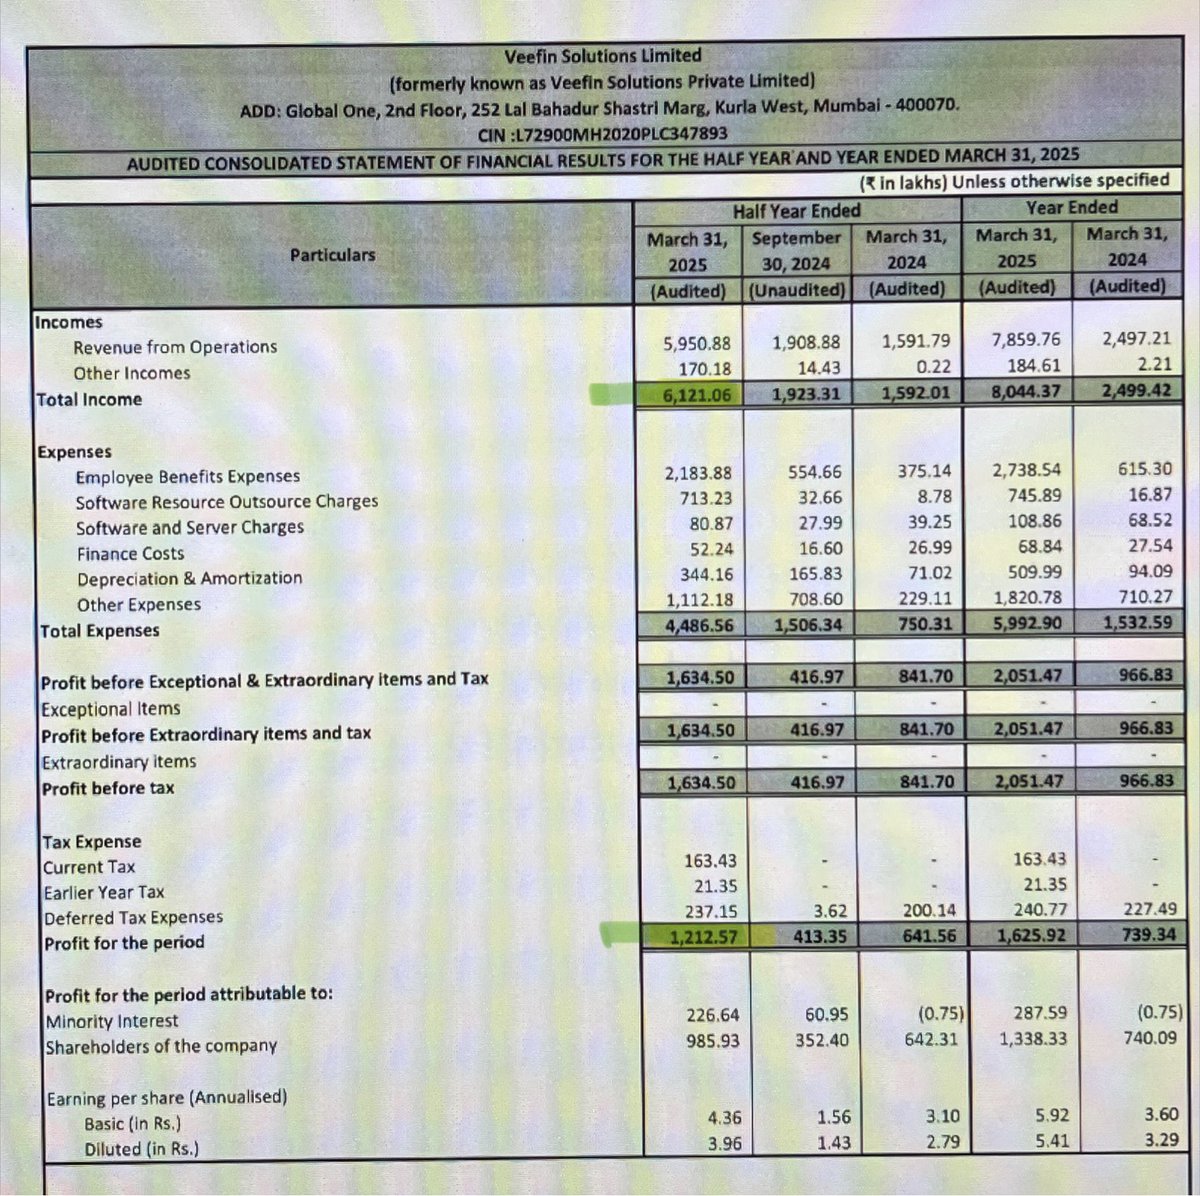
Veefin @ 350
Excellent set of numbers!
Revenue 352.28 Cr vs 80.44 Cr ⬆️ 337.94% YoY
PAT 31.96 Cr vs 16.25 Cr ⬆️ 96.68% YoY

4
379
May 11
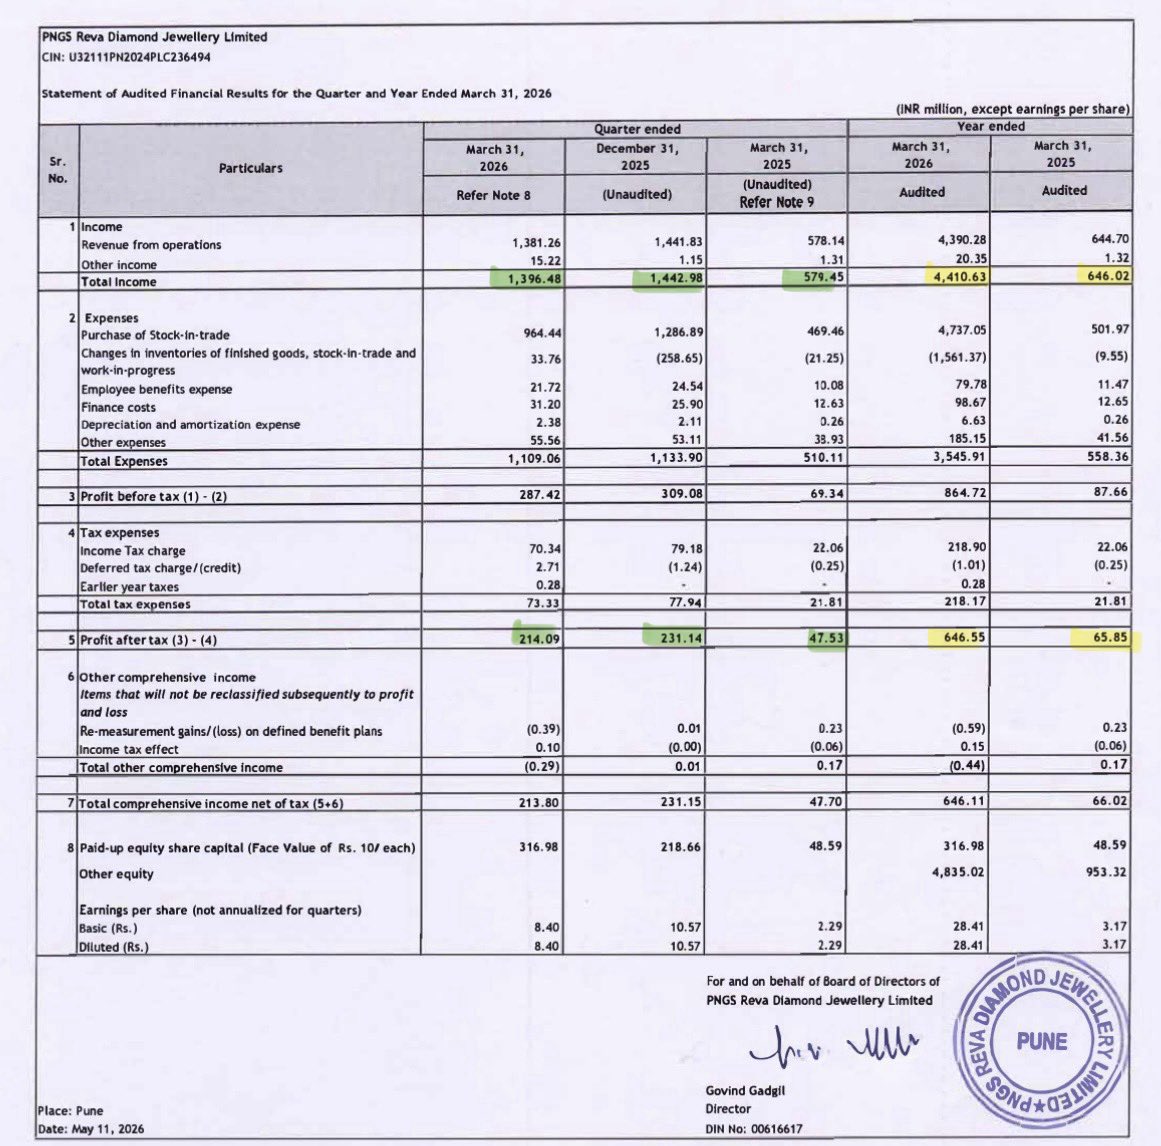
Excellent set of numbers by #PNGS #Reva
Q4FY26 vs Q4FY25
REV 138.13 vs 57.81 ⬆️ 138.9% 🔥
PAT 21.41 vs 4.75 ⬆️ 350.4% 🔥
Q4FY26 vs Q3FY26
REV 138.13 vs 144.18 ⬇️ -4.2%
PAT 21.41 vs 23.11 ⬇️ -7.4%
(Q3 - Festive season)
FY26 vs FY25
REV 439.03 vs 64.47 ⬆️ 580.9% 🔥
PAT 64.66 vs 6.59 ⬆️ 881.9% 🔥
Trade Receivables:
As of March 31, 2026, Trade Receivables stood at 2.24 Cr, compared to 0.16 Cr as of March 31, 2025.
This increase is primarily due to the massive scale-up in operations and store presence during the first full year of operations.
Operating Cash Flows:
The company reported a negative Net Cash Flow from Operating Activities of (104.83 Cr) for FY26, compared to a positive 20.57 Cr in FY25.
This was mainly due to a significant investment in Inventory worth 156.14 Cr to support the rapid business expansion.
While the operating profit before working capital changes was strong at 94.67 Cr, the aggressive inventory build-up for growth resulted in the net operating cash outflow.
May 11
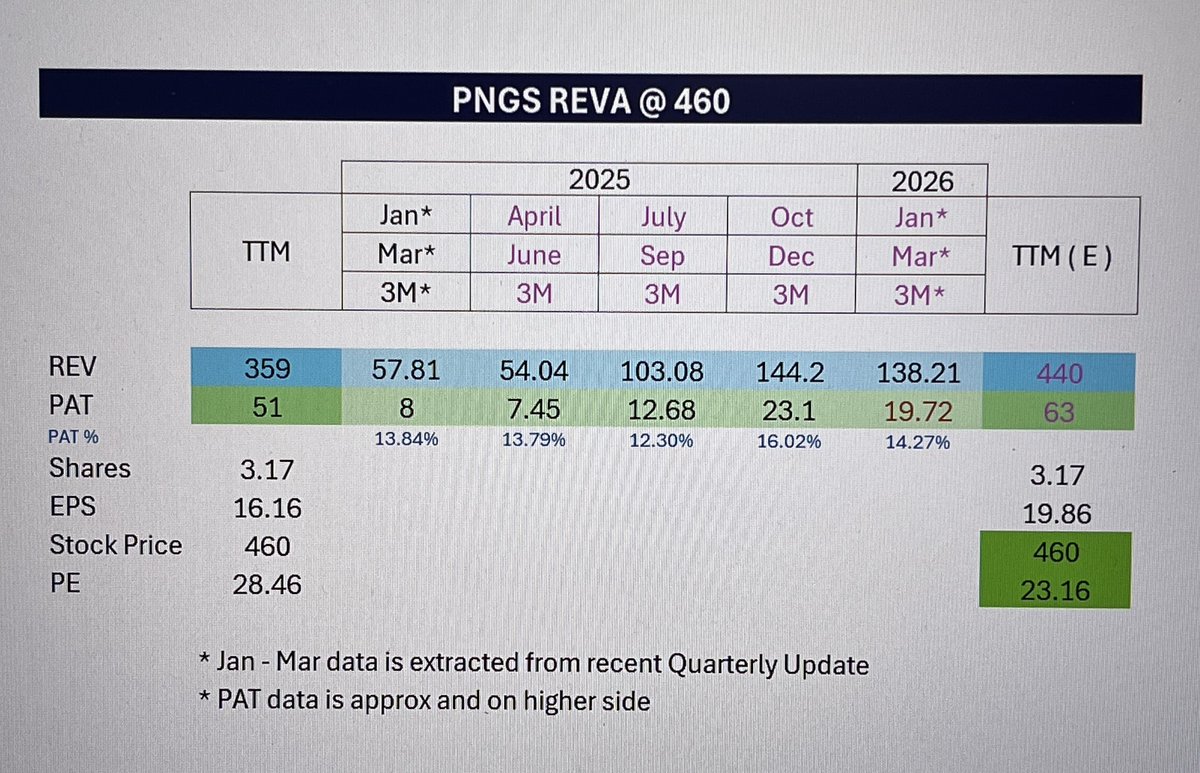
#PNGS #REVA @ 460
Expecting good numbers today!
Extracting some data from the Qtly Business Update (attached snap)
For FY26, I expect :
Top-line at 440cr
Bottom-line at 63 cr
This will rerate the PE from 28x to 23x.
Anything above and beyond will be cherry on the cake.
1
466
May 11
#PNGS #REVA @ 460
Expecting good numbers today!
Extracting some data from the Qtly Business Update (attached snap)
For FY26, I expect :
Top-line at 440cr
Bottom-line at 63 cr
This will rerate the PE from 28x to 23x.
Anything above and beyond will be cherry on the cake.
#PNGS #REVA @ 450
1400 cr M Cap
17 PE
Comparing #Gargi & #Reva
- Growth for Gargi has now consolidated but lot of headroom is visible for PNGS Reva
- Valuation comfort 32 PE vs 16 PE
- Excellent quarterly update where Q4 revenue grew by 96.9% ie almost 100% YoY
- Akshay Tritiya sales ⬆️ 267.49% 2.67 Times YoY
- EBO - 2nd Exclusive Brand Outlets opened on 15 march 2026 1st was opened on 4 Sept 2025
- Both together contributed to Rev of 6.87 Million
1
902