
Studying biodiversity and comparative genomics with a focus on the evolution of parasitism in algae and protists. Department Chair. Co-Editor, J Phycol.
- Tweets 5,275
- Following 457
- Followers 1,005
- Likes 17


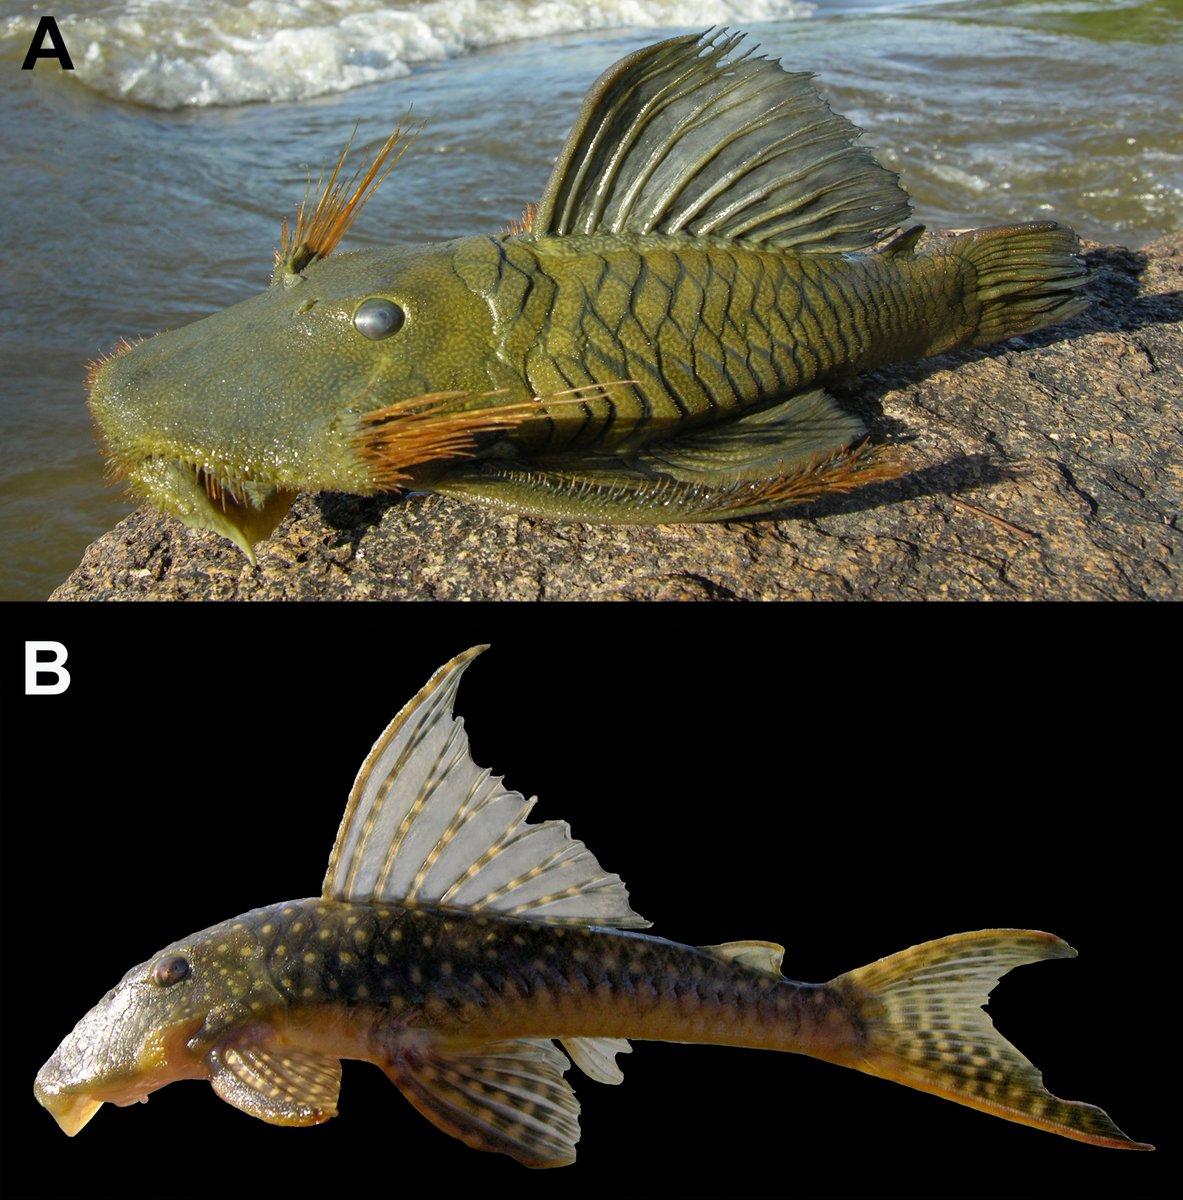
ALT Armbruster, J. W., & Lujan, N. K.. (2024). New tribe-level classification of Hypostominae (Loricariidae) based on optimization of morphological states on DNA-based relationships, with descriptions of three new tribes and two new genera. Neotropical Ichthyology, 22(4), e240108. https://doi.org/10.1590/1982-0224-2024-0108


ALT Grill with veggie skewers and a pork loin with amazing grill marks on it, like you just wanna kiss it.


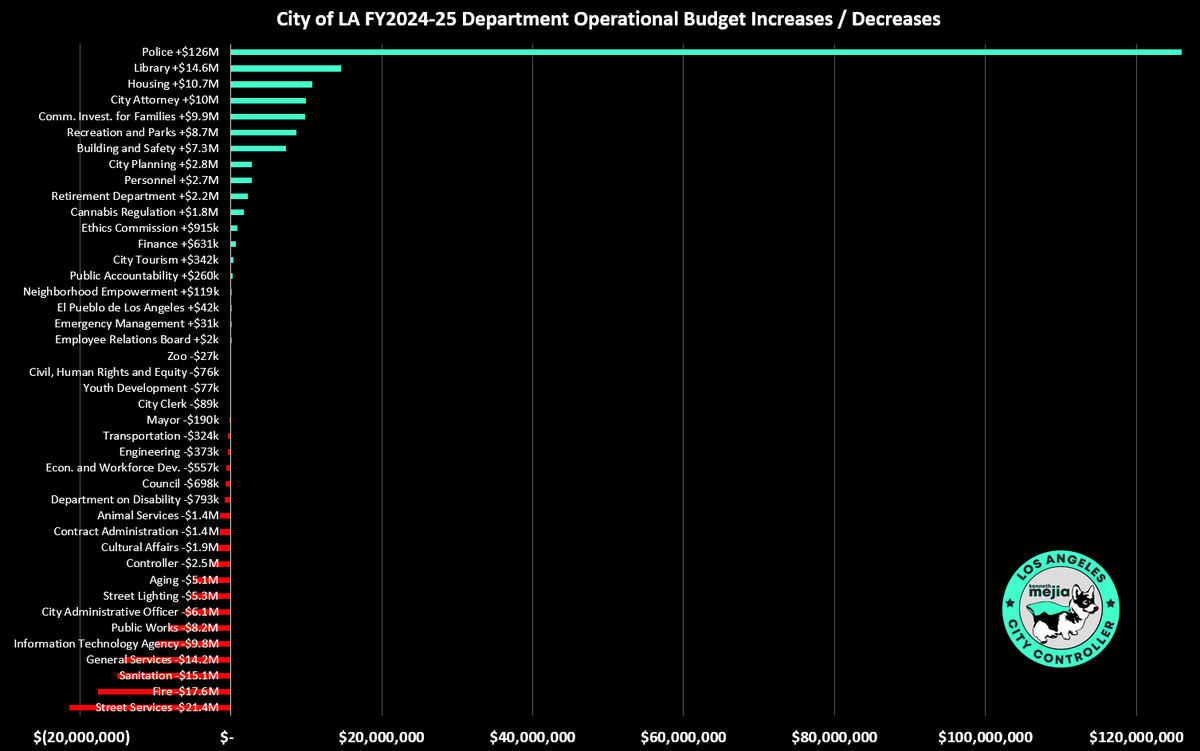
ALT Bar chart that shows increases and decreases from last fiscal year to this fiscal year. bar length is based on the increase or decrease Department Decrease vs Increase from Last Year Street Services -$21.4M $(21,370,180) Fire -$17.6M $(17,553,814) Sanitation -$15.1M $(15,086,772) General Services -$14.2M $(14,218,589) Information Technology Agency -$9.8M $(9,821,141) Public Works -$8.2M $(8,239,136) City Administrative Officer -$6.1M $(6,108,252) Street Lighting -$5.3M $(5,344,987) Aging -$5.1M $(5,067,572) Controller -$2.5M $(2,484,338) Cultural Affairs -$1.9M $(1,898,798) Contract Administration -$1.4M $(1,408,128) Animal Services -$1.4M $(1,392,128) Department on Disability -$793k $(792,898) Council -$698k $(697,579) Econ. and Workforce Dev. -$557k $(556,944) Engineering -$373k $(372,615) Transportation -$324k $(323,538) Mayor -$190k $(190,146) City Clerk -$89k $(89,110) Youth Development -$77k $(76,845) Civil, Human Rights and Equity -$76k $(76,452) Zoo -$


ALT Map of sampling locations in Indonesia showing the relative abundance of major eukaryotic groups (a). Bar chart of major eukaryotic taxa in water and sediment of each sampling location (b).

ALT Bar chart that shows increases and decreases from last fiscal year to this fiscal year. bar length is based on the increase or decrease Department Decrease vs Increase from Last Year Street Services -$21.4M $(21,370,180) Fire -$17.6M $(17,553,814) Sanitation -$15.1M $(15,086,772) General Services -$14.2M $(14,218,589) Information Technology Agency -$9.8M $(9,821,141) Public Works -$8.2M $(8,239,136) City Administrative Officer -$6.1M $(6,108,252) Street Lighting -$5.3M $(5,344,987) Aging -$5.1M $(5,067,572) Controller -$2.5M $(2,484,338) Cultural Affairs -$1.9M $(1,898,798) Contract Administration -$1.4M $(1,408,128) Animal Services -$1.4M $(1,392,128) Department on Disability -$793k $(792,898) Council -$698k $(697,579) Econ. and Workforce Dev. -$557k $(556,944) Engineering -$373k $(372,615) Transportation -$324k $(323,538) Mayor -$190k $(190,146) City Clerk -$89k $(89,110) Youth Development -$77k $(76,845) Civil, Human Rights and Equity -$76k $(76,452) Zoo -$