
Extreme weather attribution & atmospheric modeling | Focused on storylines, scenarios & climate signals | Sharing climate insights | Views my own.
Joined September 2009
- Tweets 390
- Following 135
- Followers 125
- Likes 2,192
64 Photos and videos


New News & Views in Nature Communications on conditional attribution and complex extremes.
Inspired by the 2024 Valencia flash flood study, I reflect on how we attribute highly convective events in a warming climate.
nature.com/articles/s41467-0…
1
1
8
Statistical attribution tells us how the likelihood of event classes changes.
But for complex, local extremes, we also need conditional (storyline-based) approaches to understand how climate change alters the physical processes within a specific event.
1
1
3
The next step is not choosing between methods — but connecting attribution with impact research.
If we want actionable climate science, physical insight, statistical attribution and impact analysis must go hand in hand.
#ClimateChange #ExtremeWeather #Attribution #storylines
1
4

21 Aug 2025
🚨 New paper! “Spectrally nudged storylines for extreme event attribution” (Feser & Shepherd, 2025).
Clear, concise, and educational: what they are, why they matter, and how they differ from scenarios.
🔗 nature.com/articles/s43247-0…
1
18
21 Aug 2025
SN storylines = constrain dynamics, let thermodynamics evolve freely.
➡️ Powerful for extremes (heatwaves, rainfall, storms)
➡️ Easy to interpret & communicate
A must-read for anyone into #ExtremeWeatherAttribution
5
13 Aug 2025
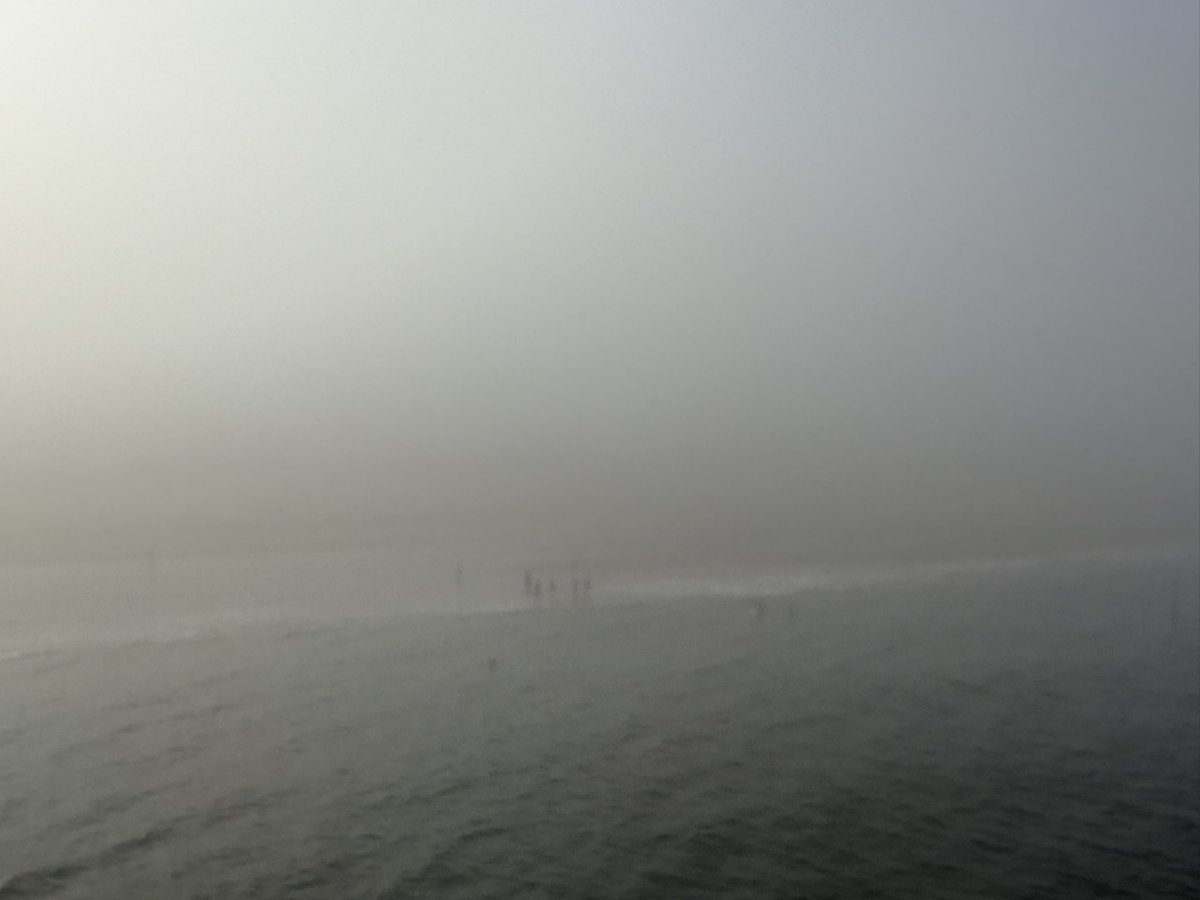
Sea fog at Scheveningen — nature’s sneaky surprise for beachgoers. Rolling in fast, stealing the sun, chilling the air… and then gone before lunch as if nothing happened.
#Scheveningen #SeaFog #CoastalWeather #BeachLife #WeatherPhenomenon #DutchCoast #zeevlam #WeatherWatch
13 Aug 2025

Zeevlam op Scheveningen. Niet te voorspellen en het gaat zeer snel. Het blijft een bijzonder fenomeen. Binnen minuten daalt de temperatuur aanzienlijk en wordt alles aan het zicht onttrokken. Meestal duurt het niet lang. #scheveningen #zeevlam #mist #denhaag @helgavanleur
377
12 Aug 2025
When extreme weather happens, the question is:
Did climate change make it more likely?
Probabilistic attribution helps us answer that question.
Learn more here:
lindavangarderen.com/extreme…
#ClimateChange #ExtremeWeather #EventAttribution #Heatwave #ClimateScience
25
11 Aug 2025
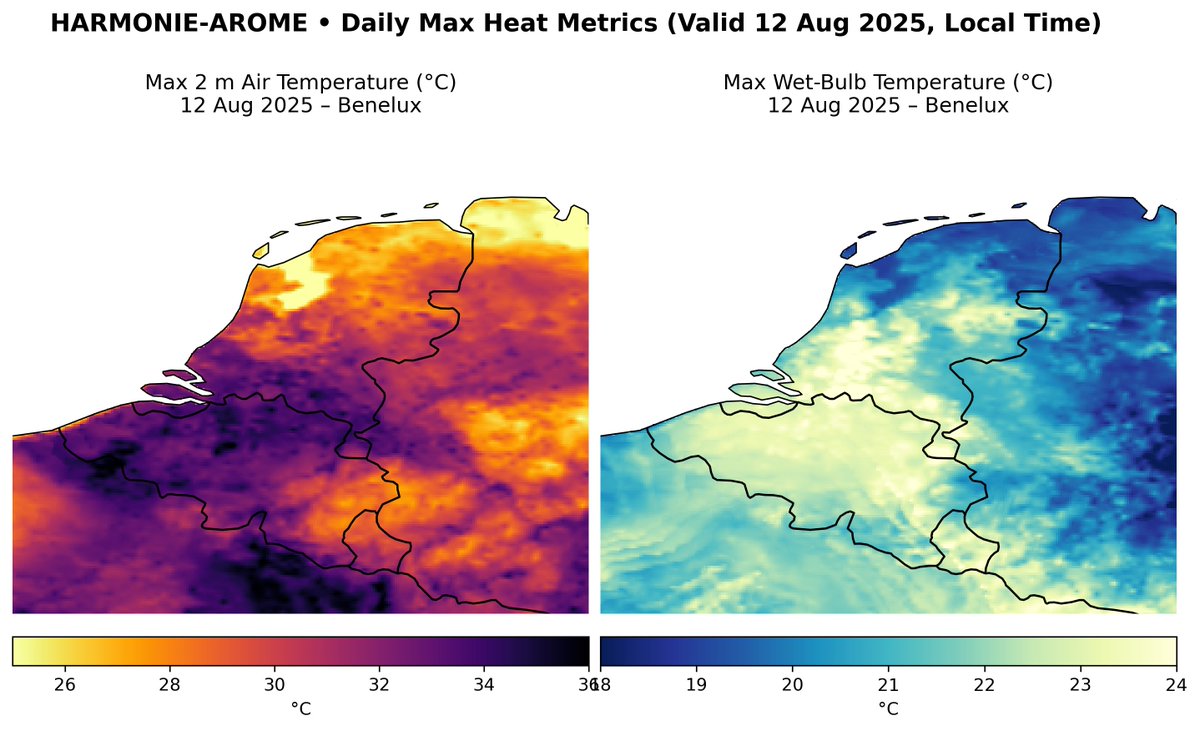
Tomorrow: hot 🔥 & muggy 💧 across the Benelux. Side-by-side map shows max 2 m air temp vs max wet-bulb temp (how muggy it’ll feel). Higher WBT = harder to cool & higher heat-stress risk. Full explainer hi-res map 👉 lindavangarderen.com/2025/08…
1
21
11 Aug 2025
Data from @KNMI UWC-West HARMONIE-AROME Cy43 (Europe)
#heat #weather #Benelux #KNMI #wetbulb #meteorology #publichealth #humidity
51
Dr. Linda Gavras - van Garderen retweeted

9 Aug 2025
July 2025 didn't break any global temperature records, but large regional records were still shattered.
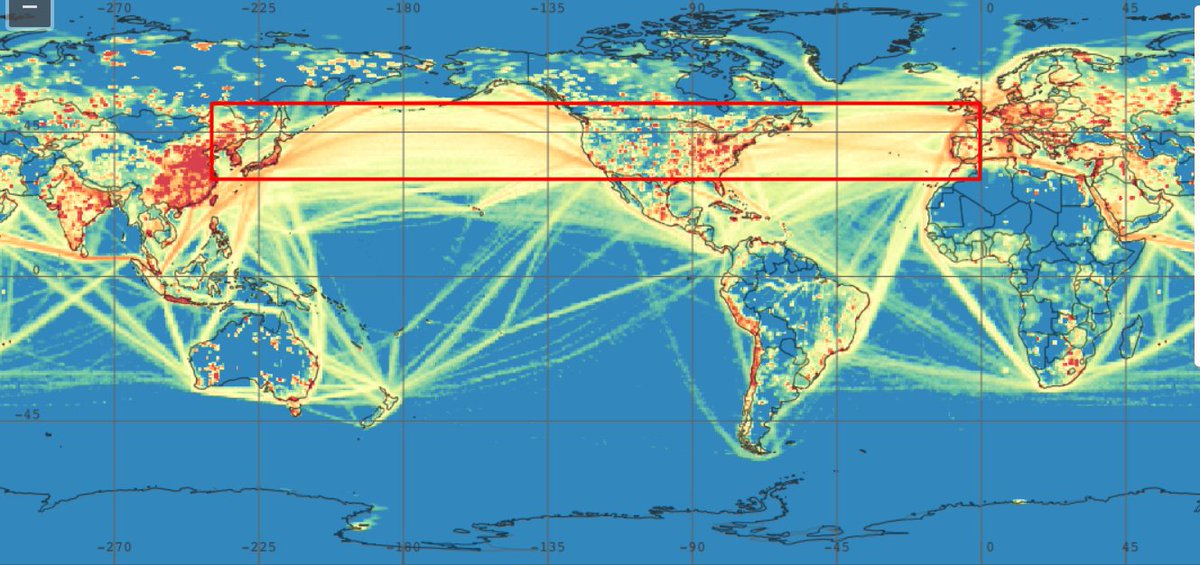
This is the largest Sea Surface Temperature Anomaly for any month for the Pacific 30-50°N region:
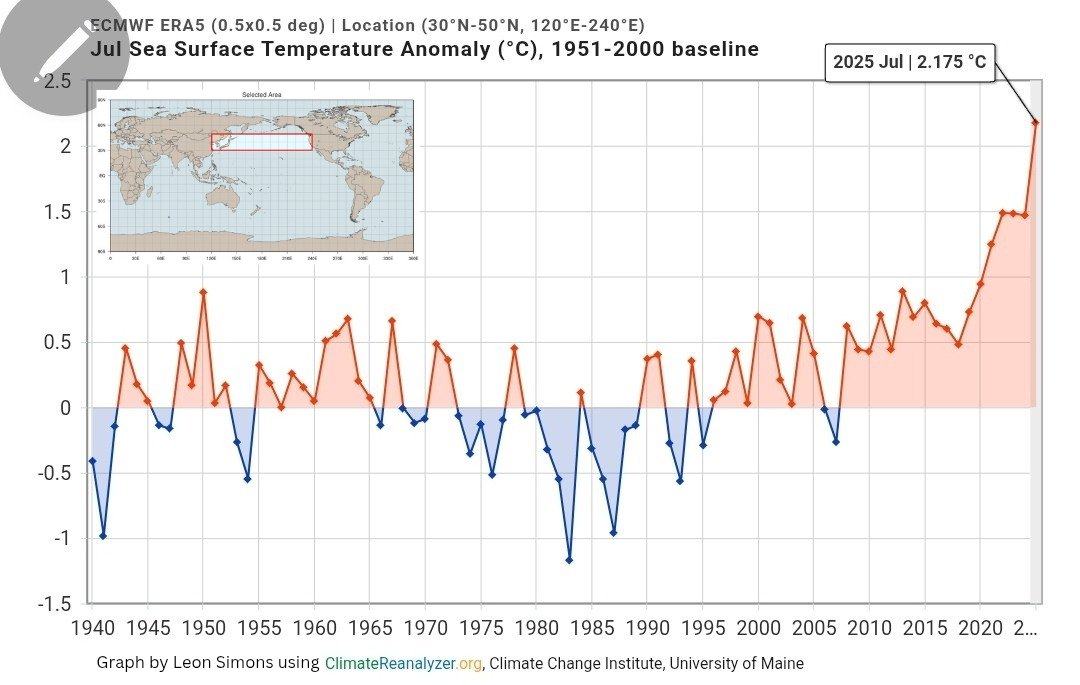
8 Mar 2023

For decades this area has been kept relatively cool by sulfur emissions from ships.
But this changed in 2020.
11
74
216
11,254
7 Aug 2025
“Adequate quality”? Not helpful.
Reading a paper twice? No thanks.
I put together a succinct peer review protocol that is to the point:
✔️ Concrete steps
✔️ No vague advice
✔️ Free PDF checklist
lindavangarderen.com/peer-re…
#PeerReview #ClimateScience #AcademicLife #OpenScience
1
15
Dr. Linda Gavras - van Garderen retweeted

2 Aug 2025
Het eerder afgegeven advies over de wolf is verder aangescherpt: blijf weg uit alle landgoederen, bos- en natuurgebieden op de Utrechtse Heuvelrug tussen A12 en A28.
Lees het bericht en de actuele adviezen op: provutr.nl/246b12

ALT Beeld: Manuel Reichert
88
23
24
105,159
1 Aug 2025
Lovely explainer on the meteorology of heatwaves for those who would like to go a bit more in depth 🤓🤓
1 Aug 2025

when it's hot outside, I feel the need to continually repost an old post of mine about the meteorology of heat waves
theclimatebrink.com/p/anatom…
11
30 Jul 2025
Can we really say climate change made a heatwave or flood worse?
Yes — through extreme weather attribution.
Here’s a quick explainer 🧵
#ClimateScience #ExtremeWeather
2
30
30 Jul 2025
By comparing outcomes, scientists detect the climate signal.
In this example, the world with climate change (factual) shows much higher temperatures than the world without it (counterfactual).
That difference? That’s the fingerprint of climate change.
1
16
30 Jul 2025
Thanks for reading! 🙏
This is part of my ongoing work in climate science.
More on my site (including my CV): lindavangarderen.com
Connect on LinkedIn: linkedin.com/in/linda-gavras…
#ClimateChange #AttributionScience #SciComm
42
9 Jul 2025
Wrapping up your PhD thesis? 🎓
Check out my latest blog with key tips that helped me get through those final months — scheduling, limiting distractions, and being honest about how you’re feeling.
Read more here: lindavangarderen.com/2025/07…
#PhDLife #ThesisWriting #AcademicTips
11