
News and information about the Met.3D meteorological visualization framework. Met.3D research @unihh RRZ within @WavesToWeather and #CLICCS @CENunihh.
Joined September 2021
- Tweets 19
- Following 15
- Followers 81
- Likes 13
4 Photos and videos

Met.3D retweeted

24 Feb 2022
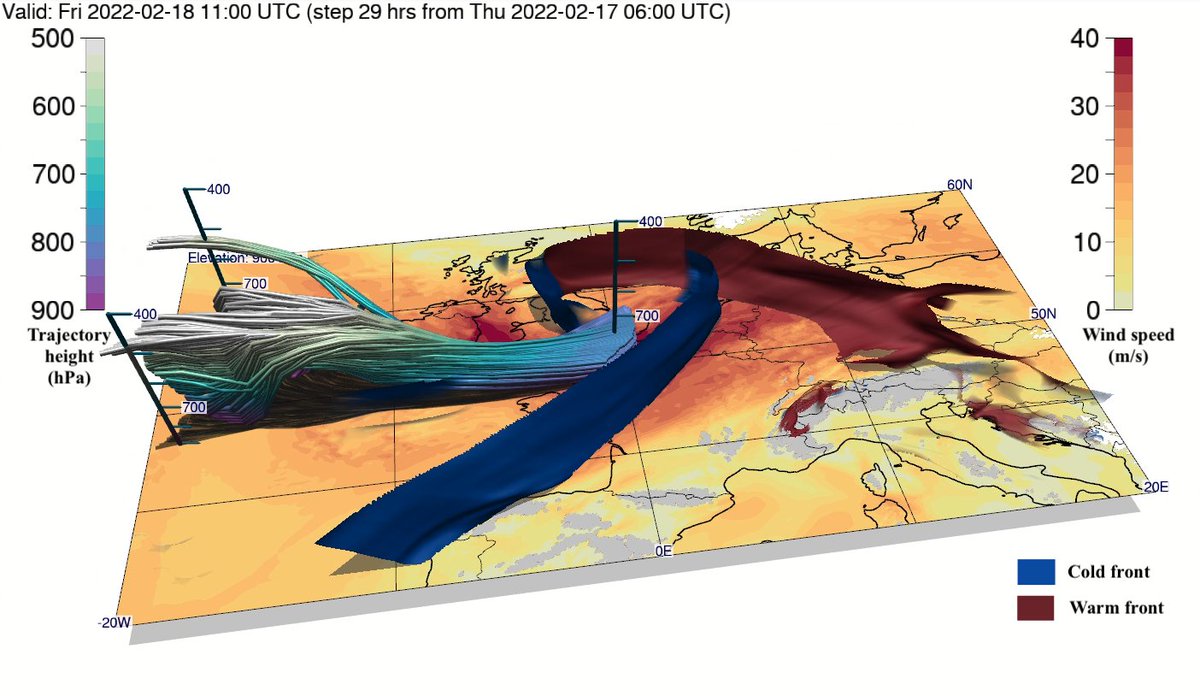
Thanks a lot @an_beckert for adding 3D fronts and animating the different starting times! @Met_3D really is an amazing visualisation tool!

1
11
Met.3D retweeted

24 Feb 2022
Time animation over 12h of the scene shown above. Visualized with @Met_3D.
1
14
Met.3D retweeted
24 Feb 2022
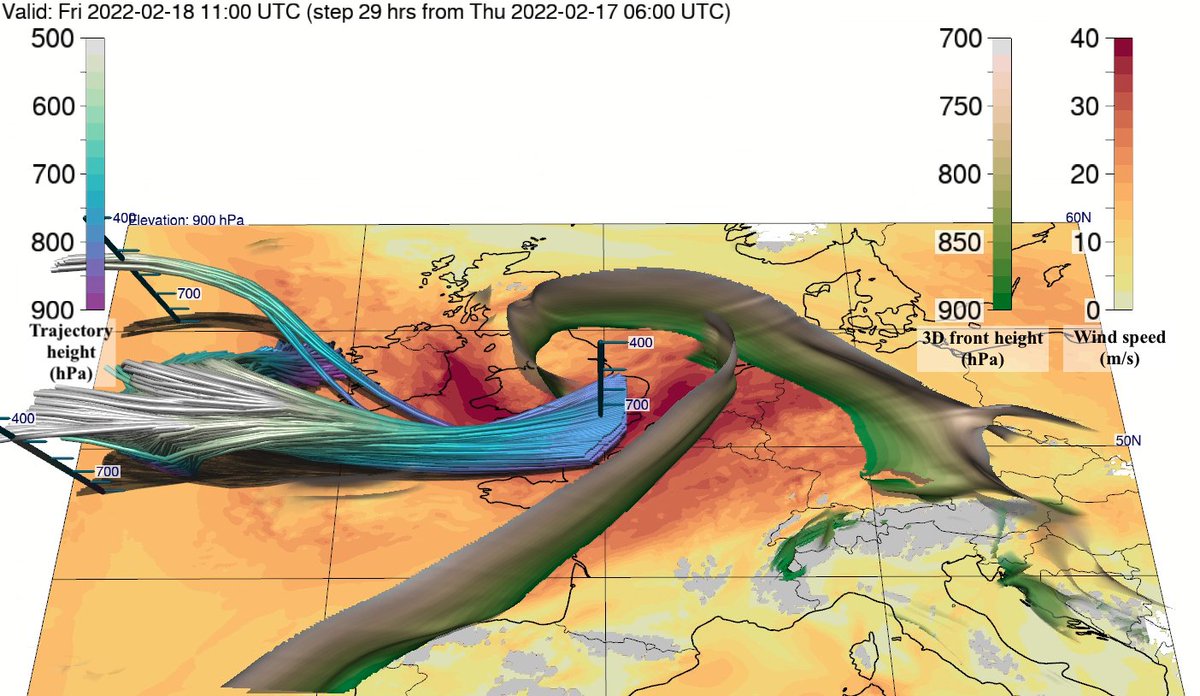
Descending #stingjet trajectories in the vicinity of frontal fracture as shown by @LeaEisenstein and 3D fronts of #StormEunice / #Zeynep visualized with @Met_3D.
21 Feb 2022

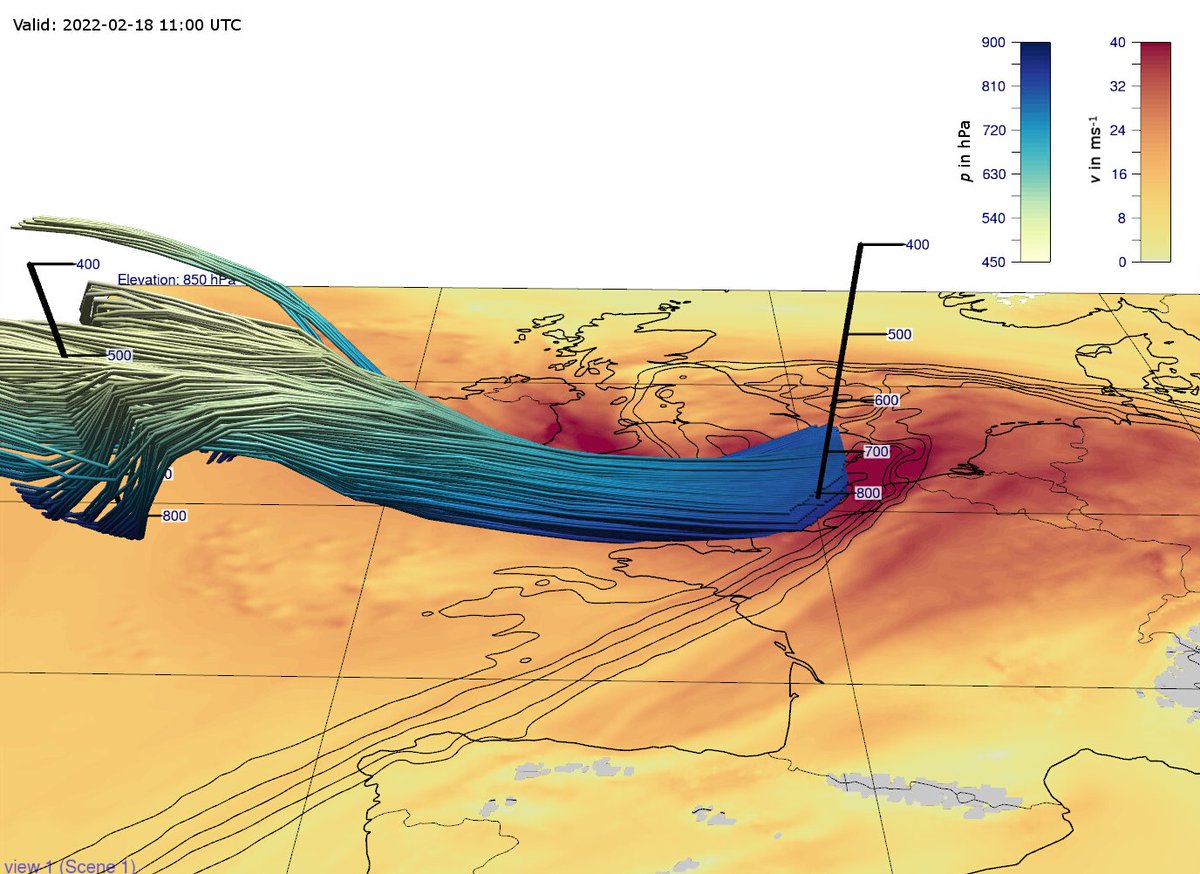
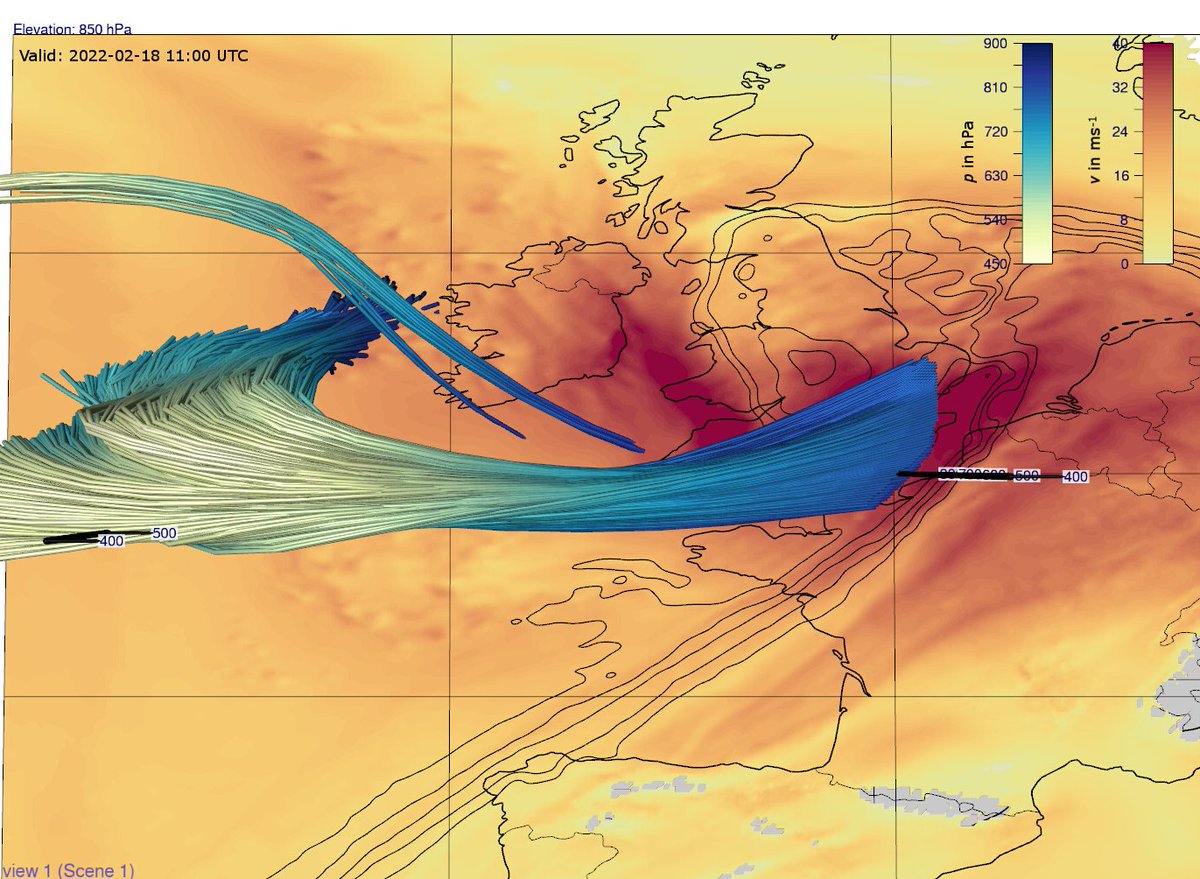
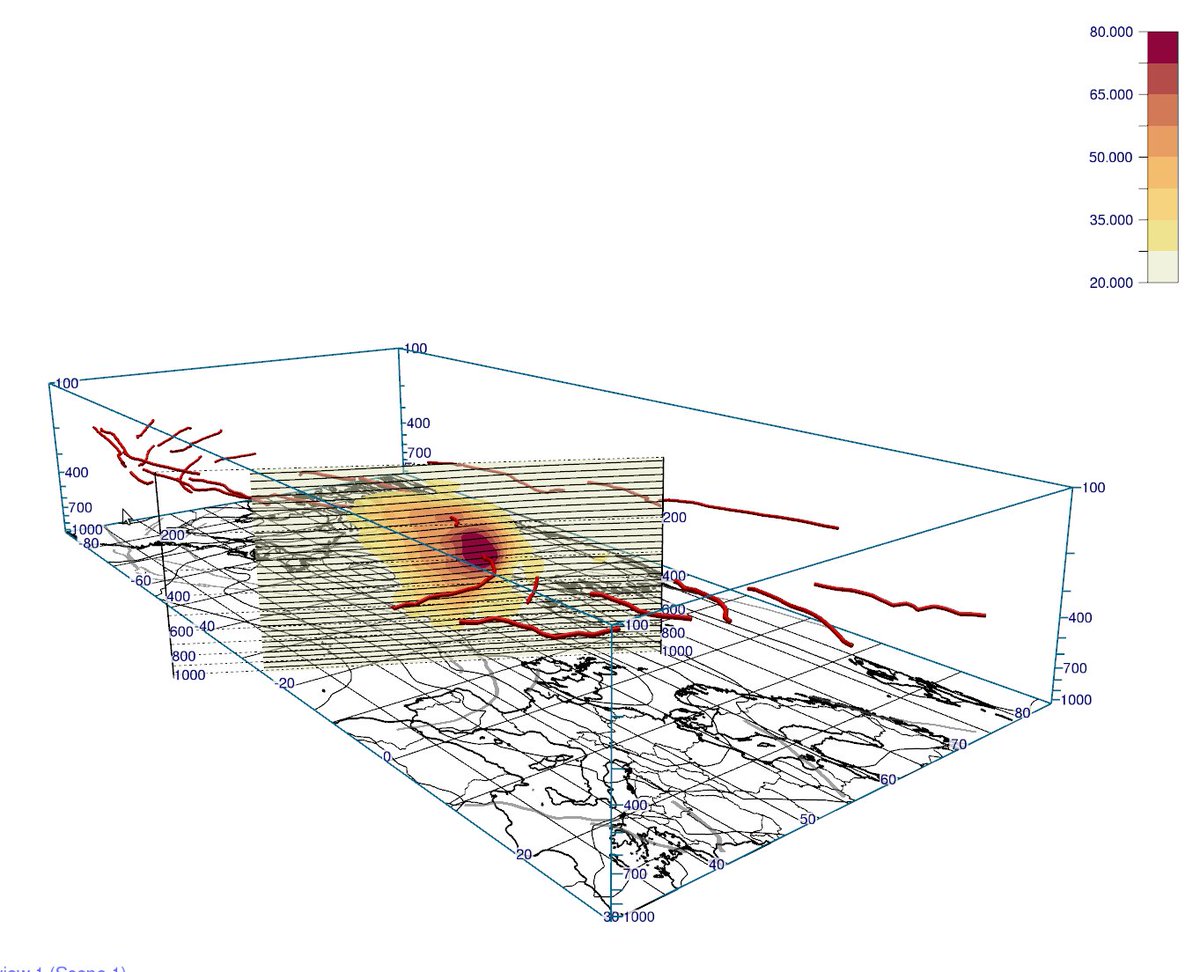
ICON simulations show plenty trajectories descending to the boundary layer for several hours confirming a #stingjet during #StormEunice/#Zeynep. Here is an example for 11 UTC using @Met_3D. However, if and where it reached the surface isn’t certain.
1
1
4
Met.3D retweeted
21 Feb 2022
ICON simulations show plenty trajectories descending to the boundary layer for several hours confirming a #stingjet during #StormEunice/#Zeynep. Here is an example for 11 UTC using @Met_3D. However, if and where it reached the surface isn’t certain.
18 Feb 2022

Satellite images of #StormEunice show signs of a #stingjet, an area of intense wind shown by the hook-shaped cloud, when it formed over the Atlantic, South West of Ireland
Chief Scientist Stephen Belcher said he's “proud of the Met Office work in giving due warning of the storm”
10
87
Met.3D retweeted

27 Jan 2022
I submitted my first paper with colleagues from @WavesToWeather & @Met_3D a few weeks ago in @EGU_GMD! Interested in learning upsides of a 3D perspective in the world of PV? It is in public discussion right now: gmd.copernicus.org/preprints…
2
4

Example of flow visualization: a @Met_3D animation illustrating atmospheric transport of rust pathogens is shown in a presentation within this @metoffice #COP26SciencePavilion session from 06 Nov 2021 (at 59:09 min): youtu.be/M-TPpEcsBmk?t=3549

Met.3D retweeted
10 Nov 2021
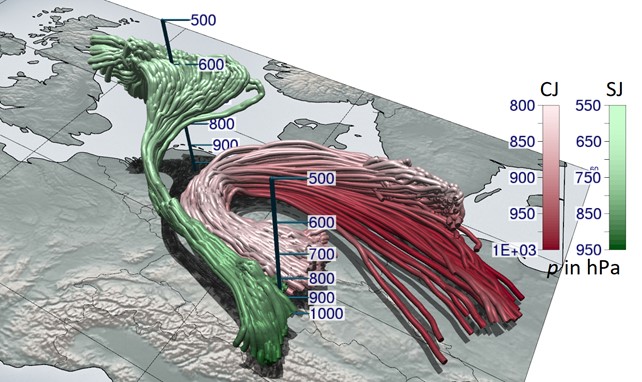
Winterstorms can bring hazardous wind gusts caused by features such as the #coldjet & the rare #stingjet. Within @WavesToWeather & the group of @PKnippertz at @KITKarlsruhe we're working on an objective identification of these. #windfluencer
@Met_3D vis: doi.org/10.1002/qj.3666
1
1
12
This @esa news article provides more information about the @DLR_en #JATAC AVATART @esa_aeolus validation campaign, during which @Met_3D was used (see bottom of article): earth.esa.int/eogateway/news…
2
Met.3D retweeted

11 Oct 2021
We will showcase tools developed in @WavesToWeather at a hands-on workshop on 4 September 2022 (on Sunday before the Annual Meeting of @EuropeanMetSoc).
#DataAssimilation #ProbabilisticForecasts @Met_3D and more!
Stay tuned for updates: wavestoweather.de/meetings/h…
2
2
Met.3D retweeted

28 Sep 2021
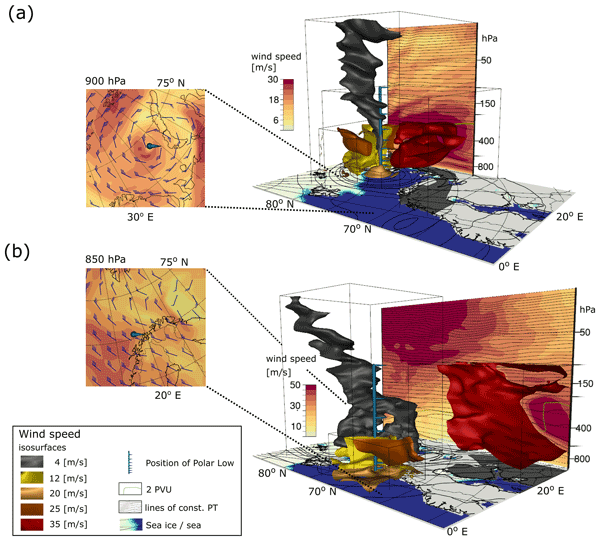
When and where will a polar low occur? A new method for interactive 3-D visual data analysis reveals insights that improve distinguishing the times and locations of polar lows. See new #CLICCS paper by Marcel Meyer et al. wcd.copernicus.org/articles/…
1
2
4
Met.3D retweeted

22 Sep 2021
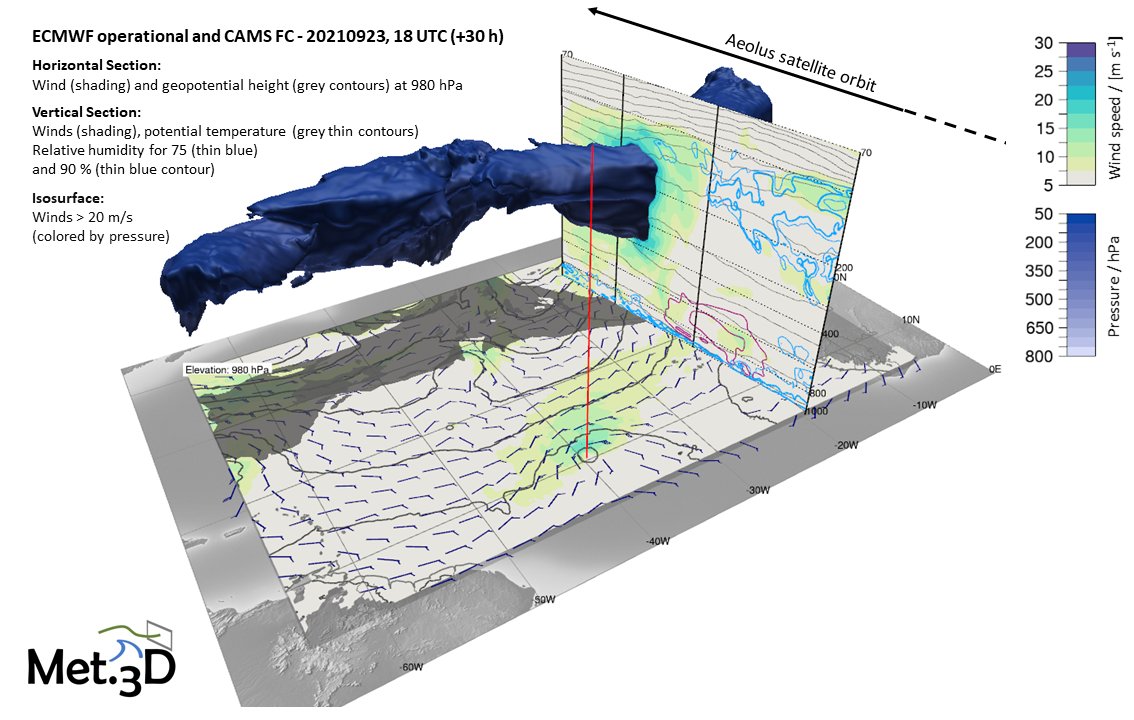
@Met_3D vis of @CopernicusECMWF @ECMWF #CAMS FCs for tomorrows @DLR_de Falcon flight during the @esa_aeolus #JATAC #Aeolus validation campaign. Figs show the wind situation along the sat/aircraft tracks and SAL dust transport in connection with a tropical wave SW of #CapeVerde.
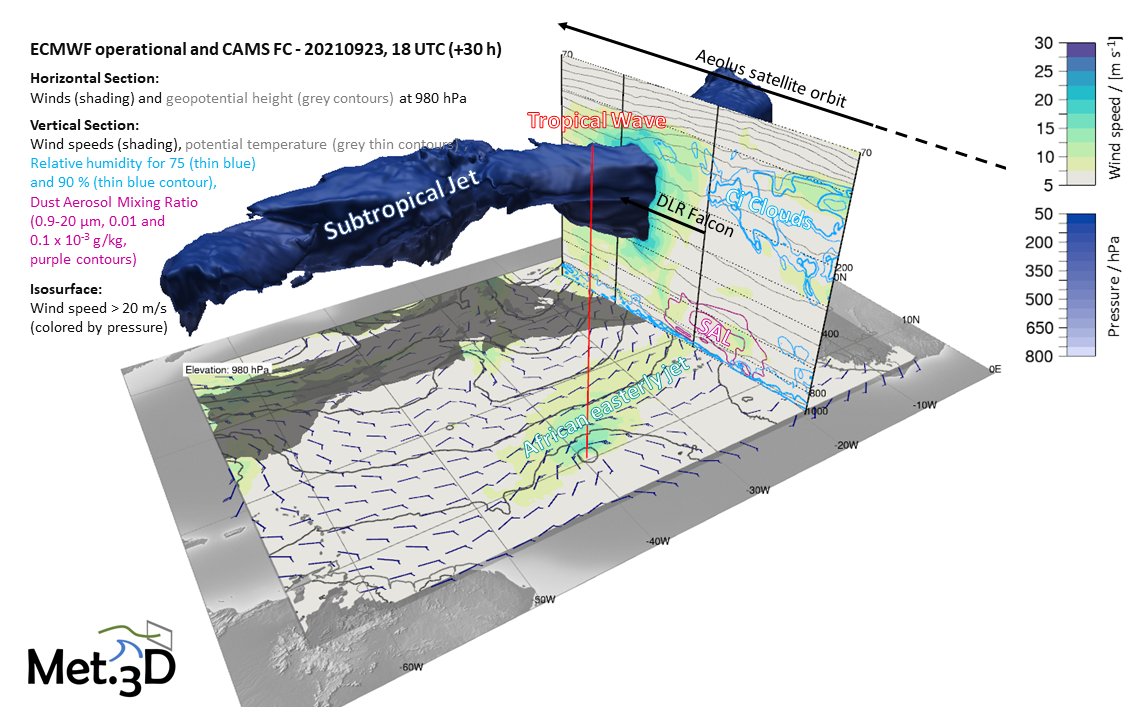
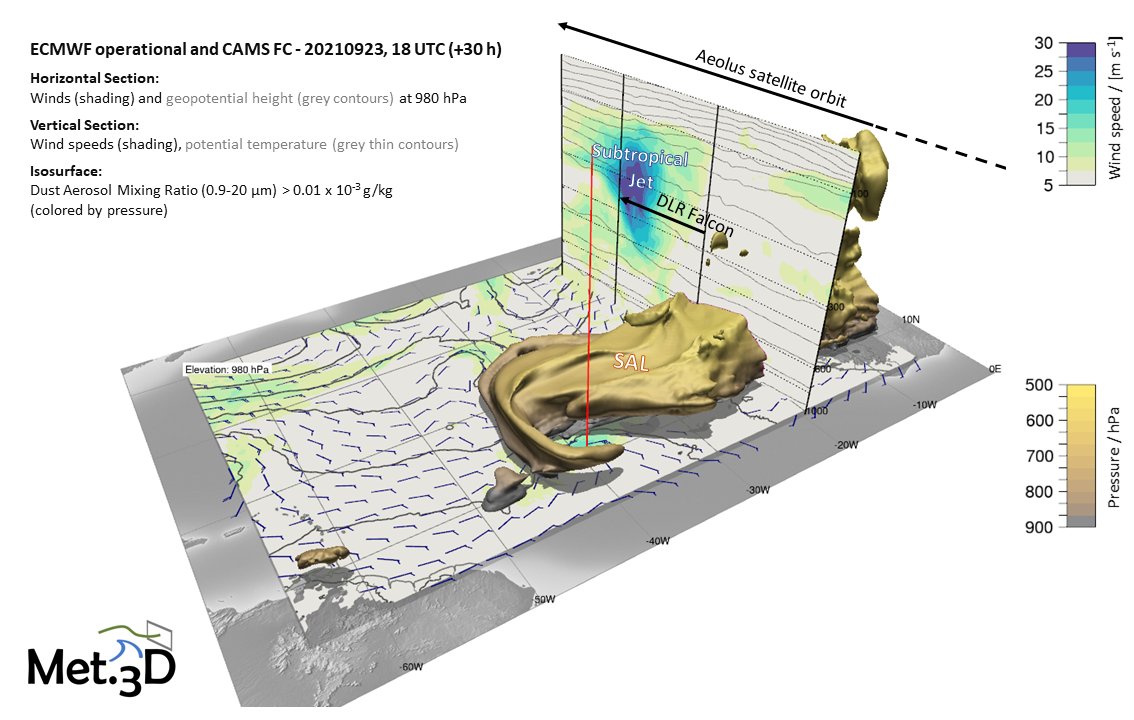
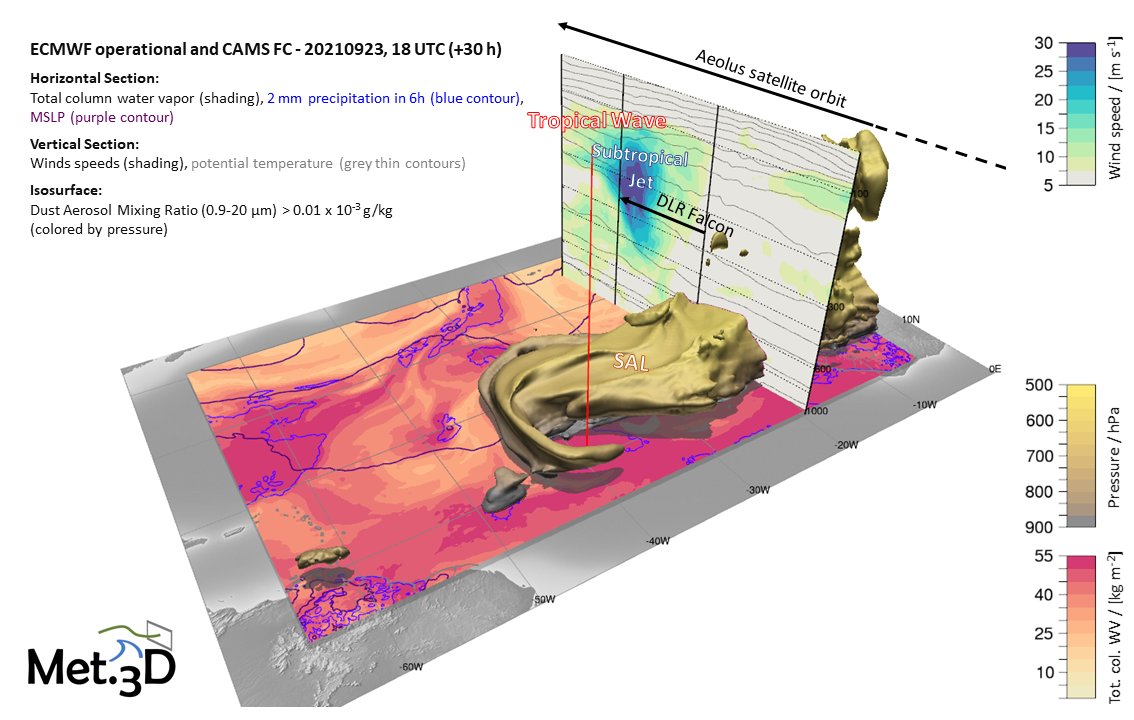
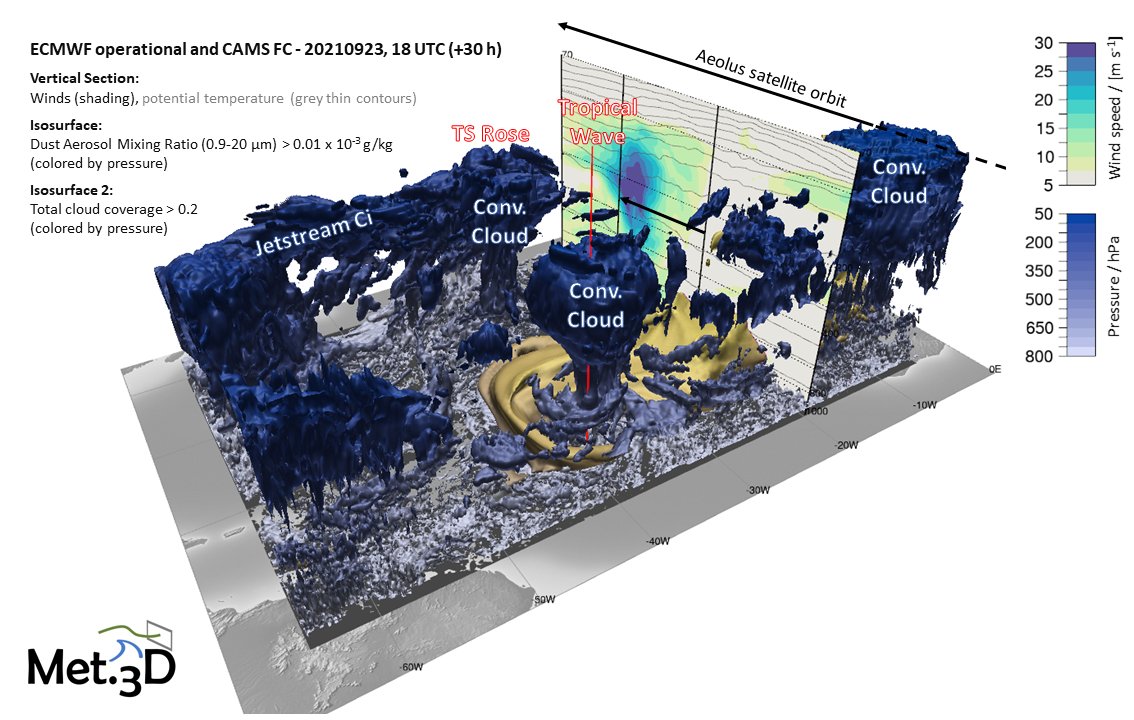
2
15
34

Vorhergesagte Windgeschwindigkeit am 17.09.21 um 20 MESZ über den Kapverdischen Inseln: Die DLR Falcon fliegt unter der #Satellitenspur von #Aeolus und misst einen Teilabschnitt. Sie überfliegt dabei die Bodenstation in #Mindelo (markiert durch die dunkelblaue vertikale Linie)...
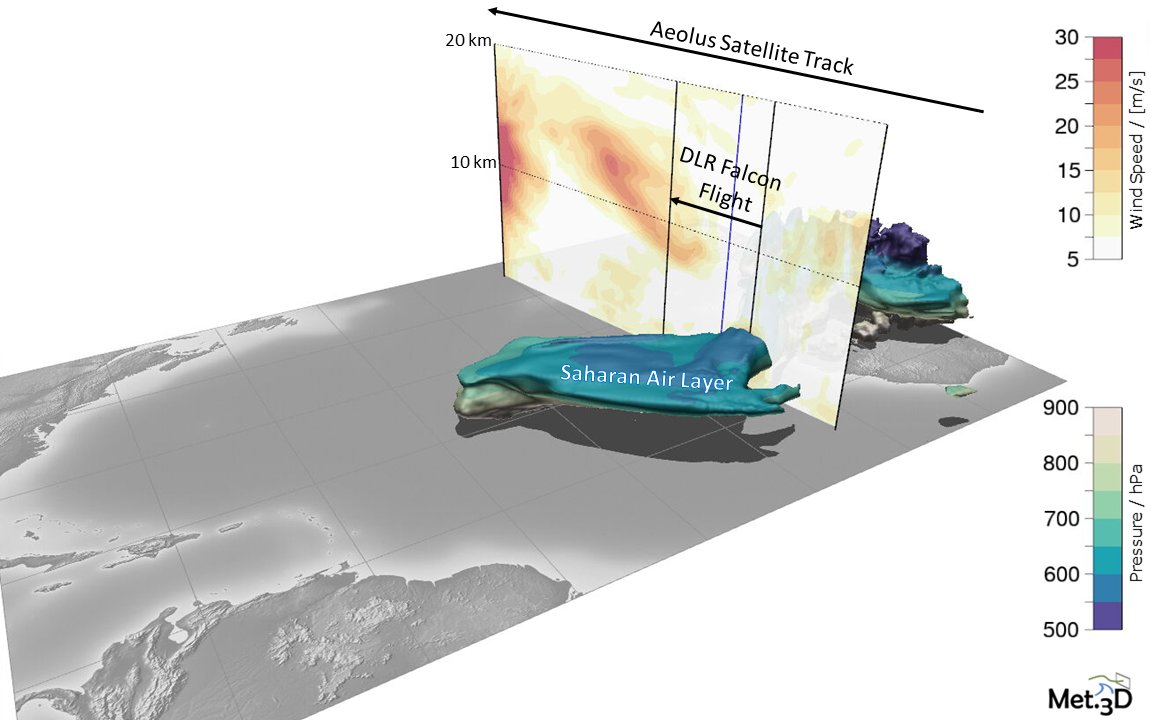
1
2
13
@Met_3D is currently used in @WavesToWeather collaboration to plan @DLR_de Falcon flights for #AVATART campaign, supporting #JATAC @esa_aeolus validation campaign of #Aeolus satellite. Vis shows @CopernicusECMWF @ECMWF #CAMS forecast for flight along satellite orbit over tropics.
1
Impressions from the past years...
11 Jun 2019

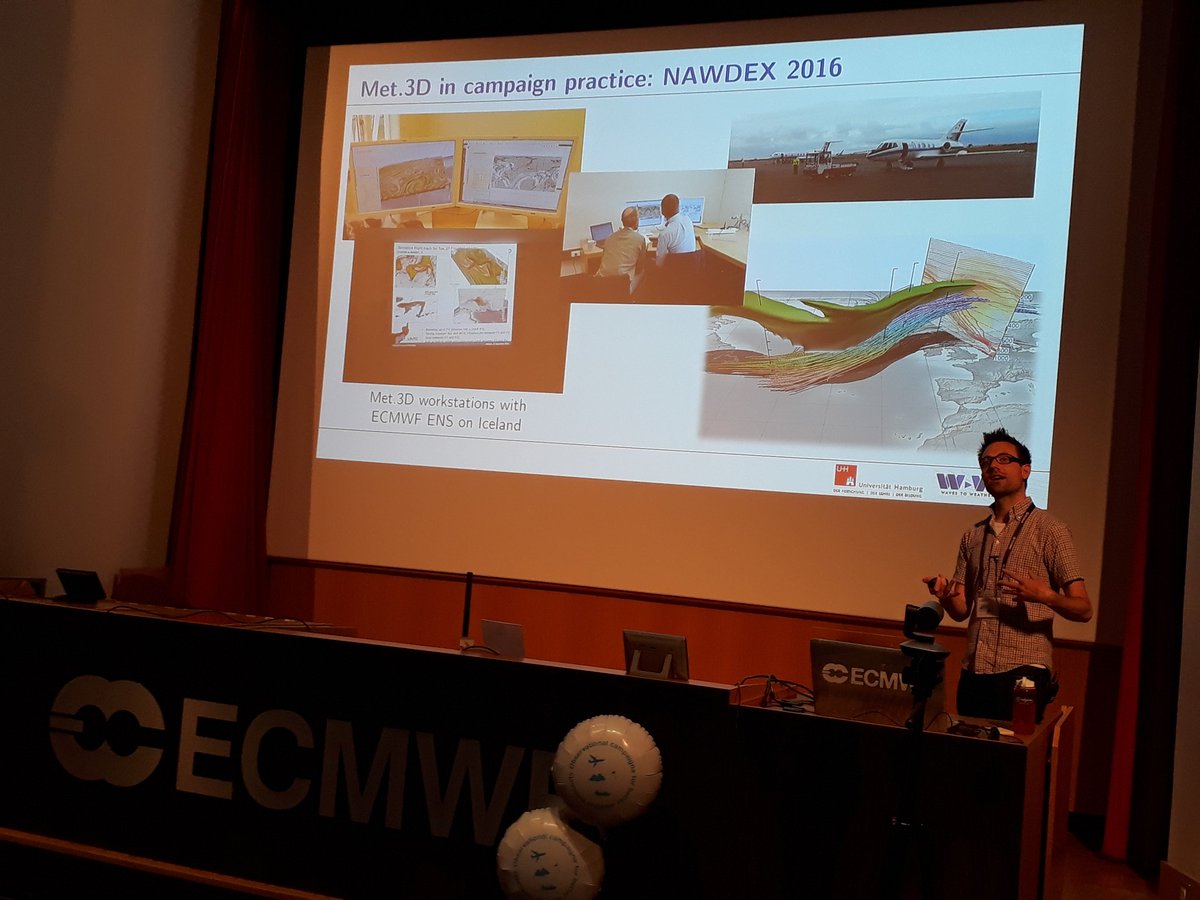
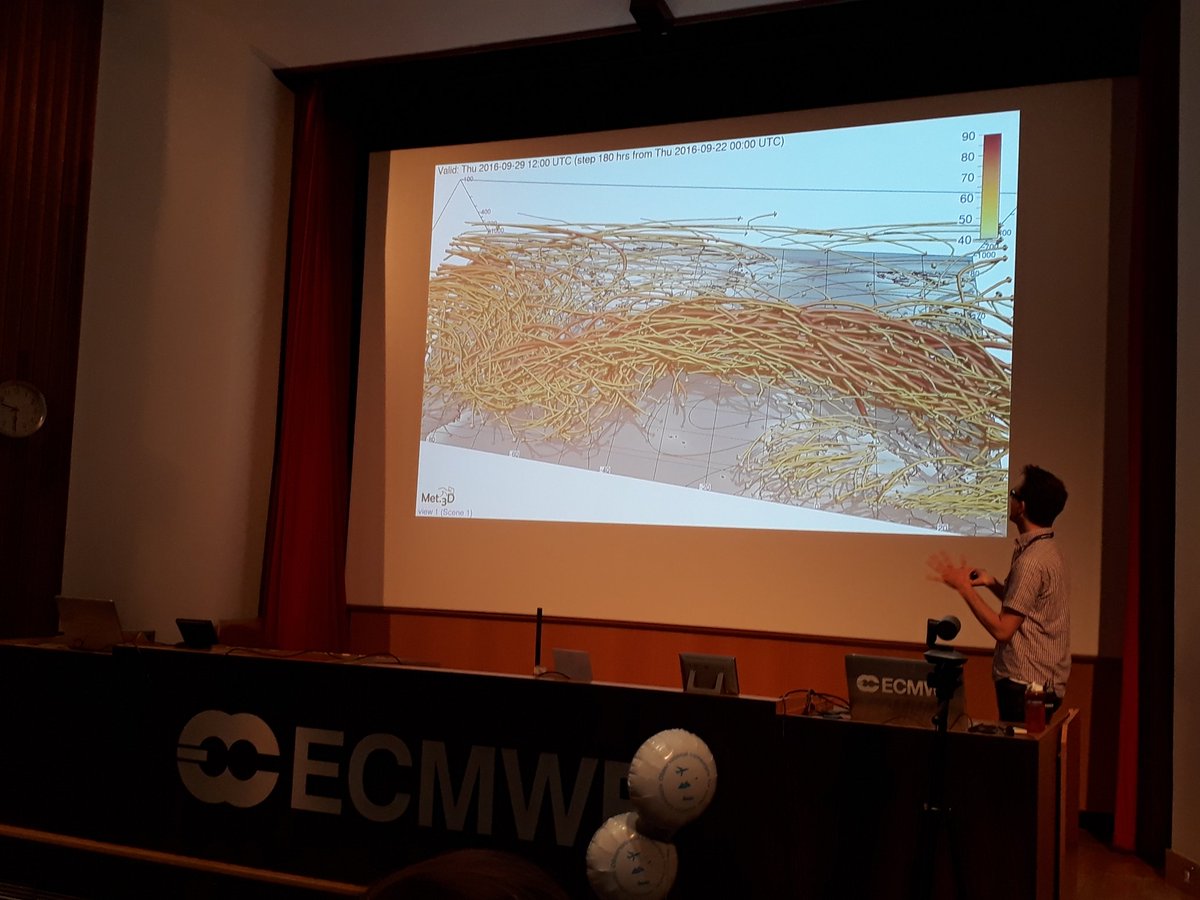
Marc Rautenhaus @unihh shows how really cool visualisations of @ECMWF ensemble forecasts with Met3D were used for flight planning in #NAWDEX @DLR_en. Especially liked this brilliant spaghetti plot (good example of #sciart @ArnalLouise ?) #ObsCampaignWS
Impressions from the past years...
22 Nov 2017

Enjoyed the Met3d visualisation session with Marc Rautenhaus of @TU_Muenchen here at @ECMWF today.
In this new @EGU_WCD publication we use @Met_3D to visually analyze marine cold air outbreaks and polar lows in @ECMWF #ERA5 #reanalysis data.
15 Sep 2021

New research article: Interactive 3-D visual analysis of ERA5 data: improving diagnostic indices for marine cold air outbreaks and polar lows doi.org/10.5194/wcd-2-867-20…
1
Back to the beginnings...
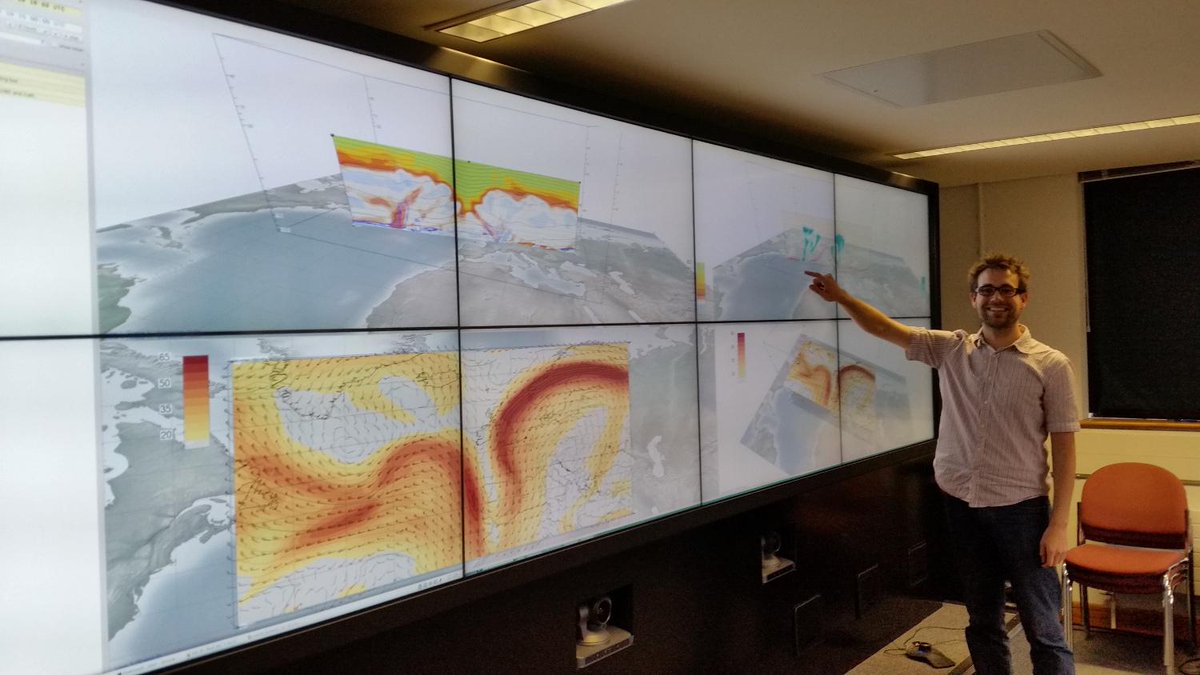
6 Oct 2015

Great demo of Met.3D #viz s/w on @UniofReading videowall by Marc Rautenhaus of @TU_Muenchen. bitbucket.org/wxmetvis/met.3…
1
Met.3D is an open-source research #visualization framework targeted at interactive, three-dimensional visualization of gridded #atmospheric datasets and visualization research. More information is available at met3d.wavestoweather.de