Late-season storms brought much-needed moisture to parts of the West, but they didn’t come close to erasing the deficit.
New at snow.news: update on snow drought and remembering my dad, who helped inspire my love of journalism and weather.
snow.news/p/snow-drought-upd…
April 1 is a key milestone for the West’s snowpack.
This year’s data paint a disturbing portrait of the historic snow drought.
Eight states are at record lows for snow water equivalent.
My latest post at snow.news:
snow.news/p/snowpack-april-1…
When the West’s snowpack is meager—or entirely missing—it underscores how much we depend on this seasonal accumulation of ice crystals, even during the summer and far beyond the region.
snow.news/p/missing-snowpack…
More grim news about the West's snow drought:
🛰️ Lowest Feb. 1 snow cover in the satellite record (since 2001)
📉 Record-low Feb. 1 snowpack in Oregon, Colorado, and Utah
⚠️ “A Dry, Warm January Leaves the West With the Worst Snowpack in Decades”
drought.gov/drought-status-u…
The American West’s snowpack is valuable for many reasons, but can its worth be calculated in dollars and cents? And how is climate change affecting that value? #cawatermavensnotebook.com/2026/02/0…
I summarized 5 scientific studies that examine how climate change is reshaping the Winter Olympics.
New post at snow.news also includes an update on the West’s meager snowpack.
snow.news/p/winter-olympics-…
NASA: Western U.S. snow cover is tracking at record-low levels for January, based on satellite observations dating back to 2001.
science.nasa.gov/earth/earth…
A recent study argues for monitoring the West’s snowpack at strategic hotspots—rather than mapping entire basins—but it has sparked pushback from supporters of airborne snow monitoring.
My latest for The Water Desk unpacks the science and implications:
waterdesk.org/2025/12/scient…
The American West could sure use some snow.
The snowpack in seven states is below 50% of normal.
It's still early in the season, but there's a lot of catching up to do.
More details at snow.news:
snow.news/p/grim-western-sno…
“The changes to #snow and snowpack are changes that we have more confidence in than just about any other water parameter because of the direct effect of warming on snowpack and snow precipitation,” says WWA Water Resources Specialist, Liz Payton. #climatewaterdesk.org/2024/04/nation…
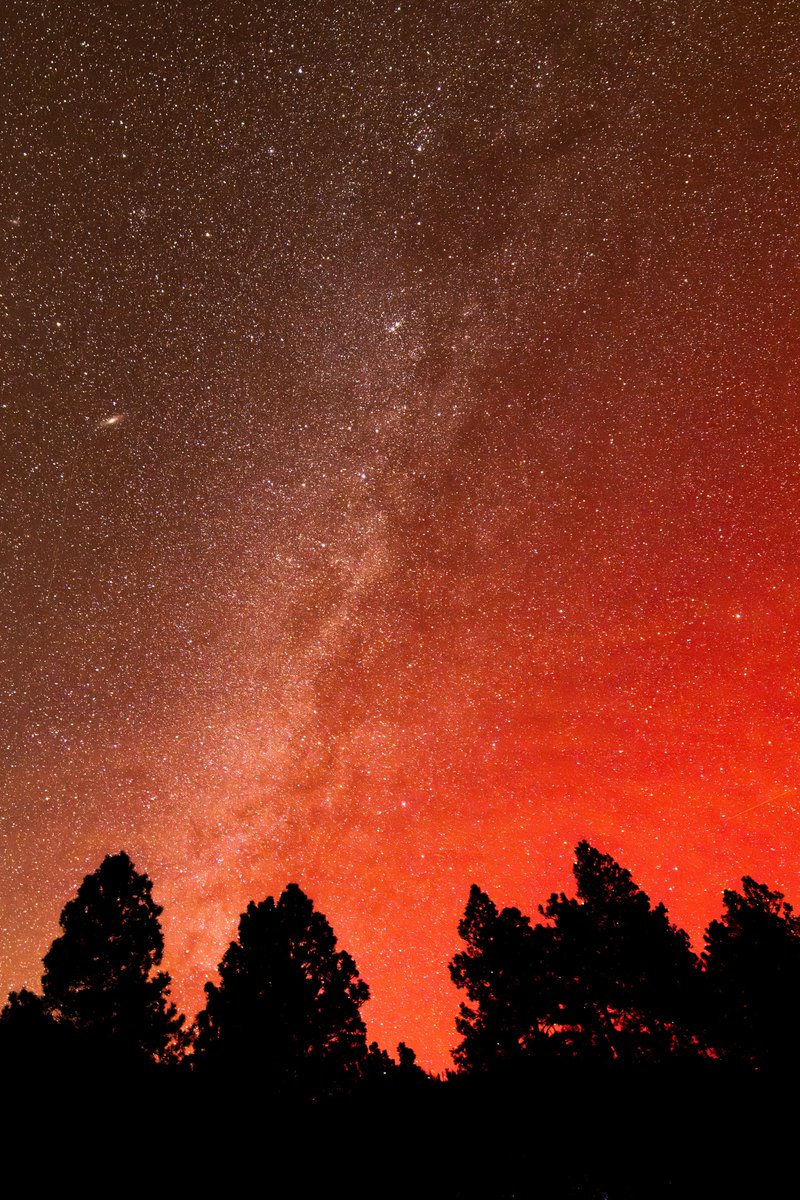
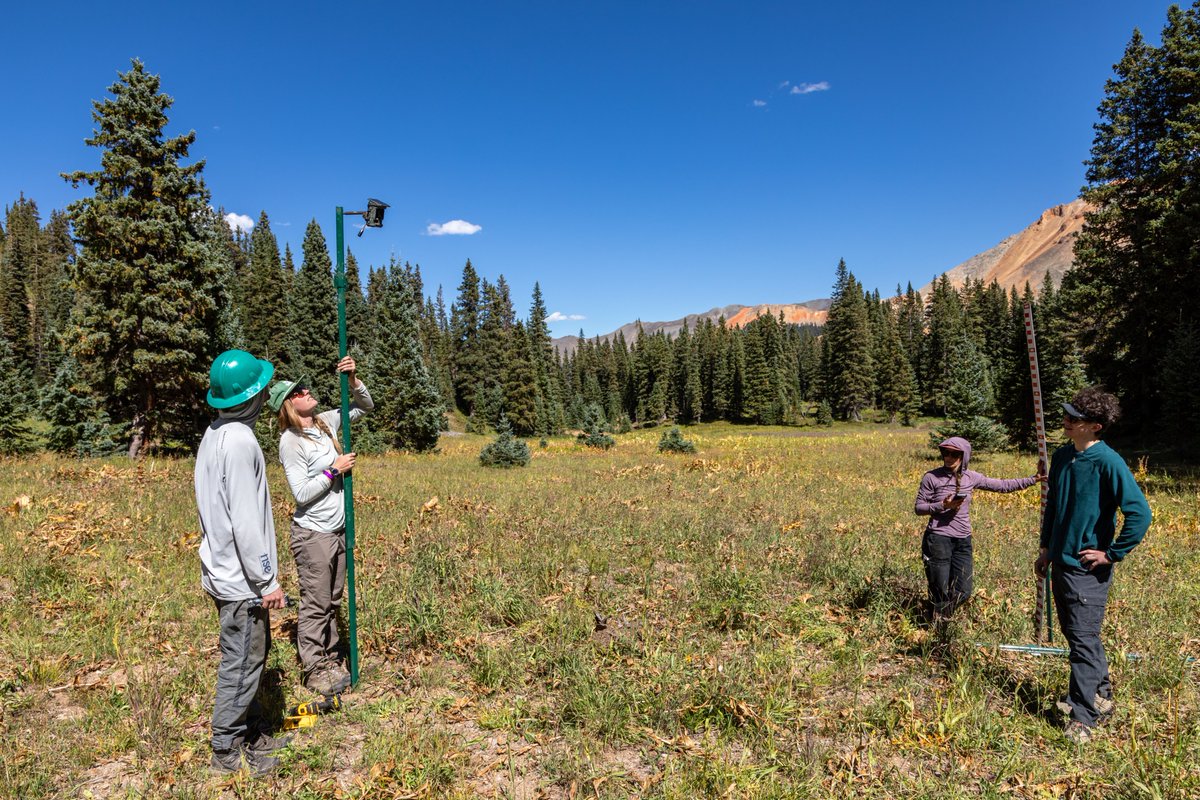
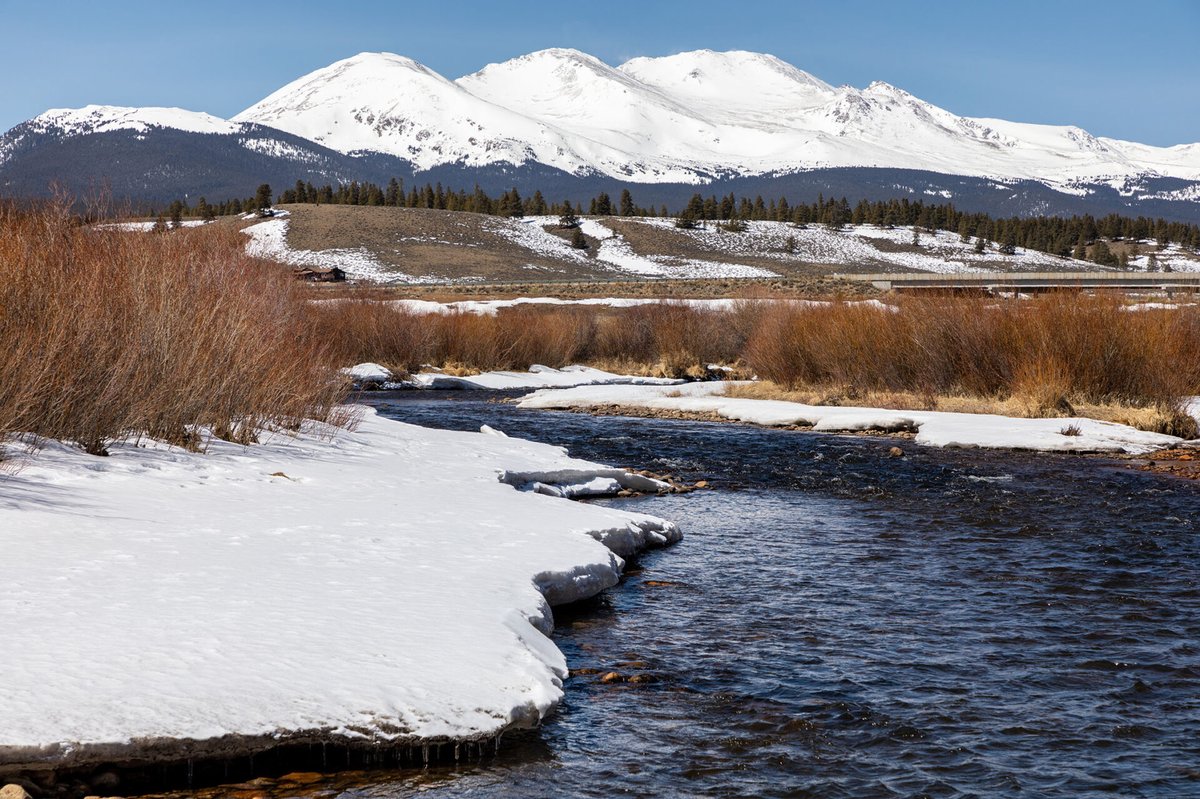
ALT The Arkansas River and Sawatch Range near Leadville, Colorado, in March 2021. Photo by Mitch Tobin/The Water Desk.
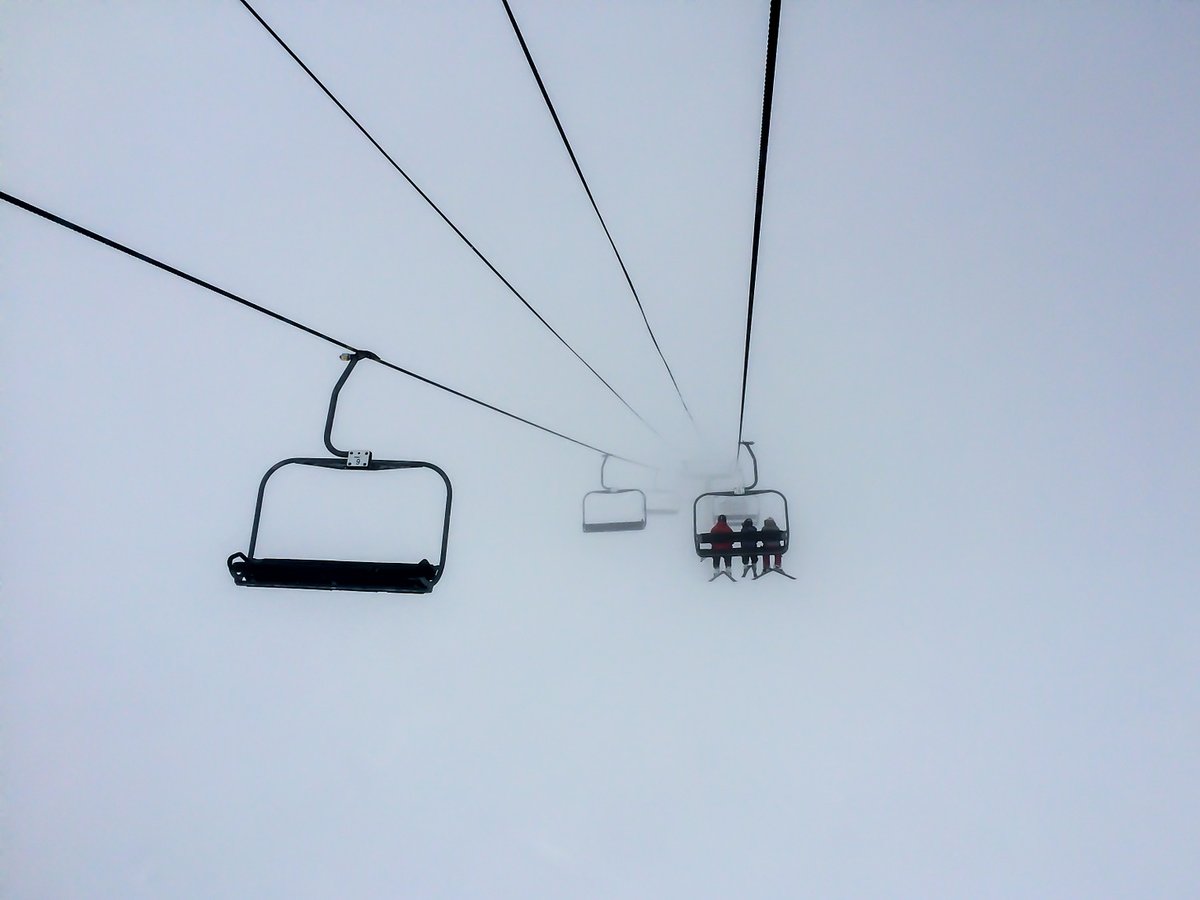
Snow water resources and water security are threatened by climate change. Check out this article by @TheWaterDesk, which summarizes and contextualizes the present-day and future climate impacts on Western US water from our Water Chapter in #NCA5.
waterdesk.org/2024/04/nation…
Compared to 2023, the current water year might seem underwhelming. Despite overall drier conditions compared to last year, several basins in the CBRFC area are either nearing or at normal SWE levels for this time of year. #utwx#cowx#drought
First 2023-24 Snow Drought Update
Snow drought is most prevalent in the N. Rockies, Sierra Nevada, and parts of the Lower CO and Rio Grande River Basins.
Storms have benefitted the Northwest and Great Basin, but warm snow drought is a concern.
drought.gov/drought-status-u…@NOAA
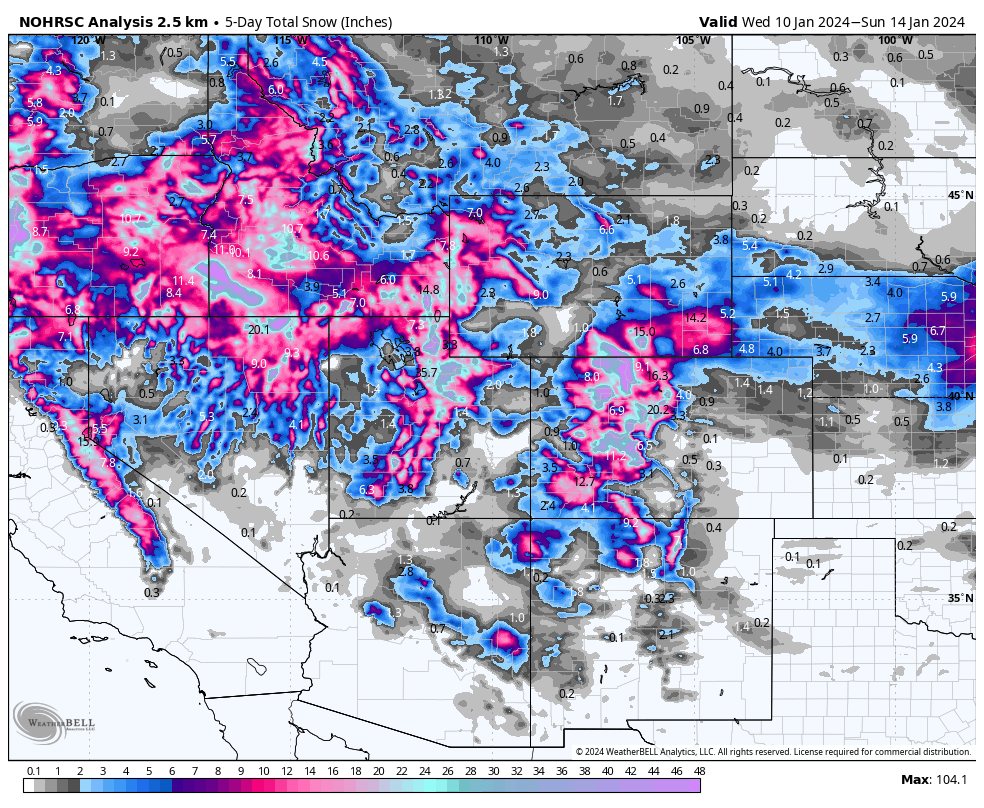
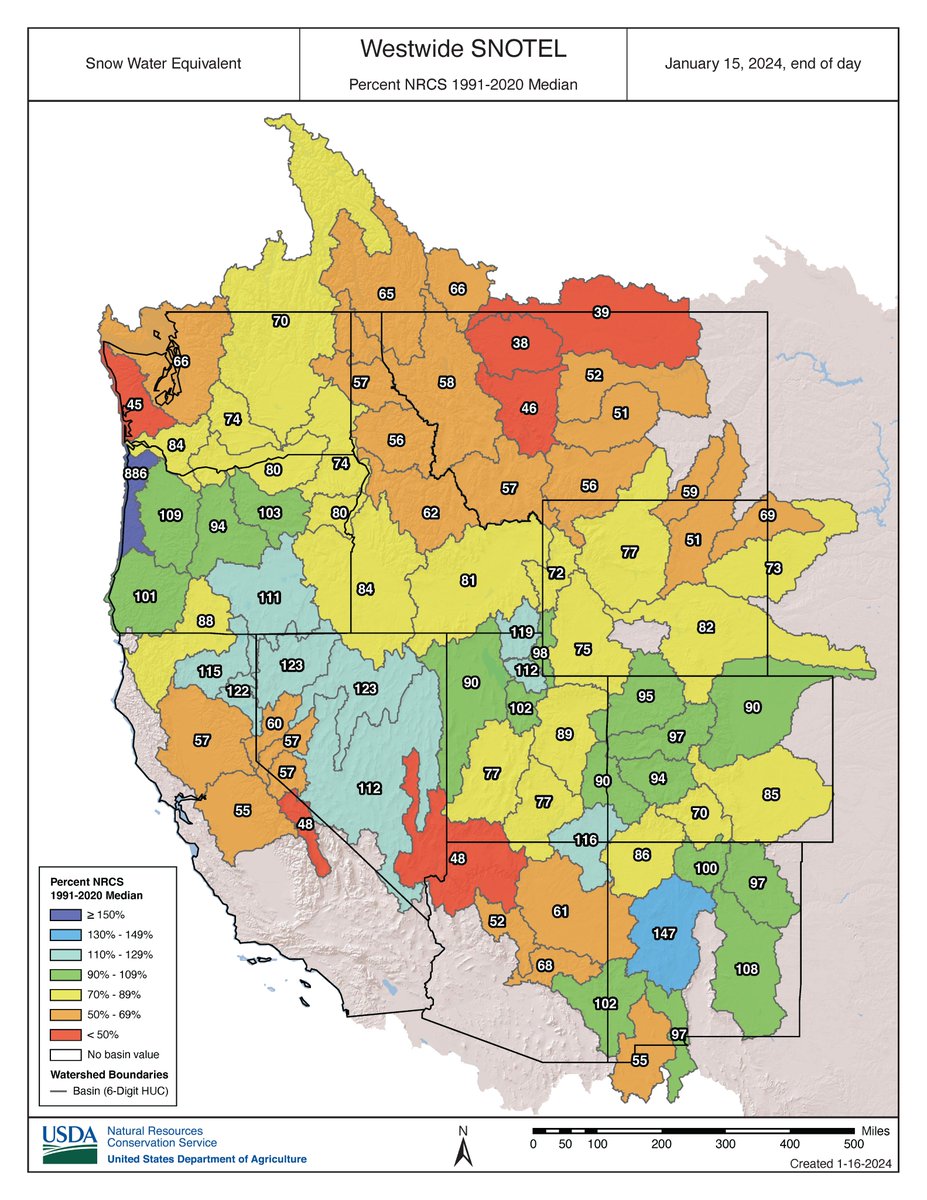
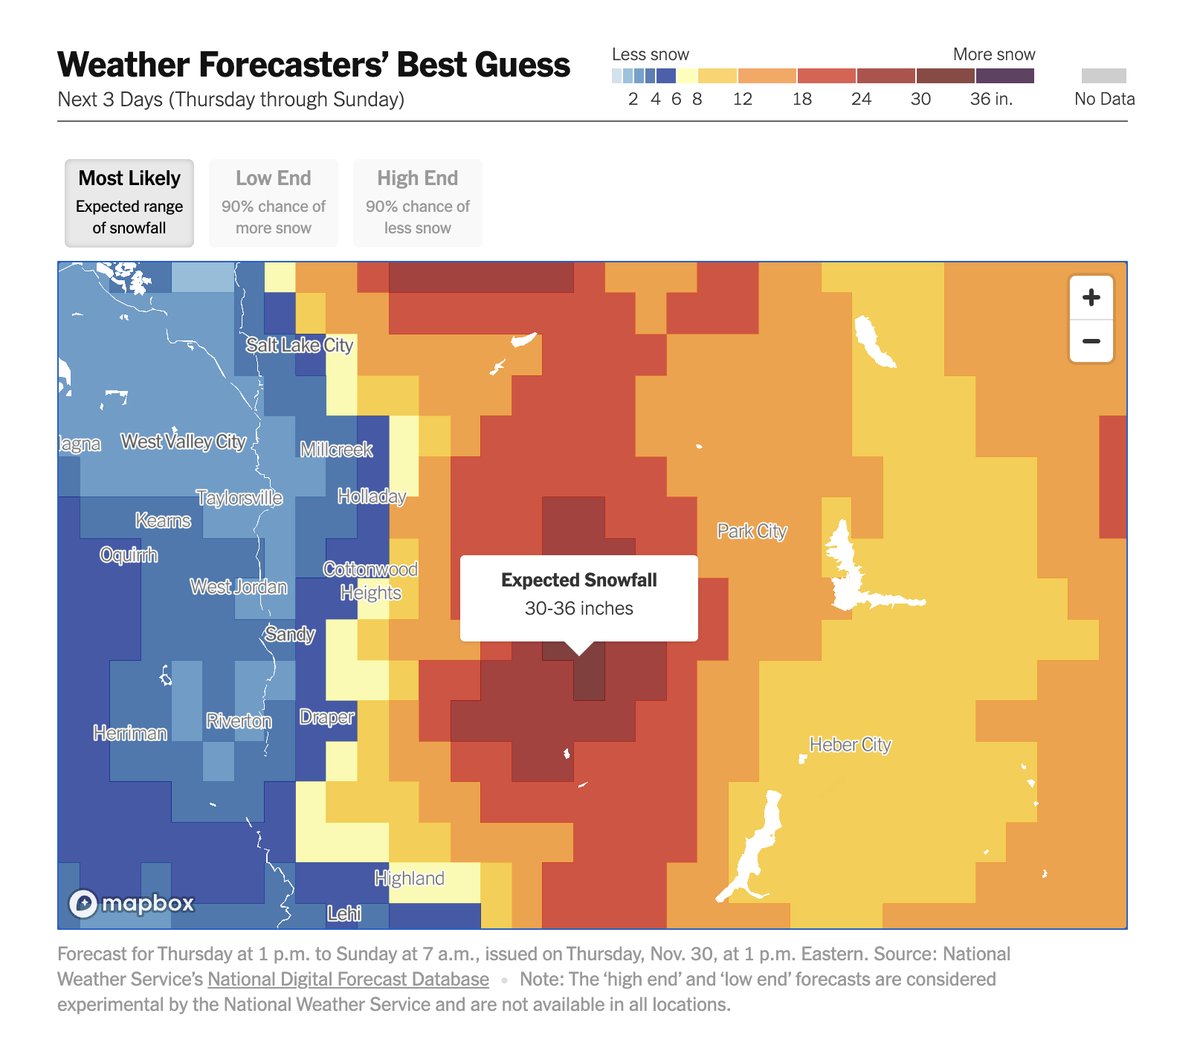
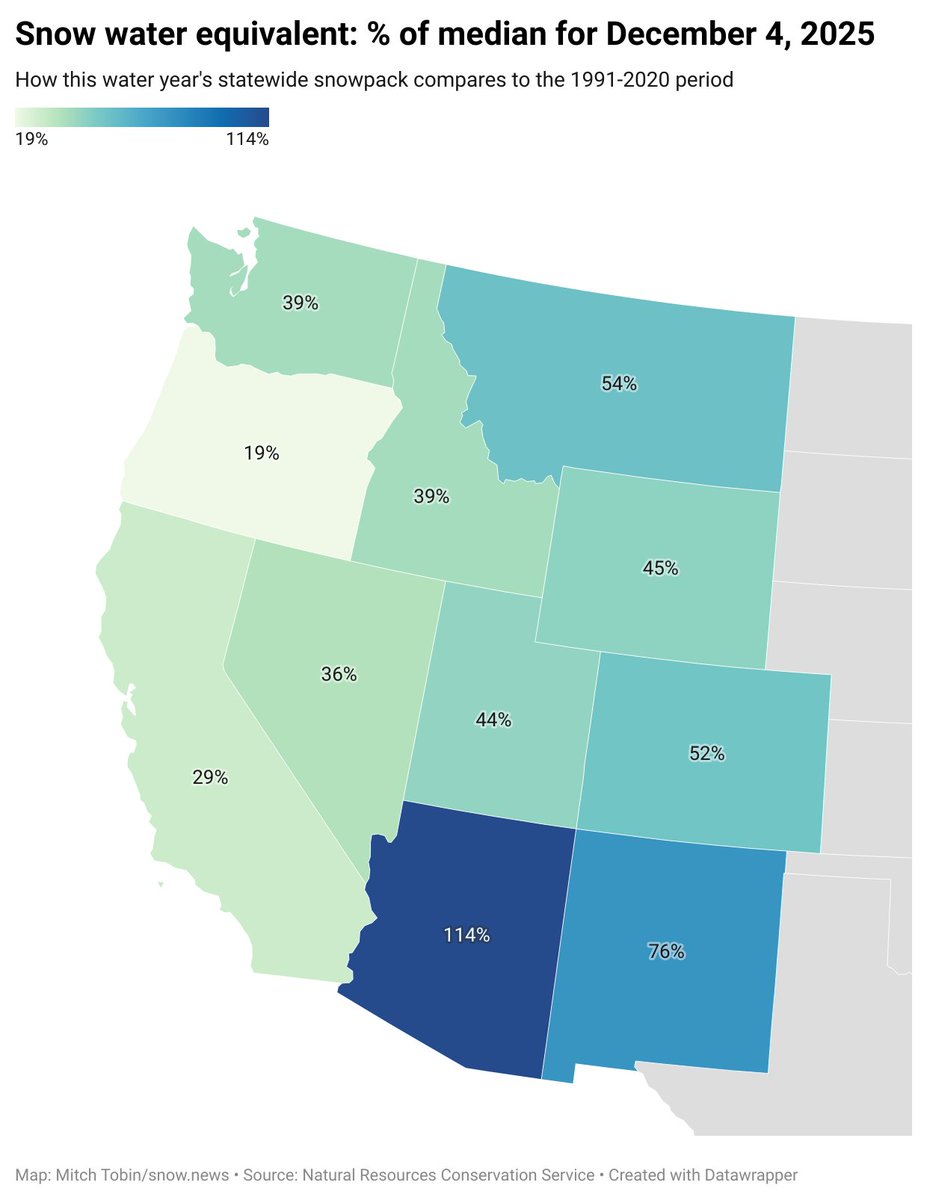
ALT Snow Telemetry (SNOTEL) snow water equivalent (SWE) values for watersheds in the western U.S. as a percentage of the 1991–2020 median recorded by the USDA Natural Resources Conservation Service.. Only stations with at least 20 years of data are included in the station averages. The SWE percentage of normal, in this figure and in the text, represents the current SWE at selected SNOTEL stations in or near the basin compared to the median value for those stations on the same date from 1991-2020. This map is valid as of December 3, 2023.
(1/2)
Let's talk snowpack! Our recent storm was very beneficial, and an example of why early season snowpack numbers (particularly % of Median) should be taken with a grain of salt.
This plot shows data for the CO Headwaters basin (encompasses Grand & Summit Counties). #COwx
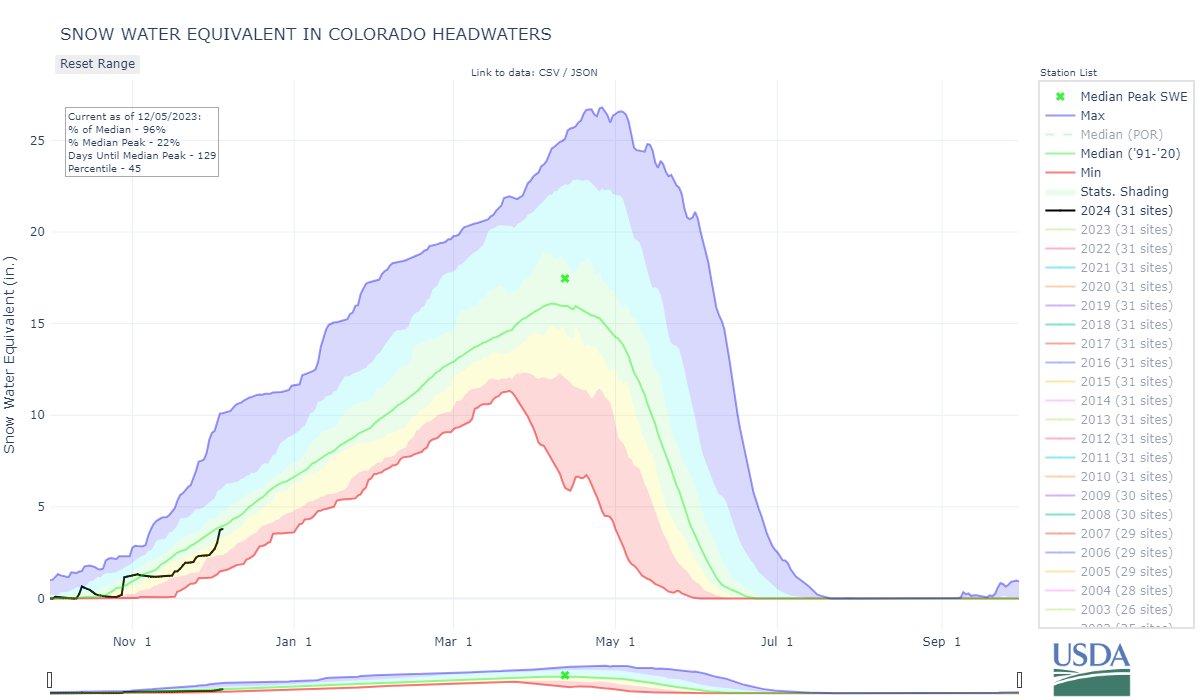
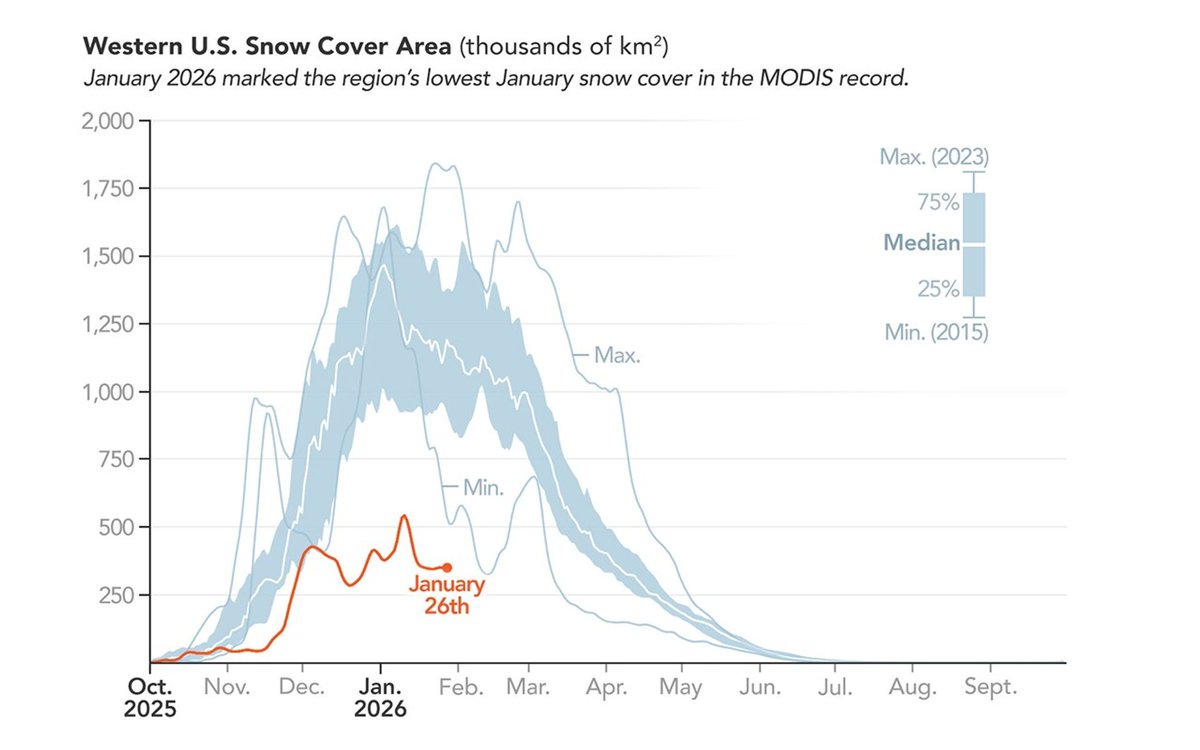
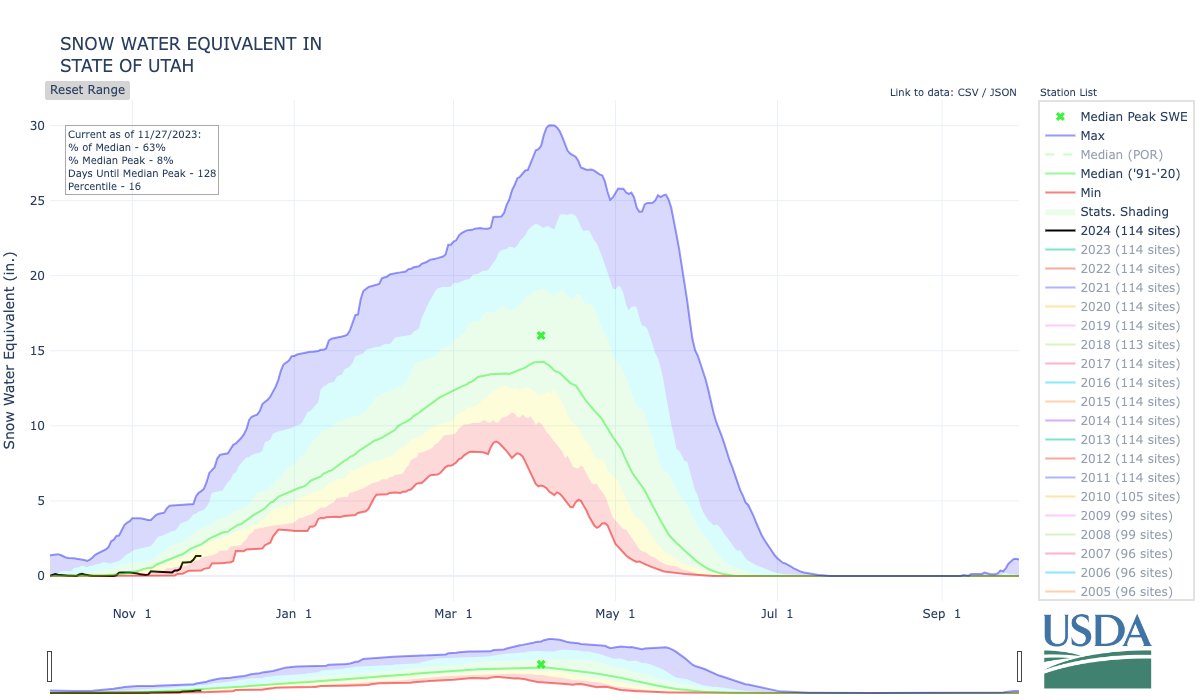
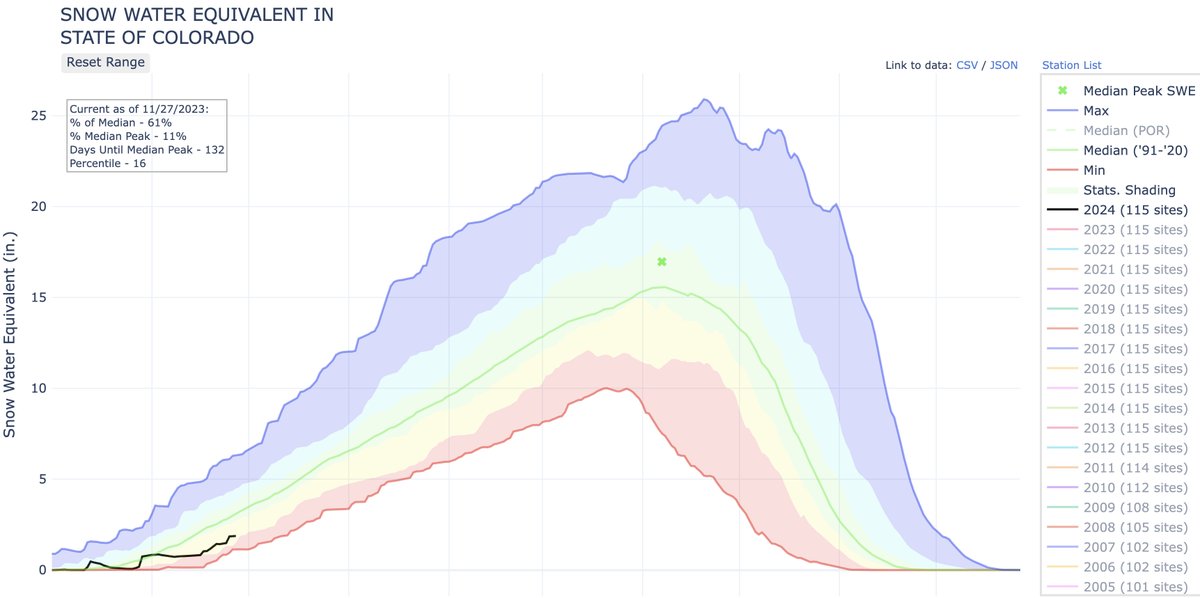
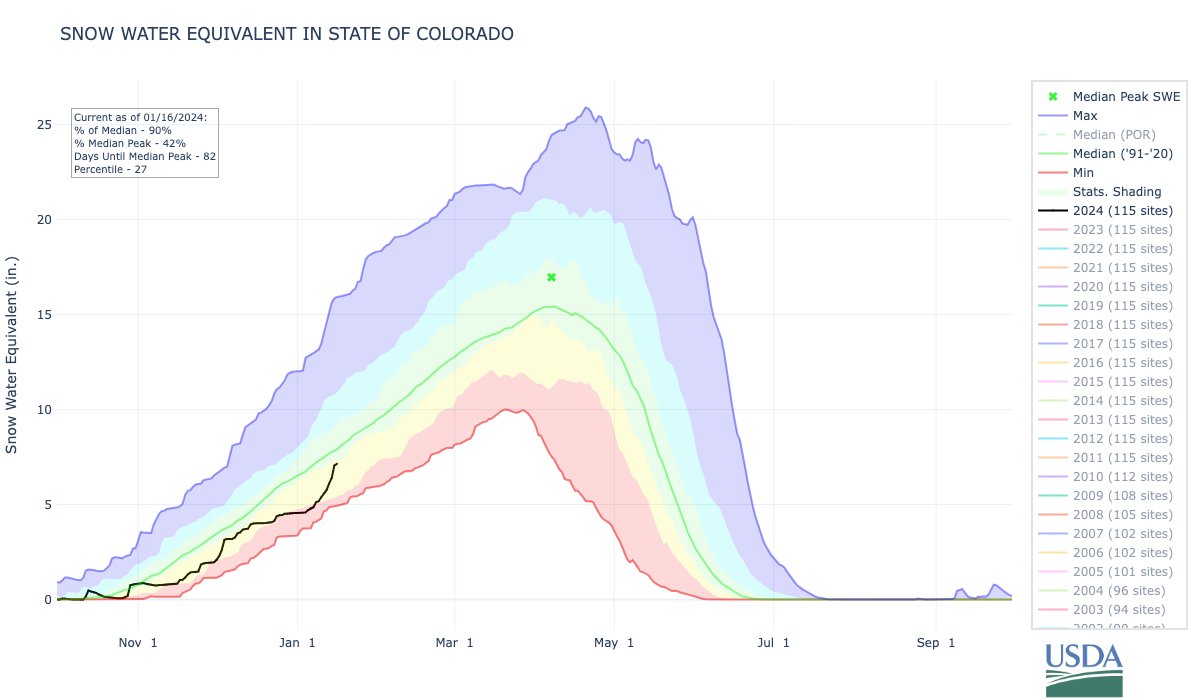
ALT Graph showing the change in Snow Water Equivalent, or snowpack, over time, overlayed with median and maximum/minimum values. The graph shows this season's trace approaching the median values for this date after our recent storm. The graph also shows the mean peak in SWE values, which occurs in mid to late April.