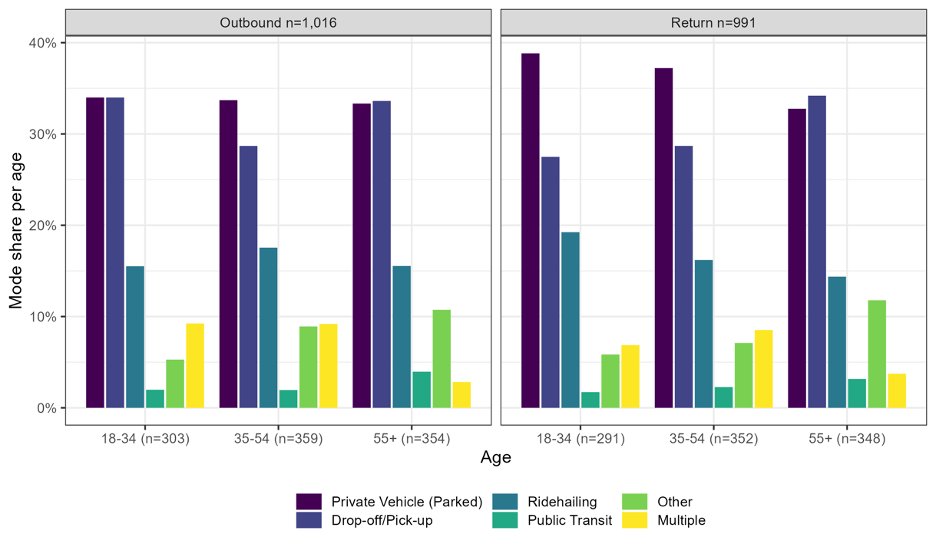
ALT Figure 2 from the report: bar plot that shows the distribution of transportation mode used to get to or come back from the airports, by different age groups.
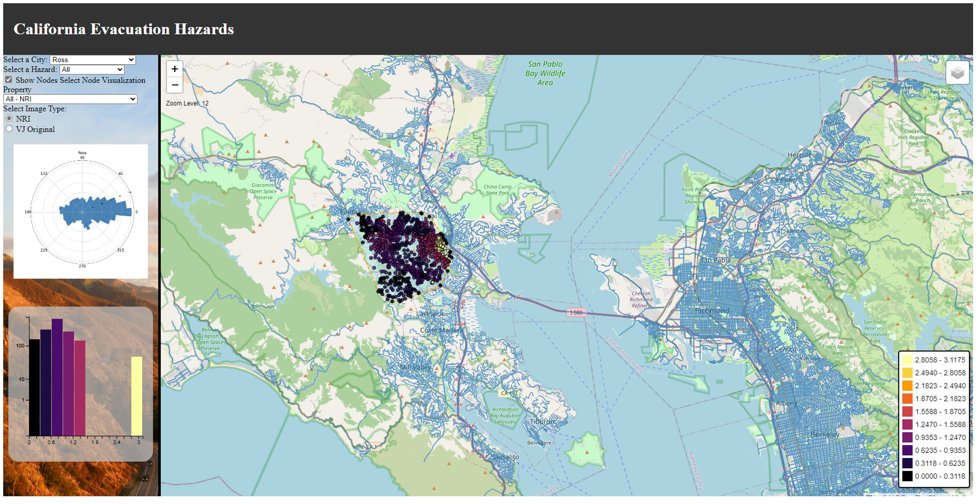
ALT Figure 8 from the report: This figure displays the dashboard for California Evaluation Hazards. The dashboard includes the selection of a city, hazard, property. Ross is selected as the city, and a color-coded bar graph with the hazards.
Check out this feature in @NASEMTRB's TR News delving into the meaningful projects that @USDOT UTCs are engaged in, including @NCST_Research's research into a carshare program providing sustainable mobility to rural communities in the Central Valley.
nap.nationalacademies.org/re…
Join us for our upcoming webinar 1/30 @ 10AM PST! Dr. Huiying ("Fizzy") Fan will present modeling techniques and high-performance computing to assess impacts of extreme #weather on vulnerable communities. Register here: ncst.ucdavis.edu/events/usin…@gatechengineers
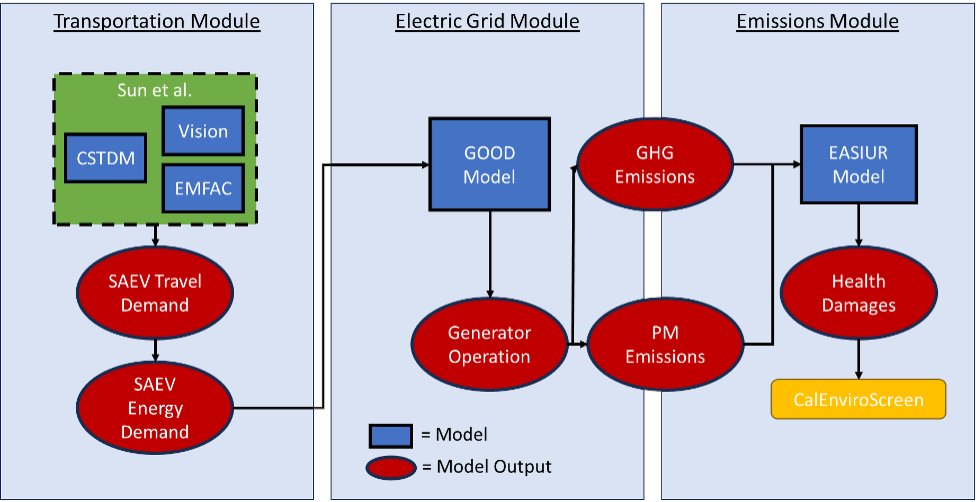
ALT Figure 1 from the report: Model flow diagram describing the various model components, inputs, and outputs of the entire modeling system and approach taken in this study.
New report from @ITS_UCDavis! #California and the US are working toward net-zero greenhouse gas #emissions for cement and concrete industries. Researchers investigated the role of carbon dioxide removal as a mechanism to achieve these goals. Read here: ncst.ucdavis.edu/research-pr…
ALT Figure 1 from the report. This figure shows a diagram for concrete end-of life: it "begins" with Use Phase and travels to processes "Crushed Concrete After Demolition," "Landfilling," "Carbonation of Crushed Concrete," "Recycled as Aggregate," which then goes back to Use Phase.
What's the toughest #bike trip you've had to take? Cycling-specific impedance functions can measure that difficulty, which can be useful for planners to prioritize bike #infrastructure. If you're interested, don't forget to register for our 11/21 webinar! ncst.ucdavis.edu/events/webi…
Our new Student Spotlight features Meg Fay, a @uvmvermont Civil & Environmental Engineering master's student! They discuss the #emissions and #equity impacts of the electric vehicle transition, their role as a researcher, and advice for undergrad students: ncst.ucdavis.edu/news/uvms-m…
In case you missed it! Researchers examined @RideSacRT's SmaRT Ride #microtransit program and the drivers of microtransit adoption. Their results suggest #policy solutions that support microtransit and benefit transport-disadvantaged groups. Read more: ncst.ucdavis.edu/research-pr…
ALT Photo credit: SacRT. Photo of Sacramento Regional Transit's SmaRT Ride on-demand transit vehicle, colored blue with a yellow stripe. The vehicle is in front of a building complex.
New report from @USC! In their research, Drs. Petros Ioannou and Zheyu Wang present a coordinated #freight routing system designed to optimize network utility and reduce #traffic congestion through incentives and personalized routing guidance: ncst.ucdavis.edu/research-pr…@METRANS_
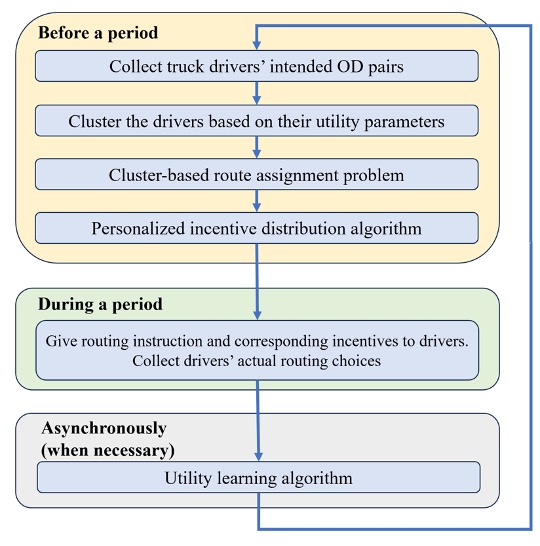
ALT Figure 1 in the report. The figure illustrates the high=level structure of the proposed system, with colored boxes indicating the flow "Before a period" to "During a period" to "Asynchronously (when necessary)".
What's the toughest #bike trip you've had to take? Cycling-specific impedance functions can measure that difficulty, which can be useful for planners to prioritize bike #infrastructure. If you're interested, don't forget to register for our 11/21 webinar! ncst.ucdavis.edu/events/webi…
How hard is it to #travel somewhere - that's what impedance functions measure! Sign up for our 11/21 webinar to learn about Reid Passmore's (@reid_passmore) research on #cycling impedance functions, which can be used to prioritize cycling infrastructure: ncst.ucdavis.edu/events/webi…
ALT Photo of a bike lane. On the left is grass; on the right are a sidewalk, racks, and street lamps; above are tree leaves.
ALT Photo credit: SacRT. Photo of Sacramento Regional Transit's SmaRT Ride on-demand transit vehicle, colored blue with a yellow stripe. The vehicle is in front of a building complex.
In a new addition to our mini lecture series, @alanjenn of UC Davis explains how the #grid will handle increased electric vehicle load, what that means for vehicle owners and ratepayers, and how clean #EVs actually are. Find the full series here! ncst.ucdavis.edu/video-lectu…
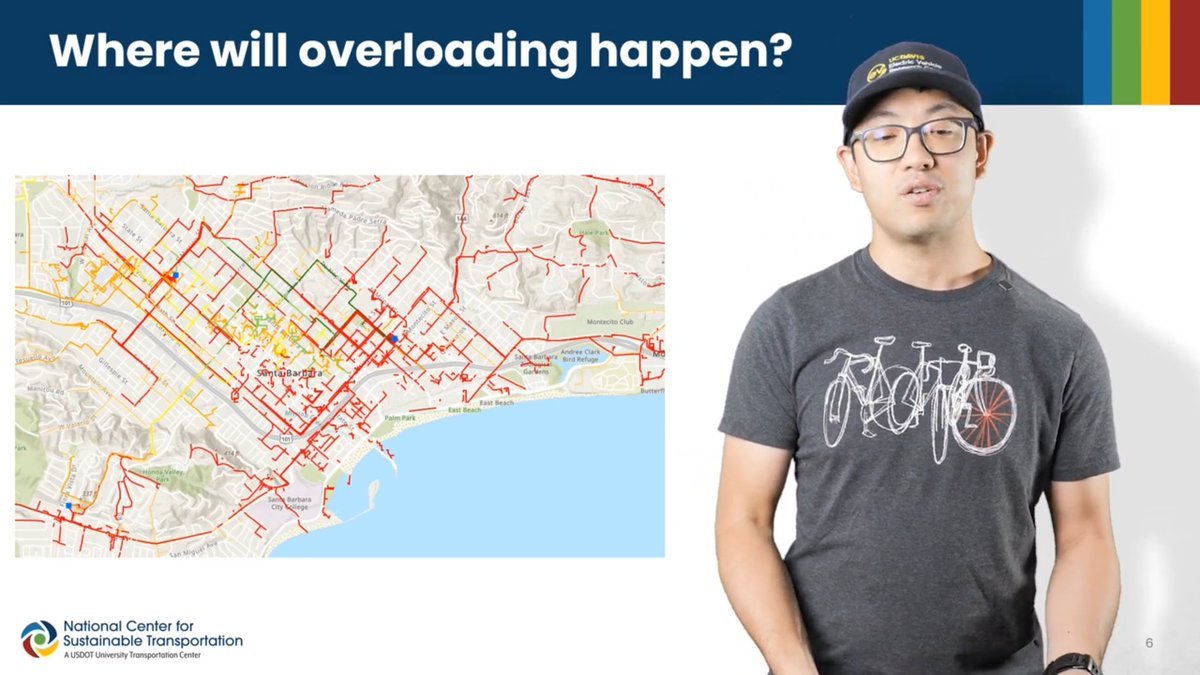
ALT Screenshot of the mini lecture video. Dr. Alan Jenn is shown in front of a slide titled "Where will overloading happen?" with an image of grid capacity in Santa Barbara, CA.
Our November 21st webinar is coming up! @CEEatGT Georgia Tech Ph.D. candidate Reid Passmore will be sharing his dissertation #research on #cycling-specific impedance functions. Don't forget to register here: ncst.ucdavis.edu/events/webi…
How hard is it to #travel somewhere - that's what impedance functions measure! Sign up for our 11/21 webinar to learn about Reid Passmore's (@reid_passmore) research on #cycling impedance functions, which can be used to prioritize cycling infrastructure: ncst.ucdavis.edu/events/webi…
ALT Photo of a bike lane. On the left is grass; on the right are a sidewalk, racks, and street lamps; above are tree leaves.
Charging electric vehicles can be costly to fleet managers and stressful to the grid. @gatechengineers researchers developed a smart charging algorithm that can reduce electricity bills, defer infrastructure upgrades, and increase #EV adoption. Read here: ncst.ucdavis.edu/research-pr…
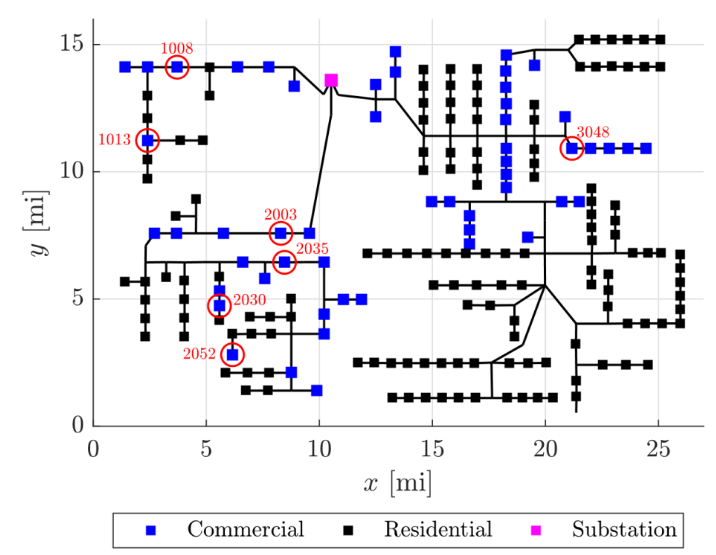
ALT Figure 2 from the linked report. This image shows a schematic of the distribution feeder model from “A Time-Series Distribution Test System Based on Real Utility Data" by Bu et al. Squares indicate distribution transformers and loads; each load is connected to a dedicated transformer. Locations selected for fleet placement are circled.