
Joined June 2018
- Tweets 465
- Following 158
- Followers 594
- Likes 187
117 Photos and videos


Climate FieldView Nebraska retweeted

Feb 15
In this episode of Around the Farm, Bayer’s R&D leaders talk about what’s moving through the pipeline, from products nearing deployment to what’s being built for 2030 and beyond. It’s not just one “blockbuster.” It’s a system of innovations designed to create value for growers season after season. spr.ly/6019hr55S
1
1
1,356

14 Nov 2025
Just spotted this on Climate.com 👀
You can now create zones and scripts from any historical yield map. And just in time for fall fertility. @FieldView
How-to 👉 support.climate.com/kt#/kA0V…
*Disregard the AI generated deer solely used to stop scrolling
74
Climate FieldView Nebraska retweeted
2 Oct 2025
Ready for some deeper insights? 📊 Create a Field Region report to review data like yield, hybrid, soil type and more. Draw custom regions, analyze specific fields, and see how you can improve next season ⬇️ spr.ly/6015Aiw1h

2
782
Climate FieldView Nebraska retweeted

16 Sep 2025
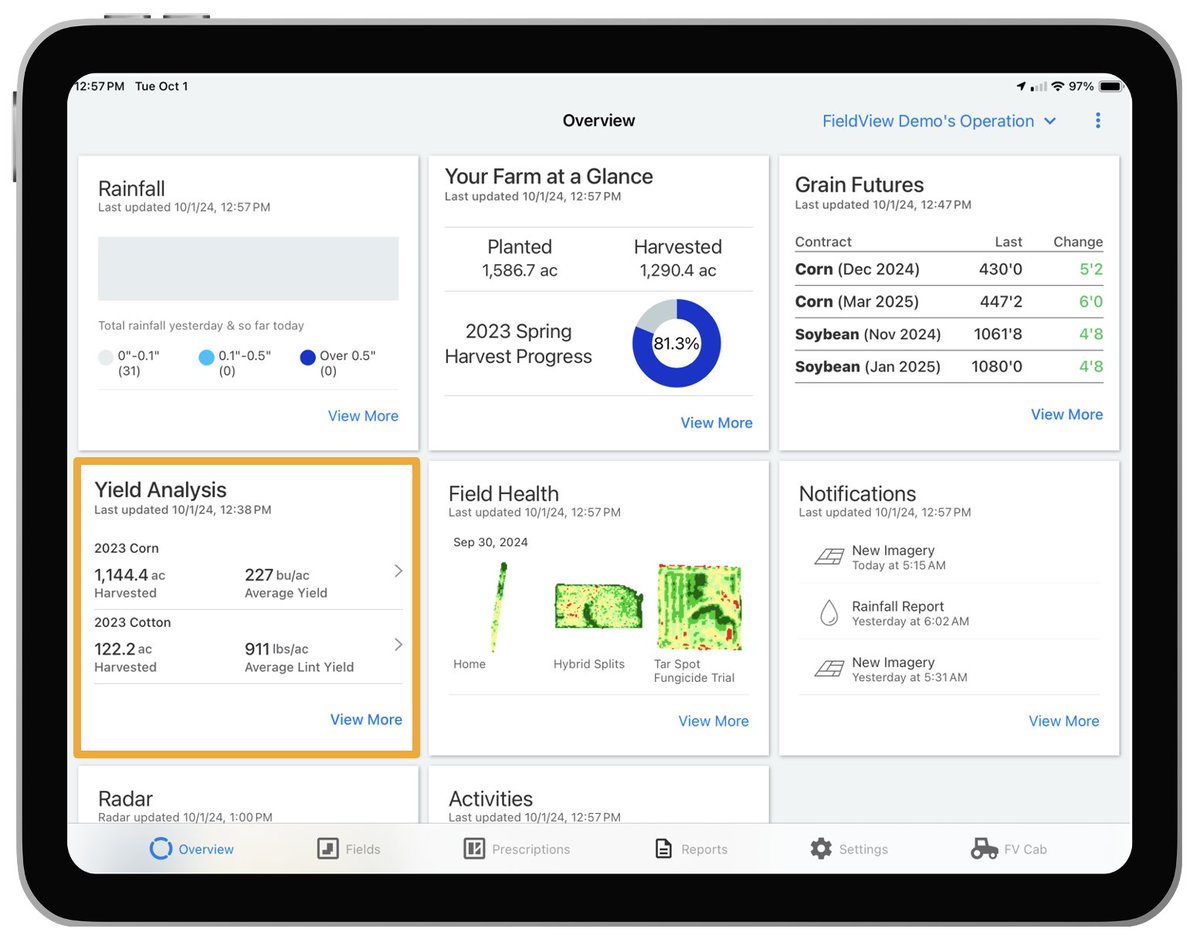
Yield Analysis Annotated Diagrams⬇️⬇️
View the key areas of Yield Analysis using these annotated diagrams. Yield analysis by operation, field or hybrid.
support.climate.com/kt#/kA02…

2
2
410
9 Sep 2025
You can find us in the Bayer tent this week at Husker Harvest Days. Come by with any questions you might have!
1
114
Climate FieldView Nebraska retweeted
5 Sep 2025
10 years. 🚜 Countless acres. Every step guided by your data and decisions.
Let’s celebrate a decade of growing together.
#FieldView10 #AgTech #FarmingInnovation
1
1
733
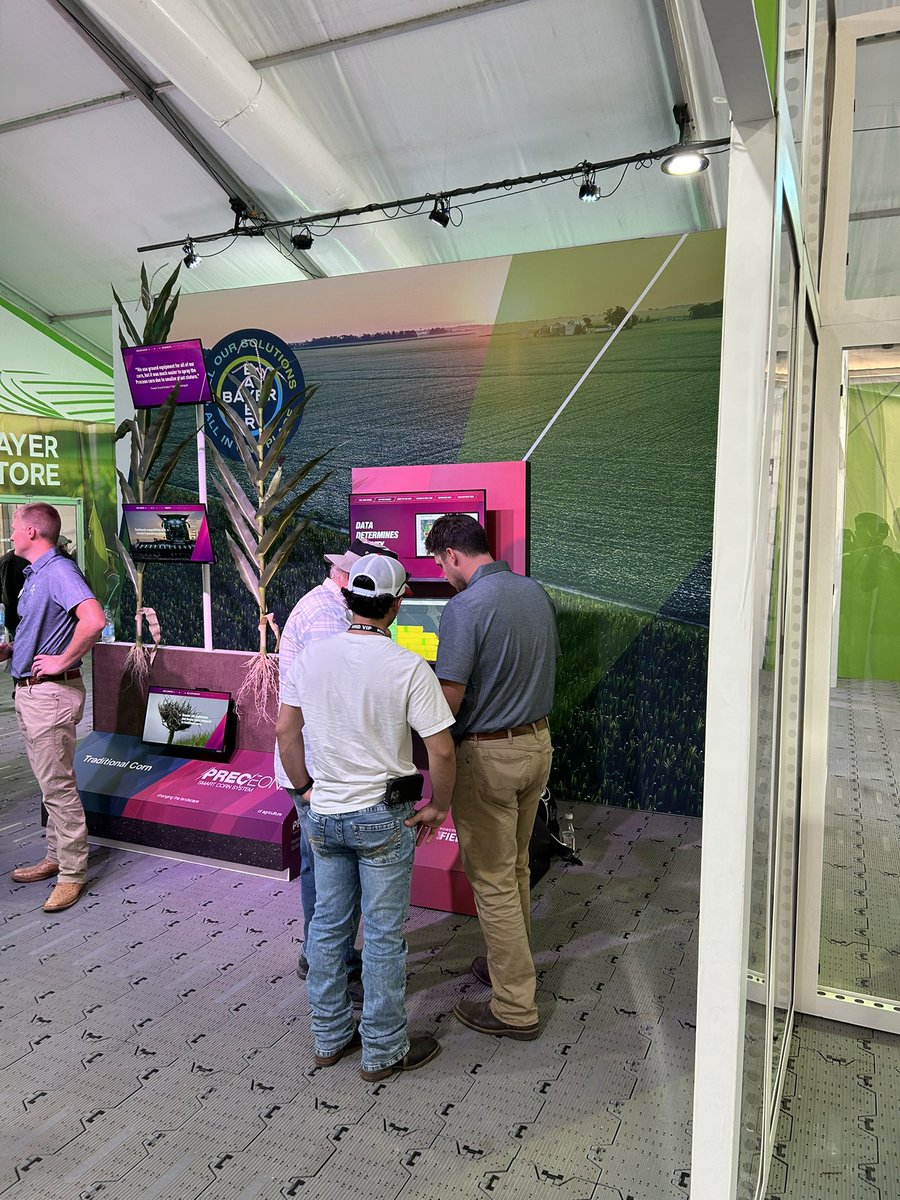
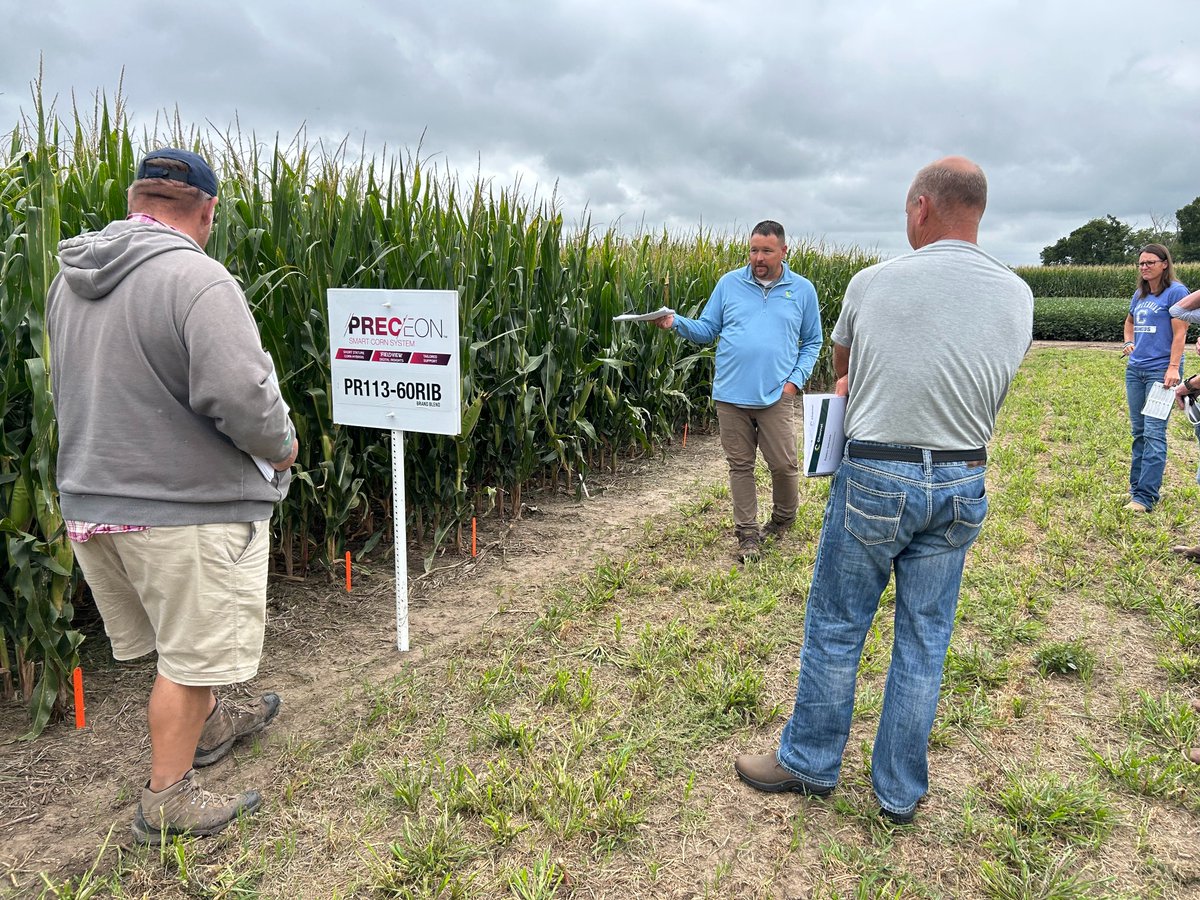
4 Sep 2025
Out in the field this week and last with our @Channel_NE & @DKAS_Nebraska teams talking about the future of farming 🌽💪 Exciting to see how Preceon® corn, along with Fieldview, is delivering next-level performance, insights, and opportunities for growers.

1
4
163
Climate FieldView Nebraska retweeted
25 Aug 2025
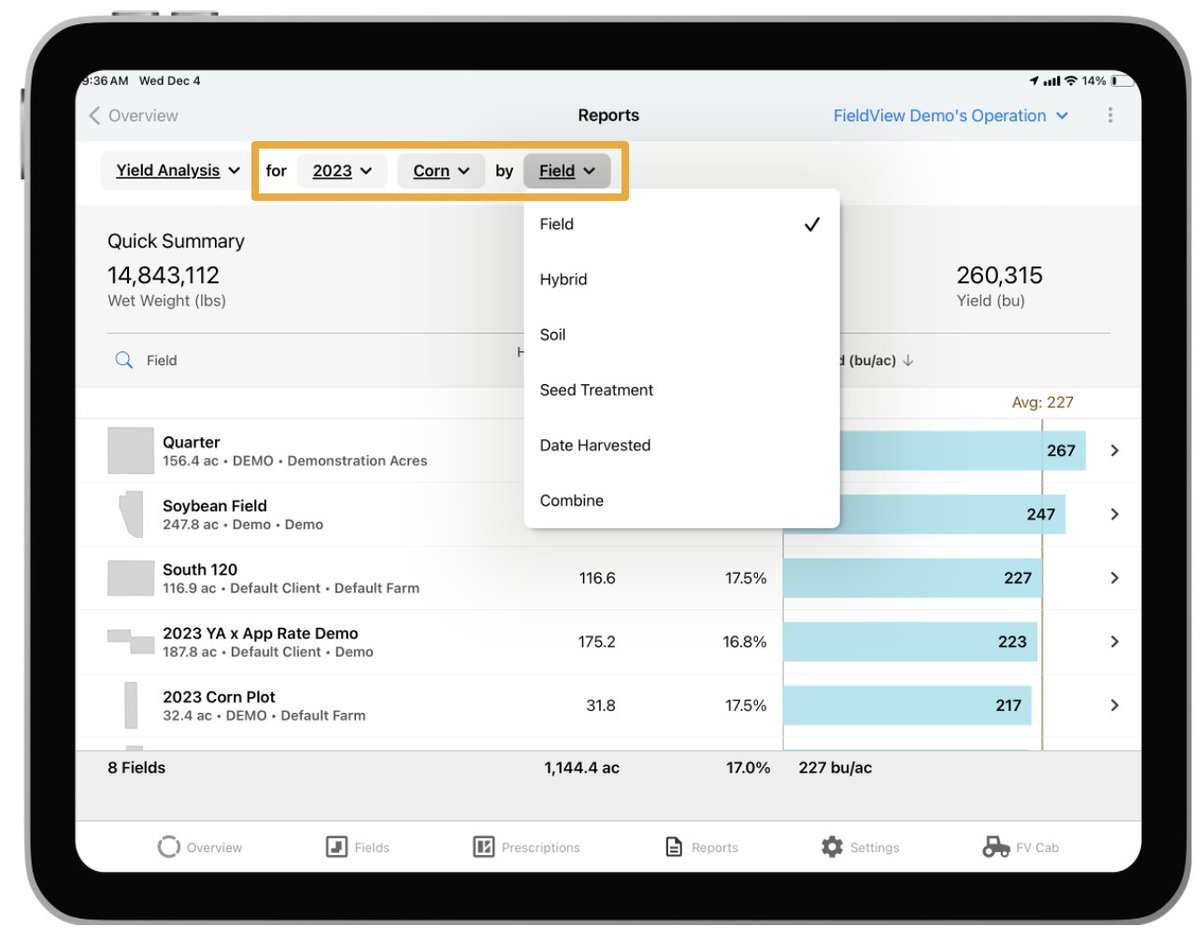
How To Create a Yield Analysis Report Using FieldView™
Enhance Your Productivity with In-Depth Seed and Field Performance Analysis. Turn the information you have into the answers you need.
support.climate.com/kt#/kA02…
2
2
337
Climate FieldView Nebraska retweeted
19 Aug 2025
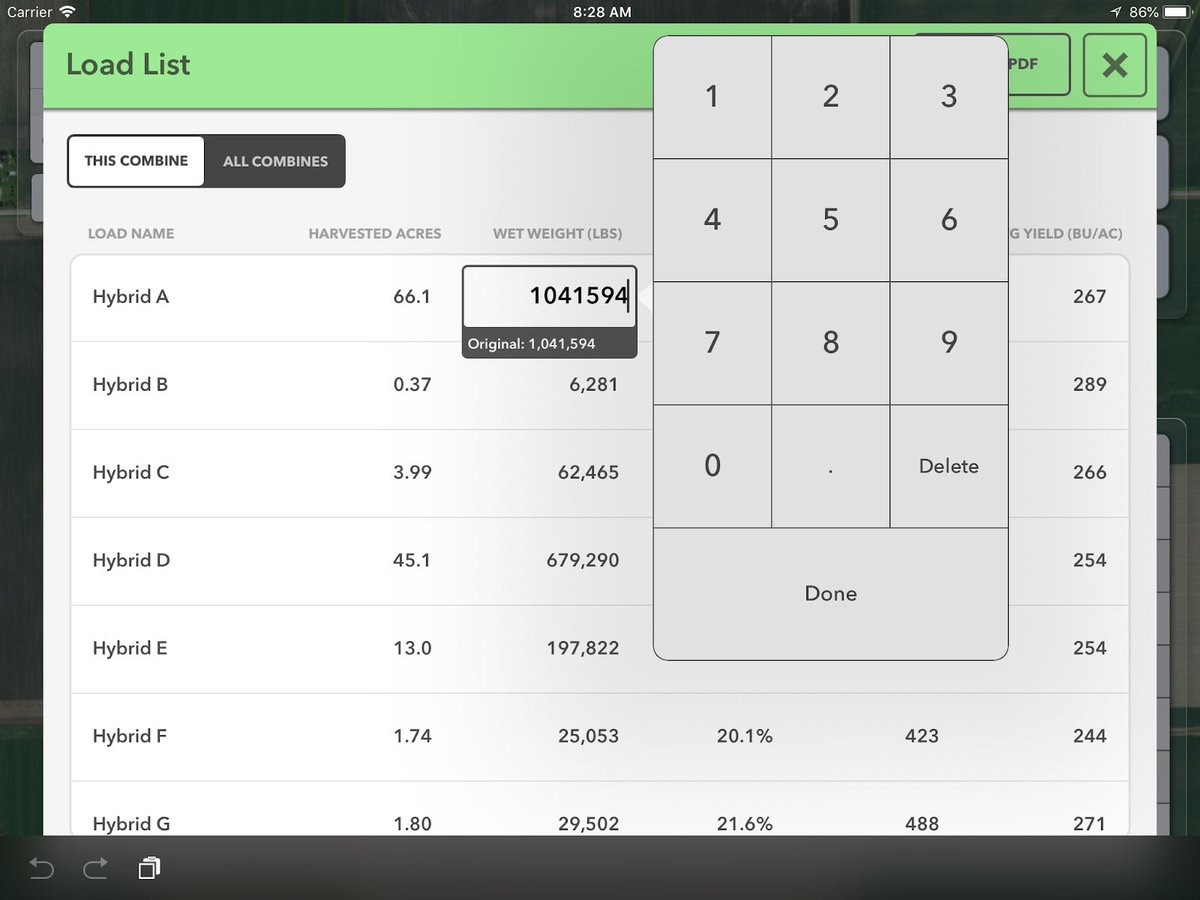
Edit Yield Data for Hybrid Plot Load List in the Climate FieldView™ Cab App
The Load List allows the operator to divide field data into separate sections allowing for quick identification and analysis of hybrid performance.
support.climate.com/kt#/Harv…

2
2
224
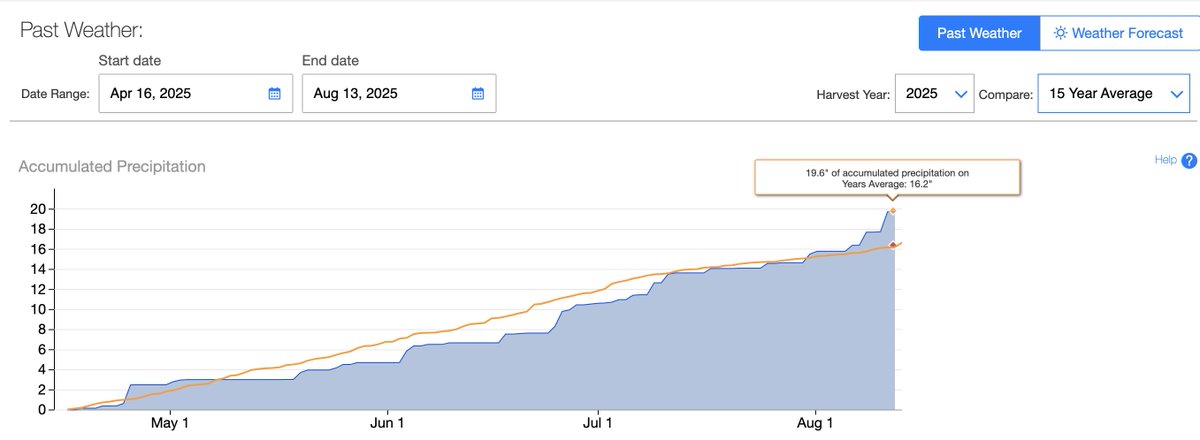
13 Aug 2025
🌧️ Papillion, NE has seen about 3.5" more rain than the 15 year average since April 16th! Check how the rain averages compare on your fields on climate.com. After clicking on a field scroll the left hand pane and find the weather tab.
1
102
Climate FieldView Nebraska retweeted
25 Jul 2025
Capturing Hybrids During Harvest for Yield Analysis
FieldView™ provides powerful analysis tools to understand the factors that impact yield across each field. This is realized by having both planting and harvest data in FieldView™ for each season.
support.climate.com/kt#/Harv…
1
171
Climate FieldView Nebraska retweeted
27 Jun 2025
Short corn, strong returns 🌽
Tom and Andy sit down with @PenneyPodcast hosts @seanblomgren & @CyPathology to talk Preceon, ROI & how tech like FieldView is moving the needle in the field.
➡️ Watch now: spr.ly/60194eKC3
#AroundTheFarm #Preceon #FieldView #AgTech
5
6
2,173
Climate FieldView Nebraska retweeted
1 Jul 2025
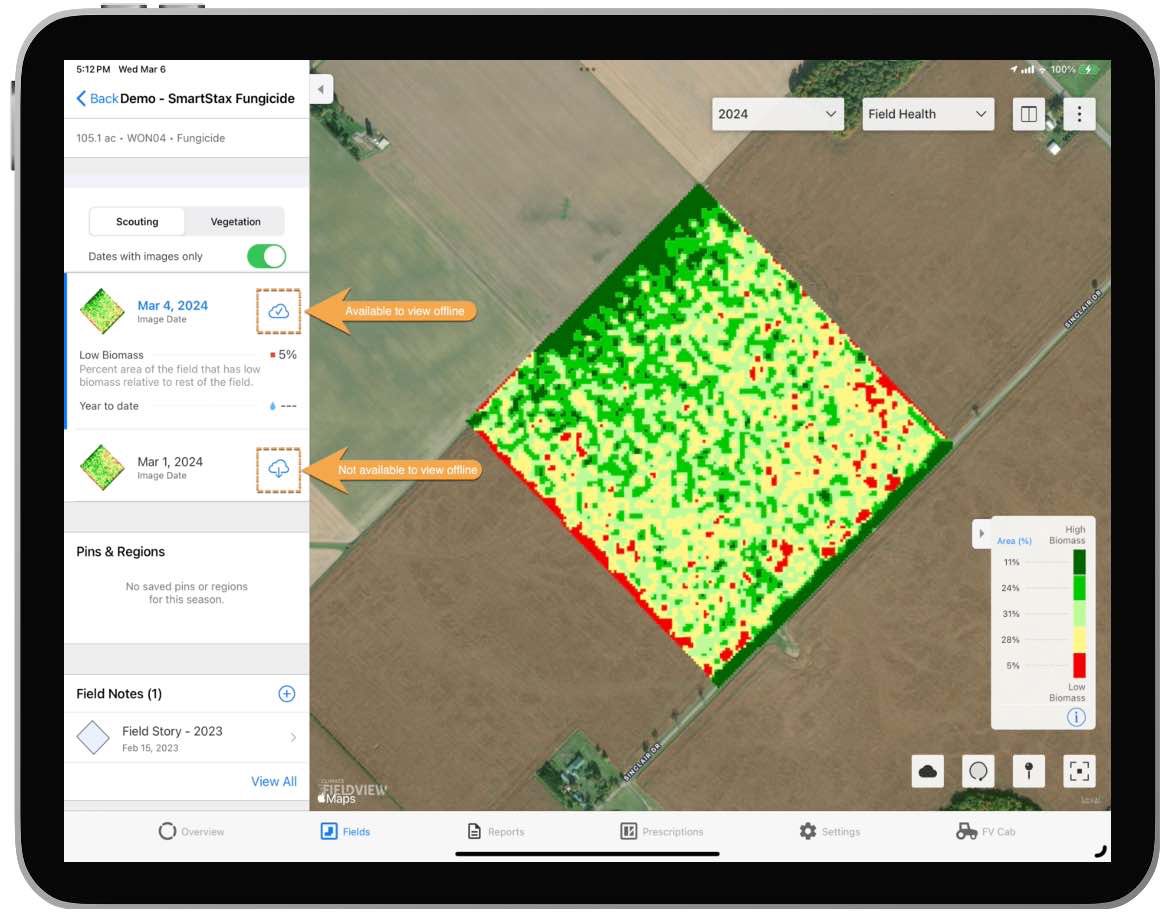
No connection. No problem! Take it with you offline! 🛜
Take your field maps to-go even without an internet connection using our new, downloadable Field Health Imagery and Color Maps.
support.climate.com/kt#/kA0V…
1
286
1 Jul 2025
Have a FieldView account and using sustainable practices but not in @ForGround_Bayer Carbon Program yet? That’s like buying Husker tickets and skipping the game. 🎟🌽 With a potential of up to $20 per acre, turn those practices into income! DM us to get connected with a local rep
1
1
121
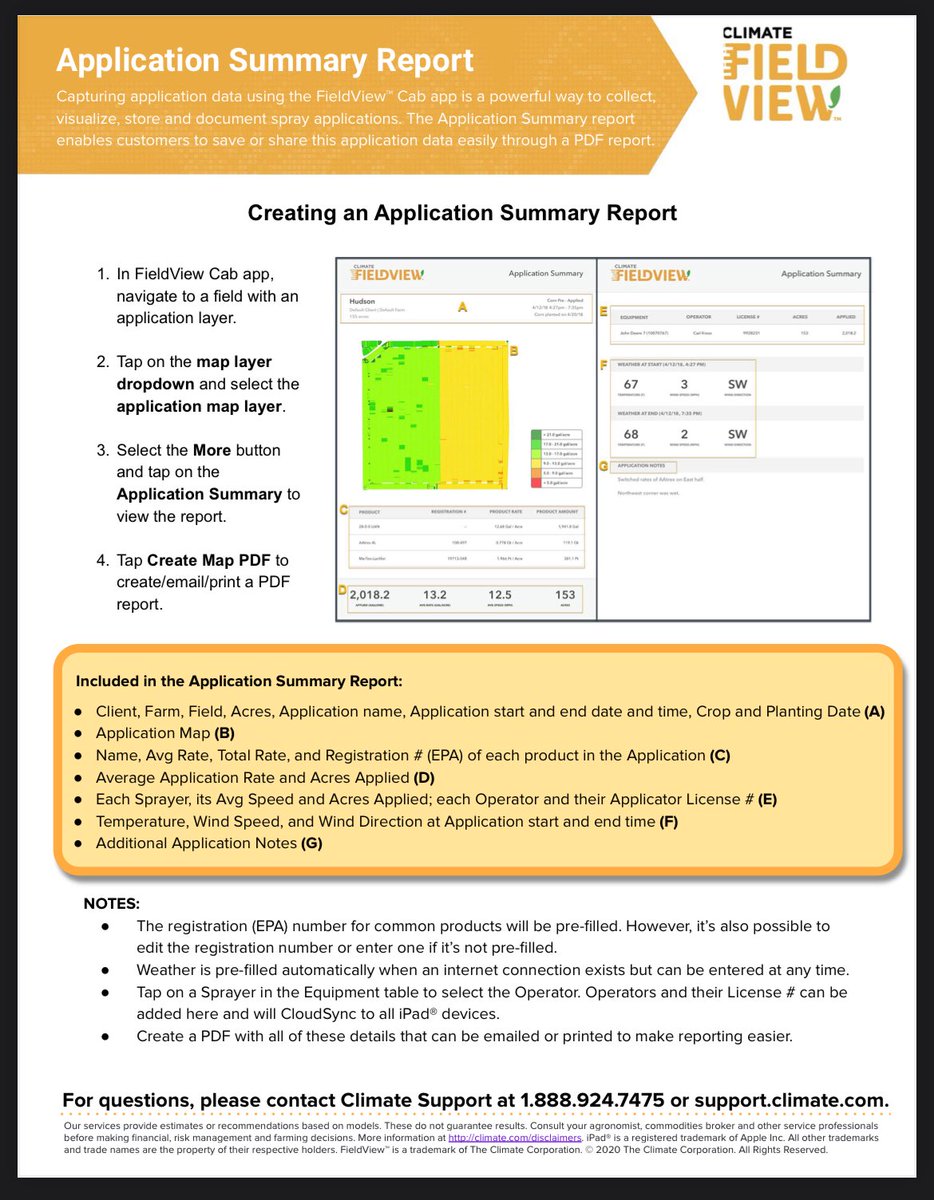
17 Jun 2025
🚜 Sprayed ✅
🌾 Fields done ✅
📊 Report ready ✅
With FieldView’s Application Summary Report, capture every pass — products, rates, weather & coverage — all in one clean PDF. Email it straight from the cab! 📱📩
#FieldView
3
4
1,920
9 Jun 2025
Your sprayer called. It wants a FieldView Drive 2.0 — and it’s tired of guessing where it already sprayed.
🌽 Upgrade now and get 10% off your Drive 2.0. Because nothing says “precision” like actually knowing where you’ve been.
#FieldView #NoMoreGuesswork
1
1
815
Climate FieldView Nebraska retweeted
21 May 2025
No more “what was this pin again?” 👀
#FieldView’s updated Scouting Pins now include color icon coding, so your map makes sense at a glance.
2
1
852
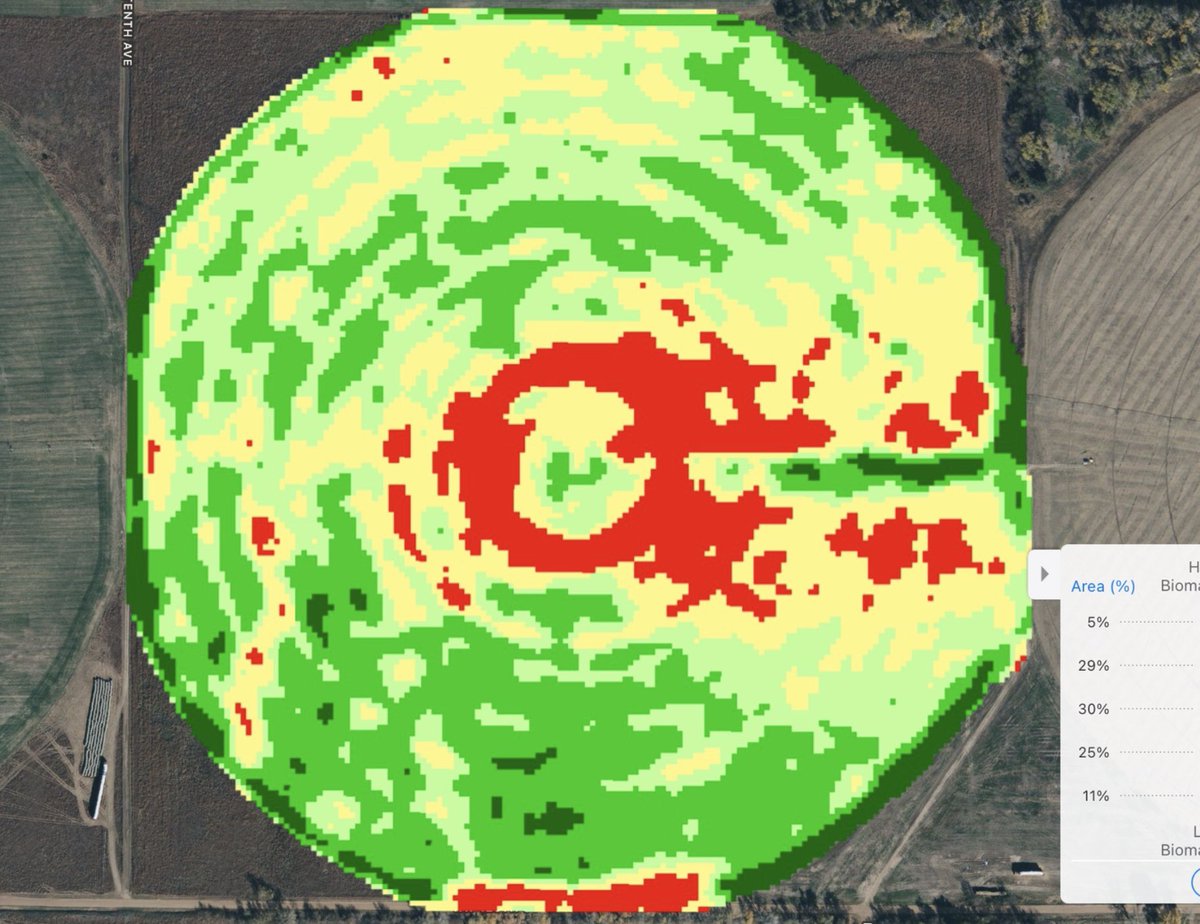
23 May 2025
That red ring? It’s a clogged nozzle. With crops emerging, Field Health Imagery in @FieldView helps you catch irrigation and other issues before they cost you yield. Scout smarter, act sooner. #FieldView #PrecisionAg
Learn more:
support.climate.com/kt#/kA02…
1
2
274
Climate FieldView Nebraska retweeted
12 May 2025
The most valuable thing you can inherit from a farm isn’t the soil. It’s the story behind it.
Watch how one family’s data became the next gen’s starting line → spr.ly/6017Nz5rT
#FieldView
1
702