
Check out the one link to rule them all...
Joined August 2022
- Tweets 60
- Following 144
- Followers 25
- Likes 197
23 Photos and videos


Pinned Tweet

1 Nov 2022
#midjourney simple prompt generator. The initial version is ready for some feedback. bit.ly/3DQ1XJm
#NoCode @Squirrel_365 #spreadsheets
4
26 Aug 2023
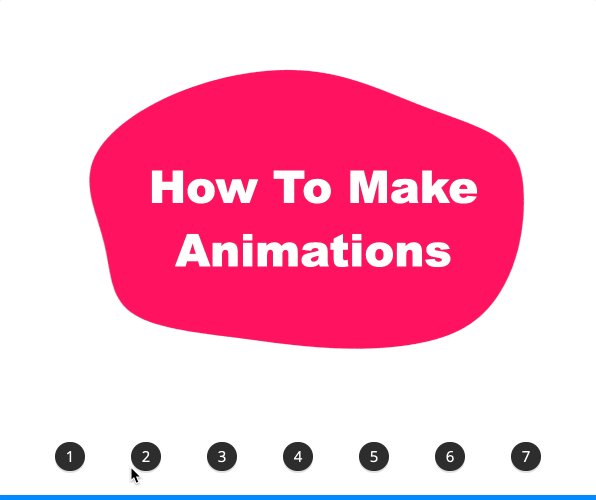
#nocode #animation overview with @Squirrel_365 using some simple #Excel #spreadsheet logic.
View it live: bit.ly/3OVfYKn
Source File: bit.ly/3Pf9XJZ
1
18
10 Aug 2023
I turned an #Excel recipe list into this #nocode mobile app with @Squirrel_365.
Check it out - bit.ly/3ORDWXZ
2
36
4 Aug 2023
If you are an #Excel or #spreadsheets power user, you need to check out @Squirrel_365. This #nocode tool is amazing. Working example: bit.ly/3qfNClE
This repeating table with dynamic colors was just point and click and my animation is driven by an If formula.
1
1
55
No Code Punk retweeted

15 Mar 2023
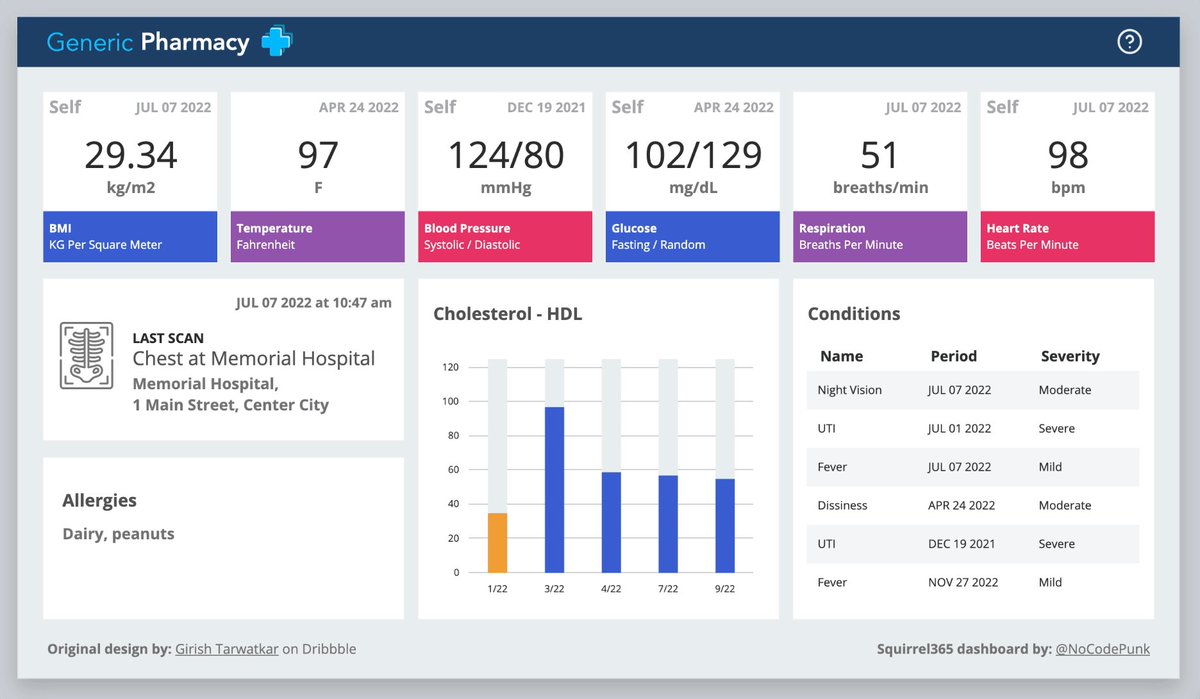
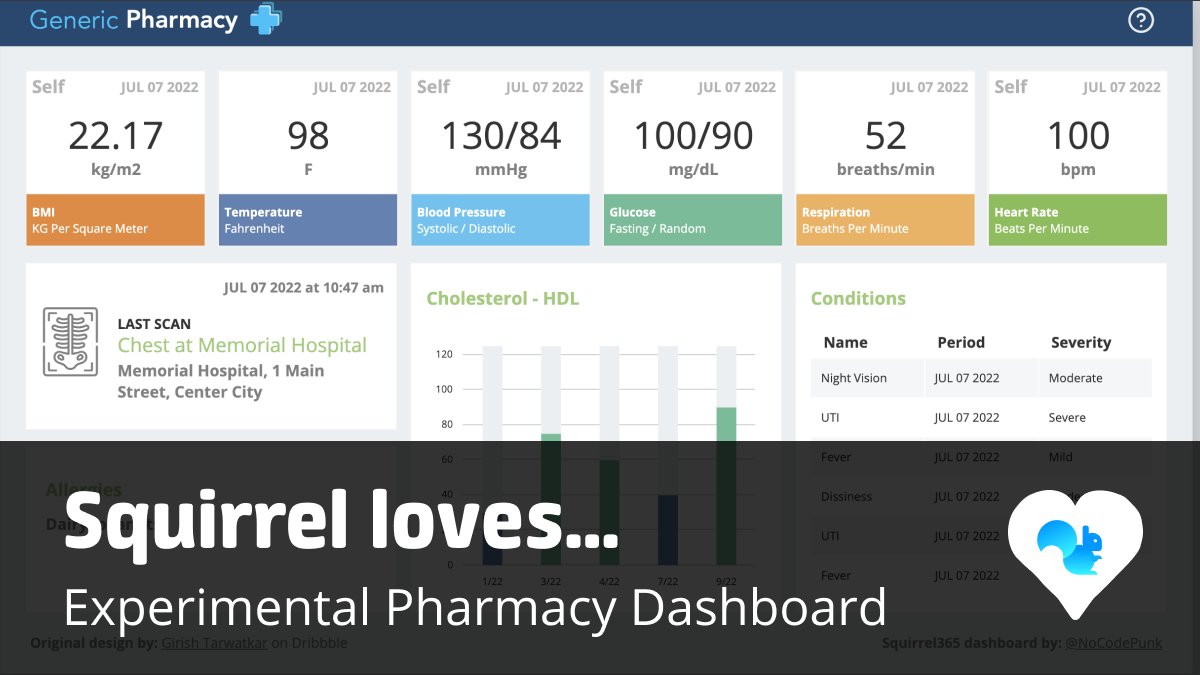
Check out this fantastic dashboard one of our community members built (inspired by a design on dribbble). It’s a great example of how you can dynamically swap out the colours and use add-ons to animate objects. bit.ly/3KSCz9S
#squirrel365community #dashboards #addons
1
7
684
No Code Punk retweeted
30 Jan 2023
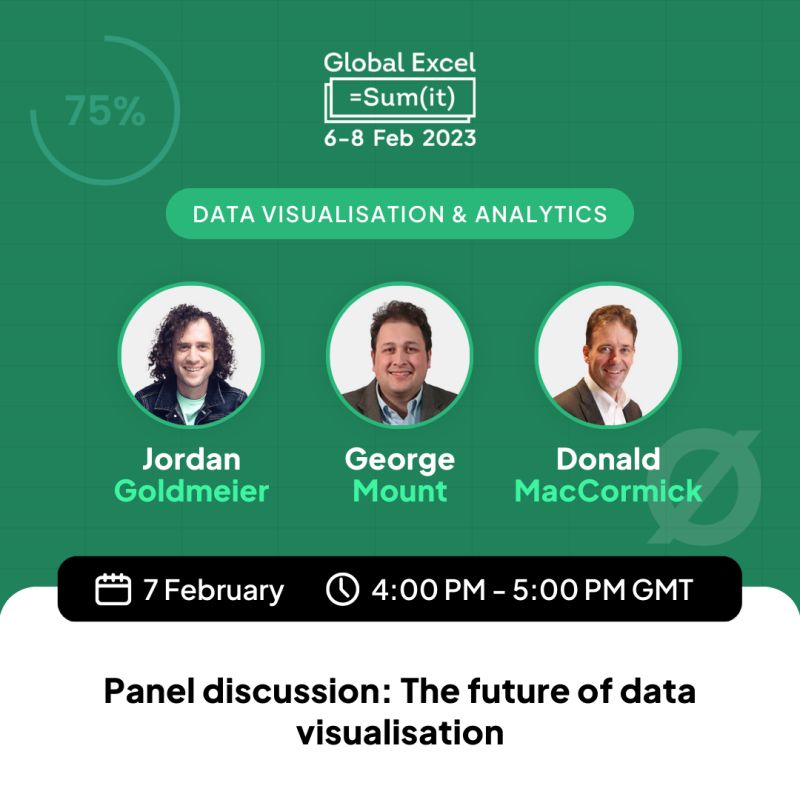
Our very own Donald is joining ‘The future of data visualisation’ discussion at the @ExcelSummit. They'll discuss tools such as @Squirrel_365, and trends like storytelling, virtual reality, and AI.
bit.ly/3wtGPUN
#excel #microsoftexcel #globalexcelsummit #squirrel365
2
2
254
No Code Punk retweeted
14 Dec 2022
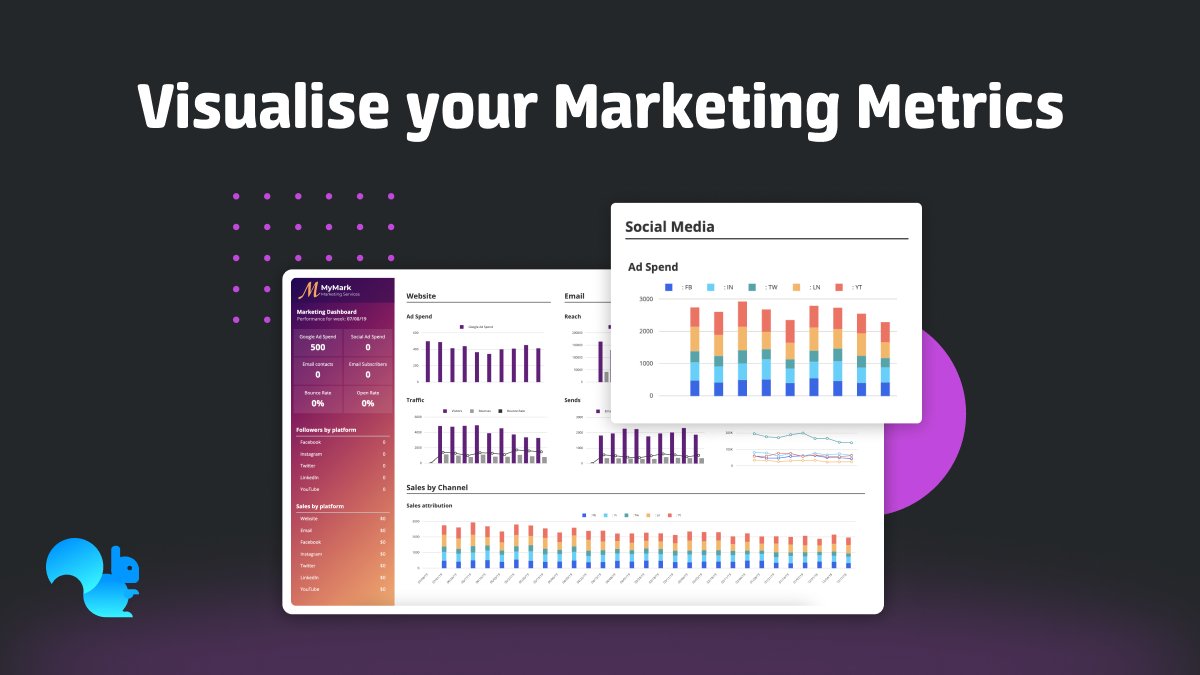
Create marketing dashboards that visualise your key metrics. With Squirrel you can add "what-if" analysis, so you can make informed decisions. All built on data and logic from your spreadsheets! See how Squirrel can help you: bit.ly/3UL4nOV
#Marketing #Dashboards
1
4
No Code Punk retweeted

26 Nov 2022
Enough with the fake accounts, tell me about a ska song (old or new) you recently discovered that RULES!
34
4
32
No Code Punk retweeted
14 Nov 2022
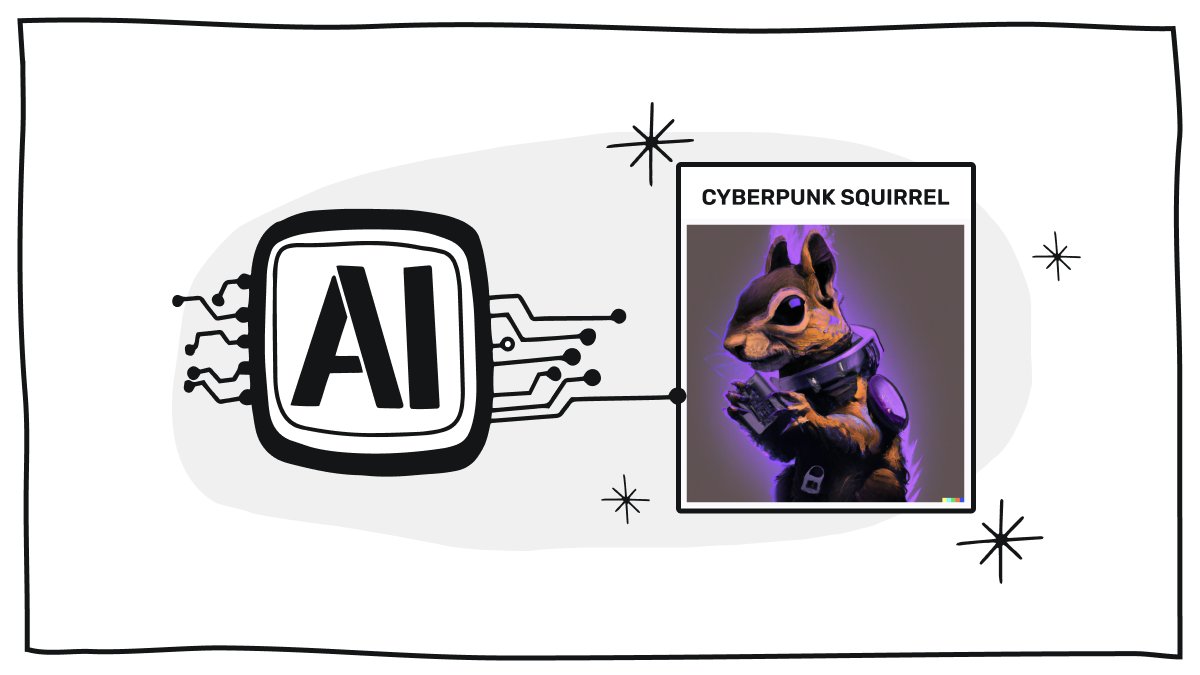
Imagine being able to create a unique image from a phrase for your web application! When OpenAI made the DALL·E API publicly available, we tested it to see how good the image generation was! Check out our blog post... bit.ly/3NWvsNb
#openai #imagegenerator #dalle
2
3
8 Nov 2022
Still blown away by how easy it is to turn a #Spreadsheet into a web page with @Squirrel_365. I also can't wait for the animation add-on to be officially launched!
Live Version - bit.ly/3NgVBGl
#Excel #NoCode
1
2
No Code Punk retweeted
7 Nov 2022
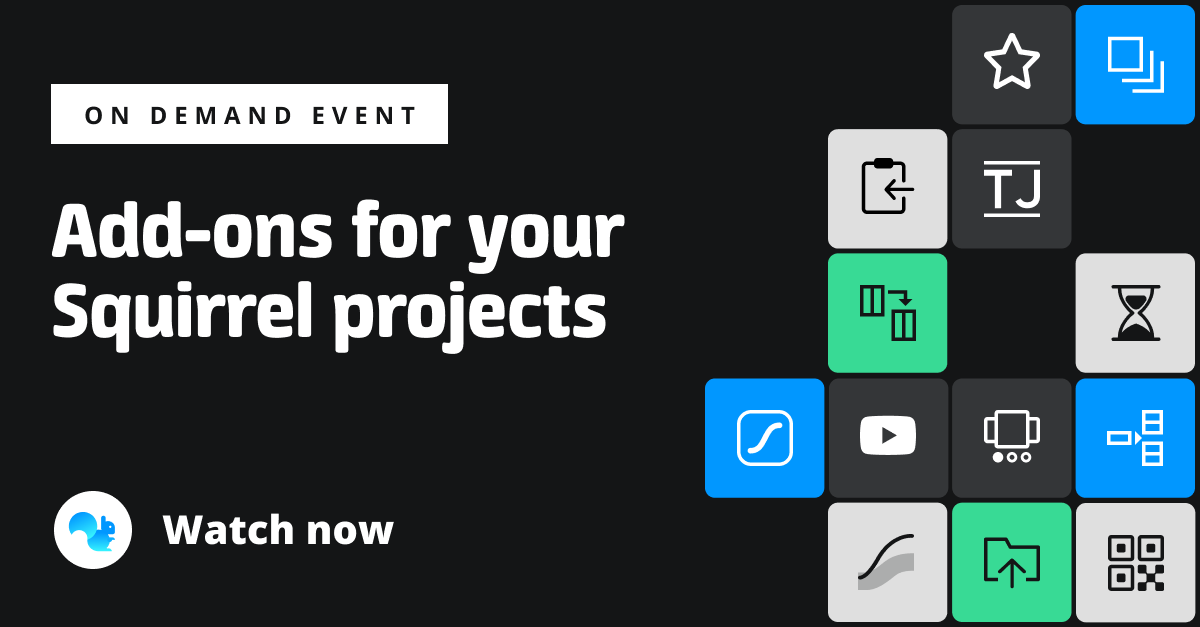
Watch our recent on-demand webinar where we show off the newest available add-ons for Squirrel. Learn how quickly add-ons can enhance your project’s capability!
bit.ly/3NuFl4u
#addons #squirrel365marketplace #nocode
2
2
No Code Punk retweeted

3 SQL Games that will take your SQL skills to the next level
🧵👇
103
1,104
4,315
4 Nov 2022
Have you found any AMAZING #MidJourney prompts? I've logged about 100 ideas and am using them to build an online prompt generator. Feedback is greatly appreciated! bit.ly/3DQ1XJm
#aiart #art #aiartcommunity
No Code Punk retweeted

2 Nov 2022
GM Fam! 🌻
Let’s walk among the stars ✨
23
52
243
No Code Punk retweeted

3 Oct 2022
The S&P 500 ended Q3 at a new low for the year, down 23.9%. This visualization shows the dividend-adjusted price change for each of the 500 stocks since the year began.
#sp500 #stocks #dataviz #javascript
4
21
75
2 Nov 2022
What's your favorite cartoon style? Have you tried it as a #Midjourney prompt?
Check out over 100 different prompt inspirations here. bit.ly/3DQ1XJm
#aiart #art #aiartcommunity
6
No Code Punk retweeted
2 Nov 2022
Here are some more fantastic tips from our webinar with John Michaloudis from @myexcelonline summarised in our 2-part blog post. He's always full of good ideas for supercharging your Excel spreadsheets. Check it out... bit.ly/3D9tqp9
#spreadsheets #squirrel365 #excel
3
6
1 Nov 2022
What's your favorite #Midjourney prompt? I've saved my inspiration here: bit.ly/3DQ1XJm
#aiart #art #aiartcommunity
4
No Code Punk retweeted

27 Oct 2022
I've been asking AI to generate Games Workshop / Warhammer miniatures of people I'm not fond of and the results do not disappoint.
Rishi Sunak

114
714
3,761
30 Oct 2022
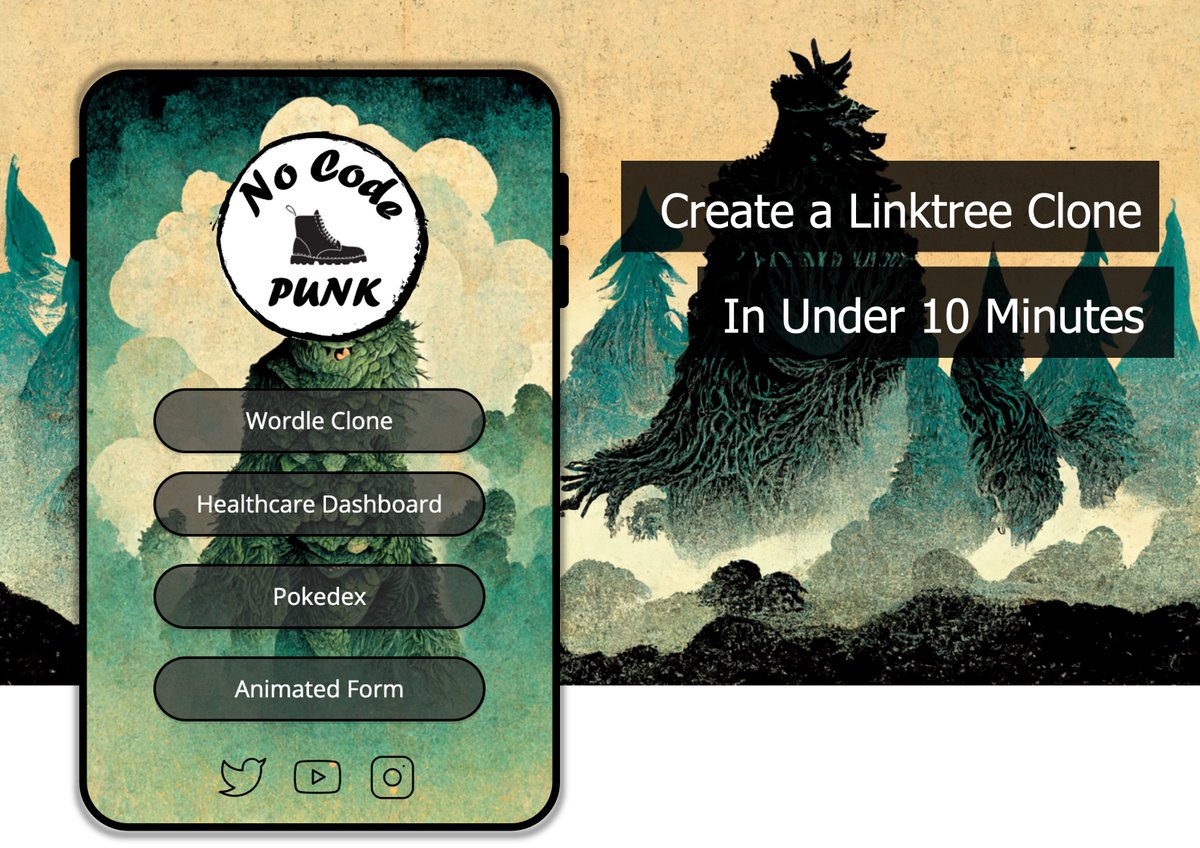
Create your own custom Linktree Clone with #nocode in under 10 minutes using @Squirrel_365
⦿ Quick Tutorial - youtu.be/eHa-6_-bd9U
⦿ Live Version - bit.ly/3NgVBGl
#Spreadsheet Magic
1