
Committed to promoting open data, data governance, and data-driven decision making in Lebanon.
Joined August 2020
- Tweets 110
- Following 51
- Followers 340
- Likes 144
46 Photos and videos


11 Nov 2021
Hi folks in #Lebanon 🇱🇧We’re looking into #SolarEnergy & would really appreciate it if you could complete this short anonymous #survey:
👉forms.gle/oPb64mb9PiTaA6n27
The aim is to assess people’s awareness & interest in it, share the #data openly & reach out to solution providers.
1
30 Jul 2021
Check out this insightful dashboard 'Lebanon Citizen Budget' aimed at improving budget transparency and accessibility - developed by @IOFLebanon & Insights Analytica:
👉 app.powerbi.com/view?r=eyJrI…
#Lebanon #Finance #OpenData
2
Open Map Lebanon retweeted

27 Jul 2021
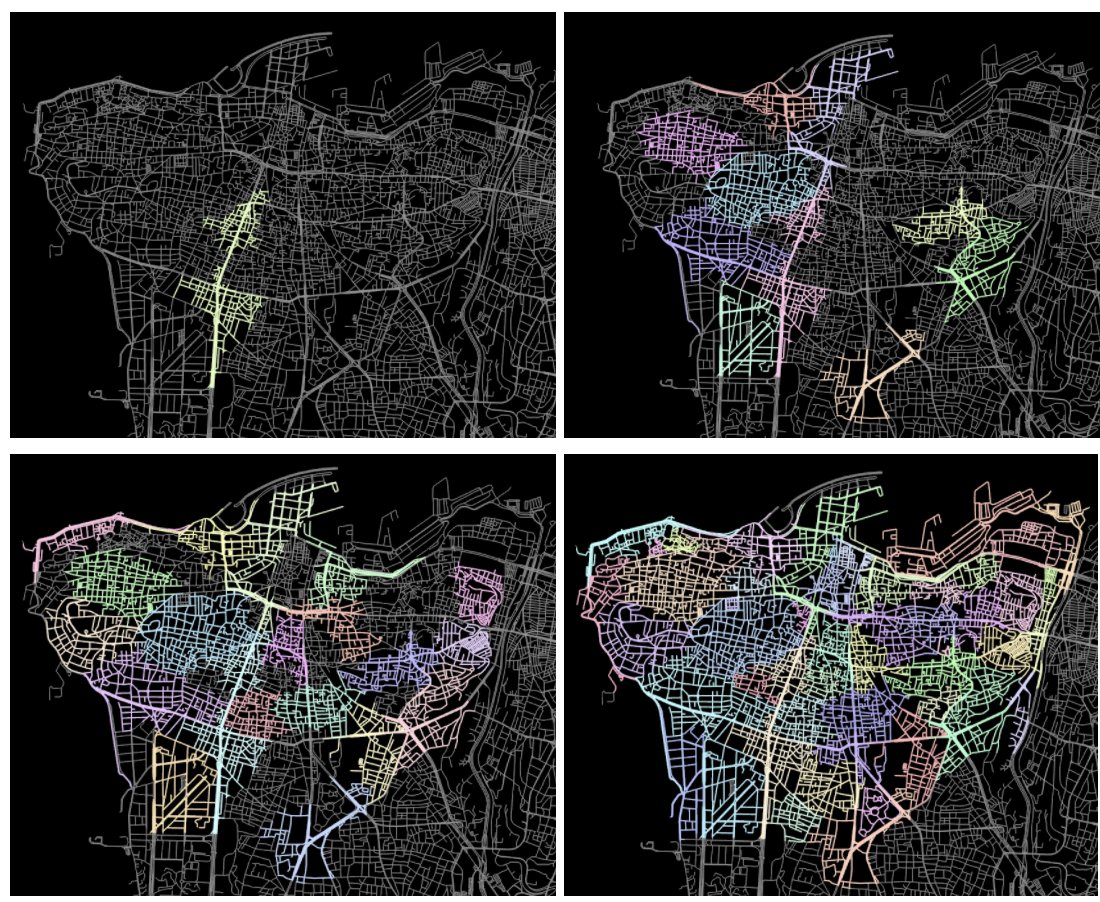
Our @UNDPAccLabs worked with @meldaSalhab @MathewNg to explore vulnerability in Beirut neighborhood post-blast through #spatial data processing techniques such as population analysis, urban morphology, & accessibility analysis.
👉 more on their approach: bit.ly/3jqbcGm
1
5
19
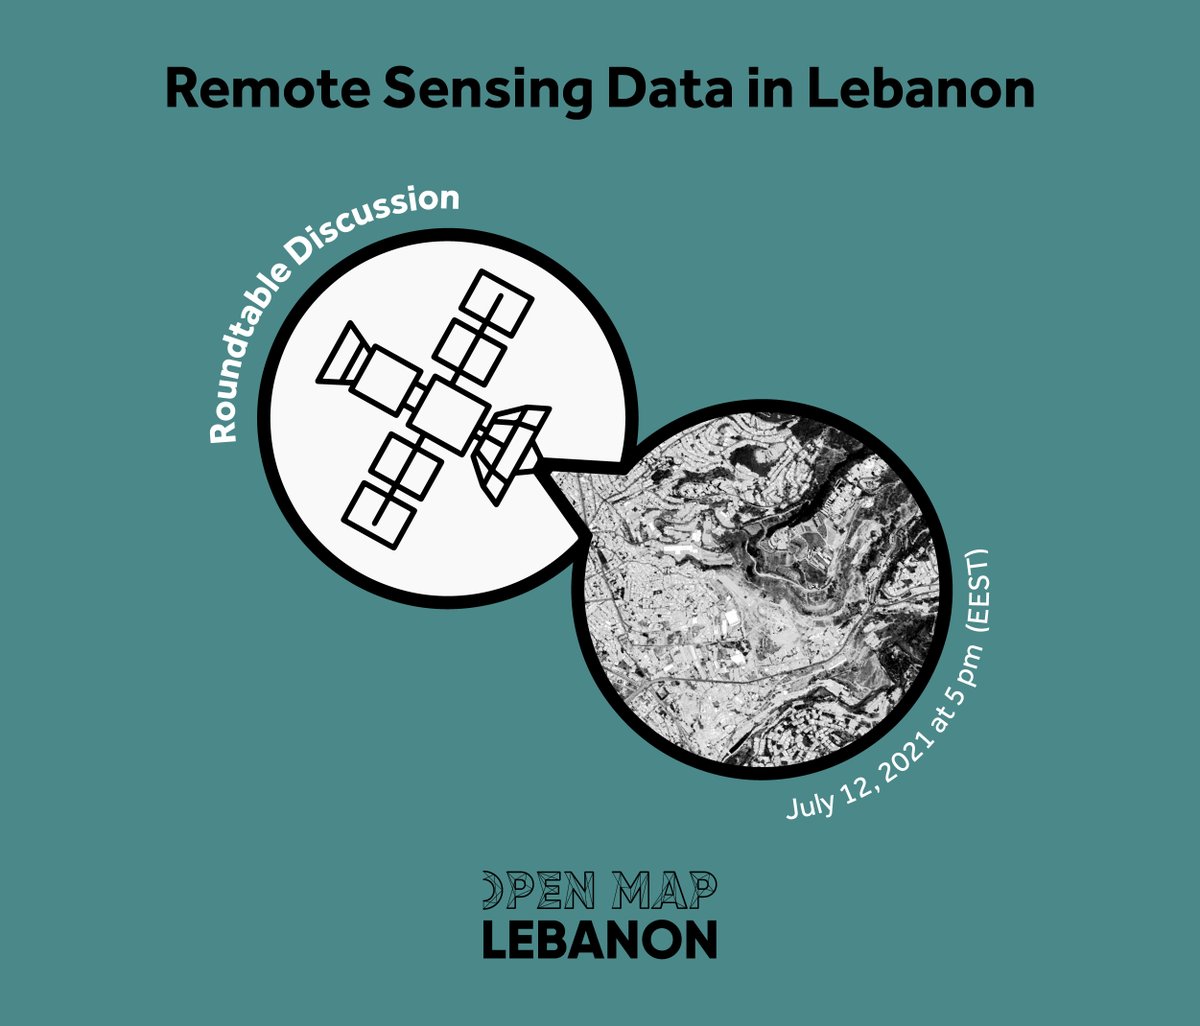
10 Jul 2021
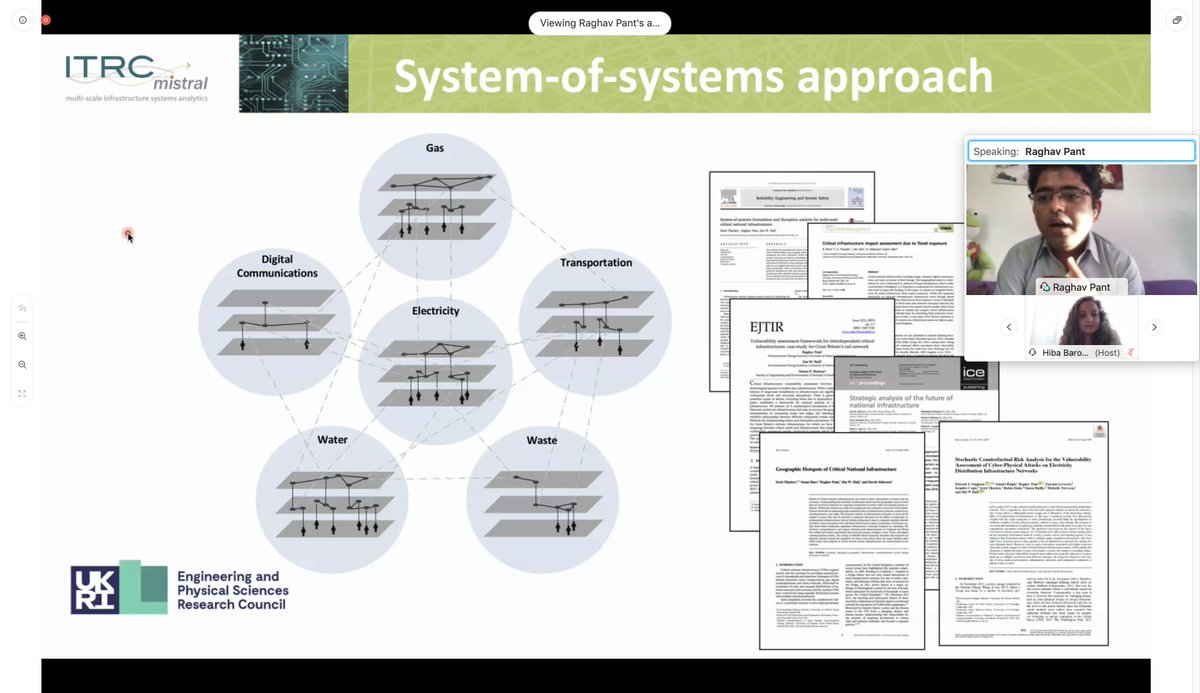
🛰️ Join us for a Roundtable Discussion about Remote Sensing on Monday 12th, 5pm(EEST). We’ll talk about how global datasets can be used to help with data scarcity in Lebanon, focusing on which problems can be solved & how.
💬 Link: ucl.zoom.us/j/98785311514?pw…
1
2
10 Jul 2021
The session will also be live streamed on our Facebook page: facebook.com/openmaplebanon
4 May 2021
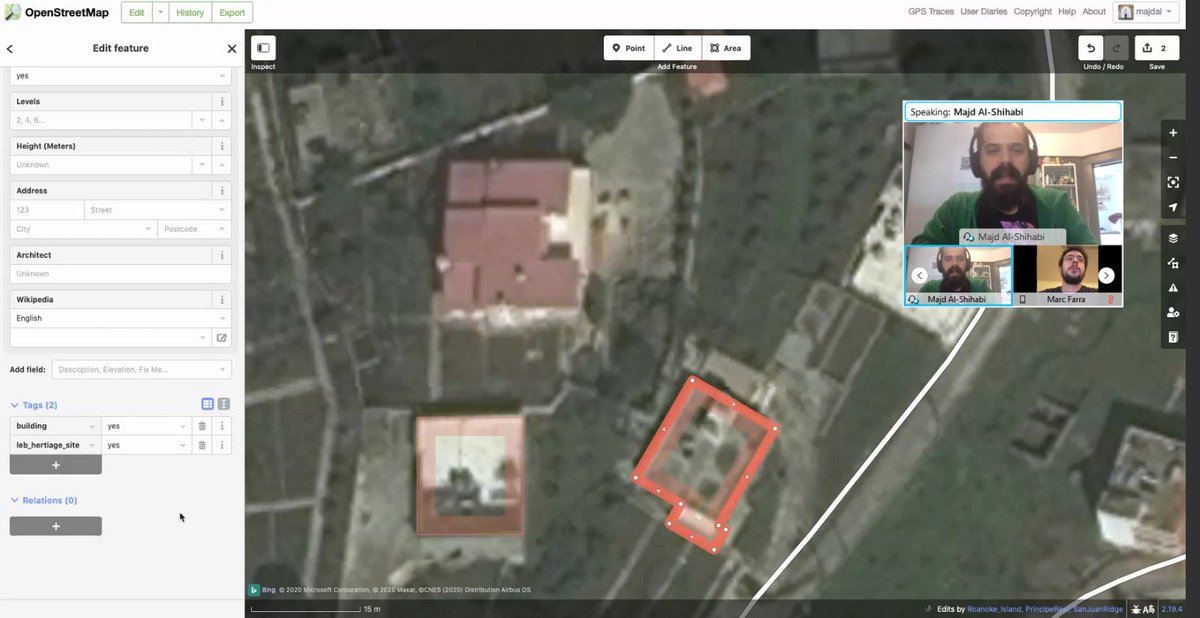
📢 Call for Participants - Missing Maps ⚠️
The @RedCrossLebanon 🇱🇧along with @DRKvorOrt volunteers 🇩🇪 is mapping Matn District (buildings & infrastructure): looking for volunteers to help with remote mapping.
Interested? More about the project here:
tasks.hotosm.org/projects/10…
1
14 Apr 2021
Open Data in 60 Seconds - a quick overview of open data, why we should care, and what we can do.
Part of the @WorldBank 's fantastic Open Government Data Toolkit.
opendatatoolkit.worldbank.or…
#OpenData #Data
2
6 Apr 2021
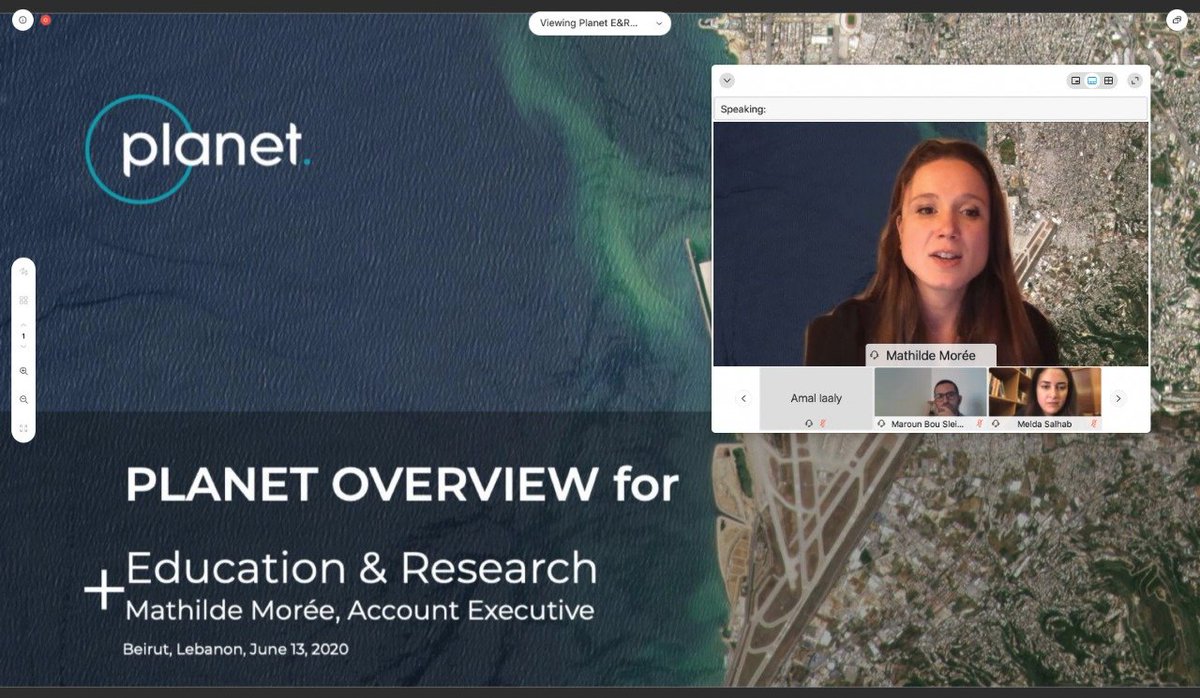
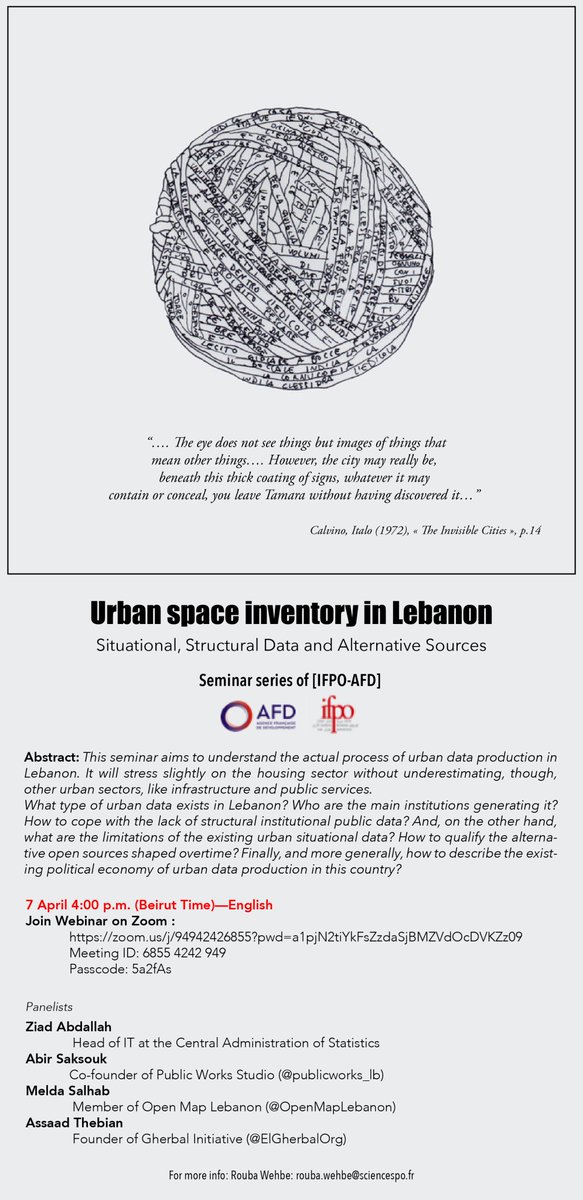
💬Join us tomorrow with @ifporient where @MeldaSalhab will be talking about @OpenMapLebanon, our experience with #data collection and why it is important to have local public data in #Lebanon.
Link to webinar: ifporient.org/urban-space-in…
2 Apr 2021

[webinar] In collaboration with @AFD_MidEast "Urban space inventory in Lebanon. Situational, Structural Data and Alternative Sources"
📅April 7th ⌚️4 PM (Beirut time)
1
Open Map Lebanon retweeted

15 Mar 2021
A startling 19 politically exposed people (PEPs) exist among the shareholders of #Lebanon's cement cartel: Sibline, Cimenterie Nationale, and Holcim.
Many more occupy seats in the companies' boards of directors. Read our latest paper "Mountain to Mortar"
thinktriangle.net/mountain-t…

THREAD 1/ Our latest investigation reveals the names of political elites who control #Lebanon's cement cartel.
SIBLINE:
- PM-designate Saad Hariri
- 3X Close family members of Saad Hariri
- 1X Former Economy Minister Nicolas Nahas
- 2X Indirect PEPs

4
17
Open Map Lebanon retweeted
12 Mar 2021
Ever wondered who owns all of those illegal quarries in #Lebanon?
Yep, a quarter of them are politicians, their extended family and associates. You can find all the names and locations in my latest paper for @Think_Triangle:
thinktriangle.net/mountain-t…

3
33
89
28 Feb 2021
🇱🇧📢Check out this #COVID19 Test Scanner tool by our very own @sherifmaktabi: covidlb.pory.app/
It compiles a list of all test centers, clinics & labs available in #Lebanon and recognized by the Ministry of Public Health.
#Covid19 #CovidTest #OpenMapLebanon #Lebanon
28 Feb 2021

💉🇱🇧 Even with vaccines and lockdown, Lebanon's COVID cases are growing. So I made this tool to help people find the nearest, cheapest and fastest COVID test near them.
covidlb.pory.app/
@ChangSara @OpenMapLebanon @impact_gov
1
Open Map Lebanon retweeted

19 Feb 2021

19 Feb 2021

Recent PhDs interested in historical and temporal aspects of Lebanese refugee policy - look no further! Excellent post doc opportunity @LebaneseStudies working with a fabulous team of scholars.
2
2
Open Map Lebanon retweeted

3 Feb 2021
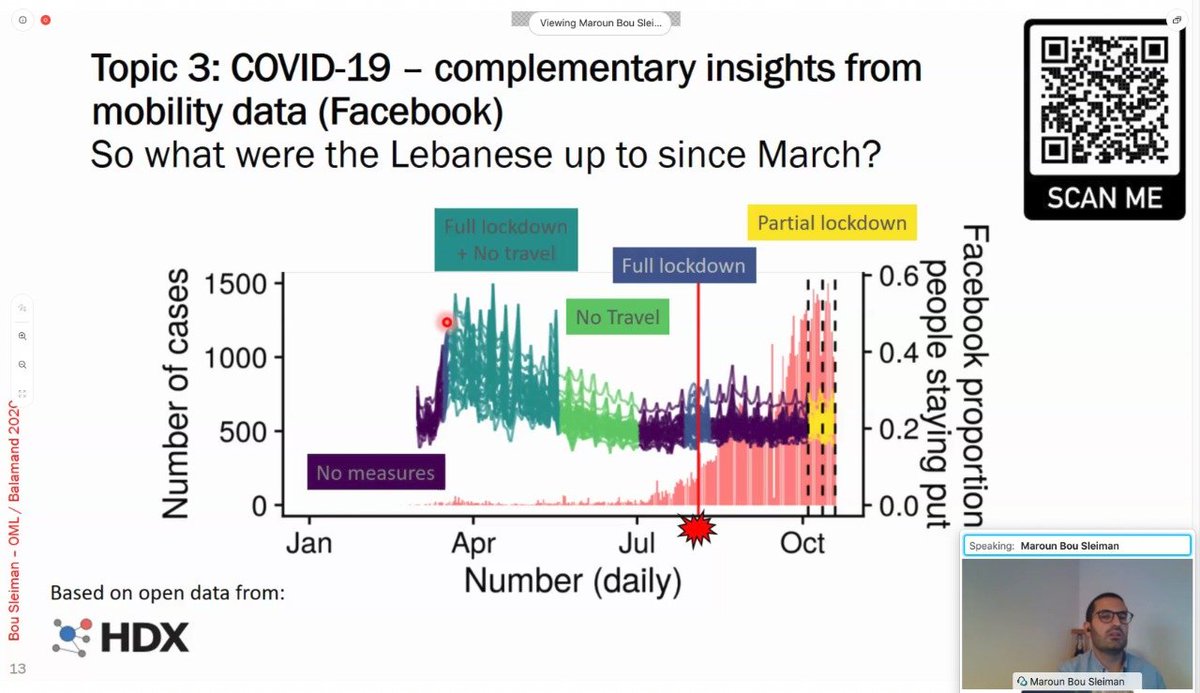
We're happy to share with you the video of the #COVID19 Webinar of 23Jan.
Thanks again to our wonderful guest speakers:
@DrHZaraket @GhinwaHayek @bs_maroun
👉New viral strain/variants
👉Data needs/limitations
👉Surveillance
👉Future paths
👉#ZeroCovid
youtube.com/watch?v=6JiAy0O_…
10
17
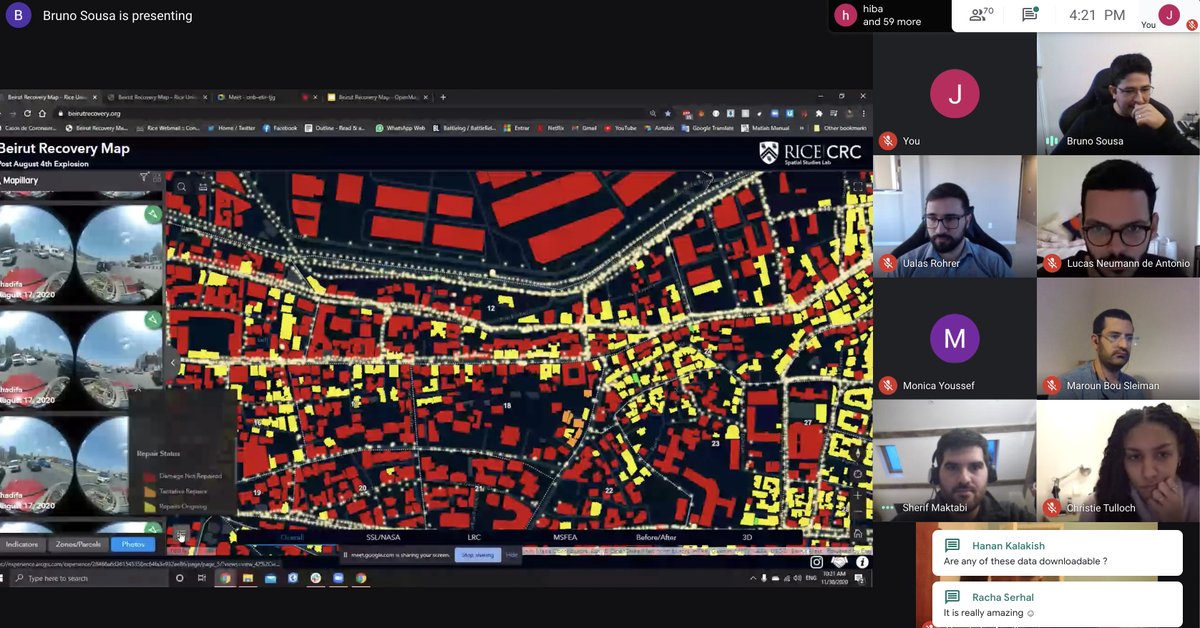
Open Map Lebanon retweeted

3 Feb 2021
Using Mapillary images in ArcGIS Experience Builder.
beirutrecovery.org
#esri #arcgisonline #experiencebuilder #mapillary #beirut
1
16
31
Open Map Lebanon retweeted

21 Jan 2021
The OSM Foundation Board wants to hear from you on our work in 2020 and priorities in 2021. Take the survey at osmf.limequery.org/281662 It's been translated into 17 languages! More details on the survey at blog.openstreetmap.org/2021/…
2
30
37
Open Map Lebanon retweeted

19 Jan 2021
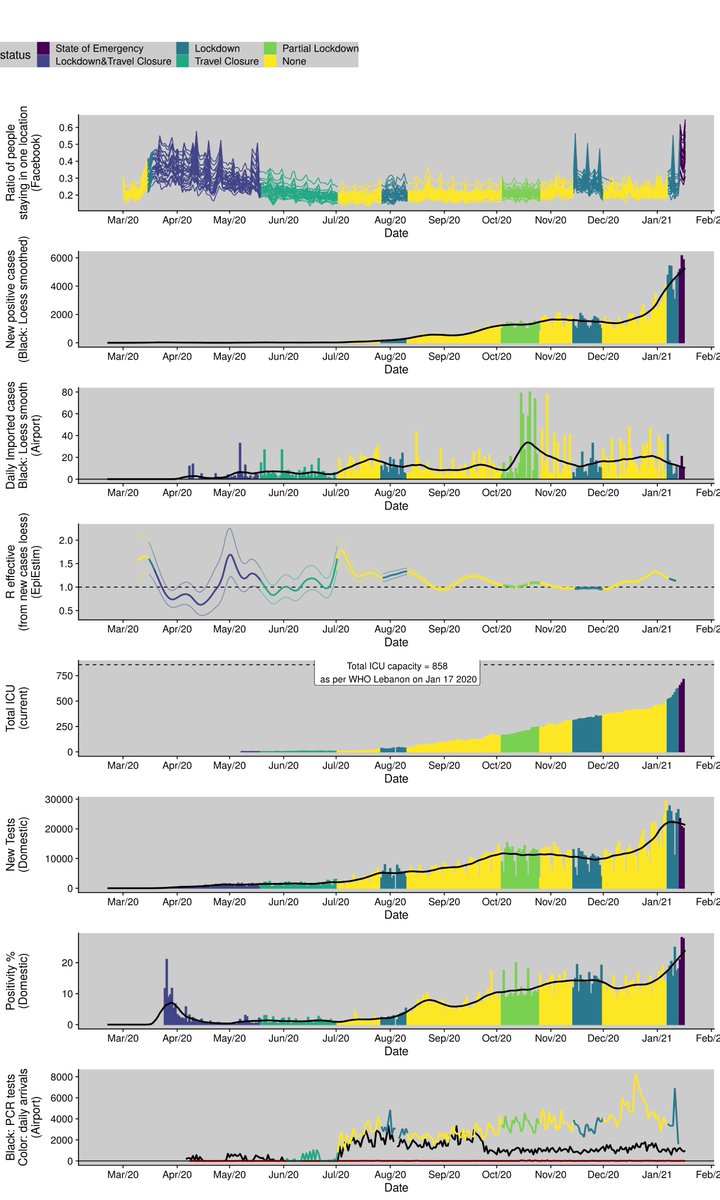
1.Updated and integrated view of #Lebanon's #Covid pandemic. This time with a feeble attempt to estimate the effective reproduction number (Re). The only good news is that #Facebook movement data show the largest ever reduction in users' movement - more than the first lockdown.
2
7
22
Open Map Lebanon retweeted

18 Jan 2021
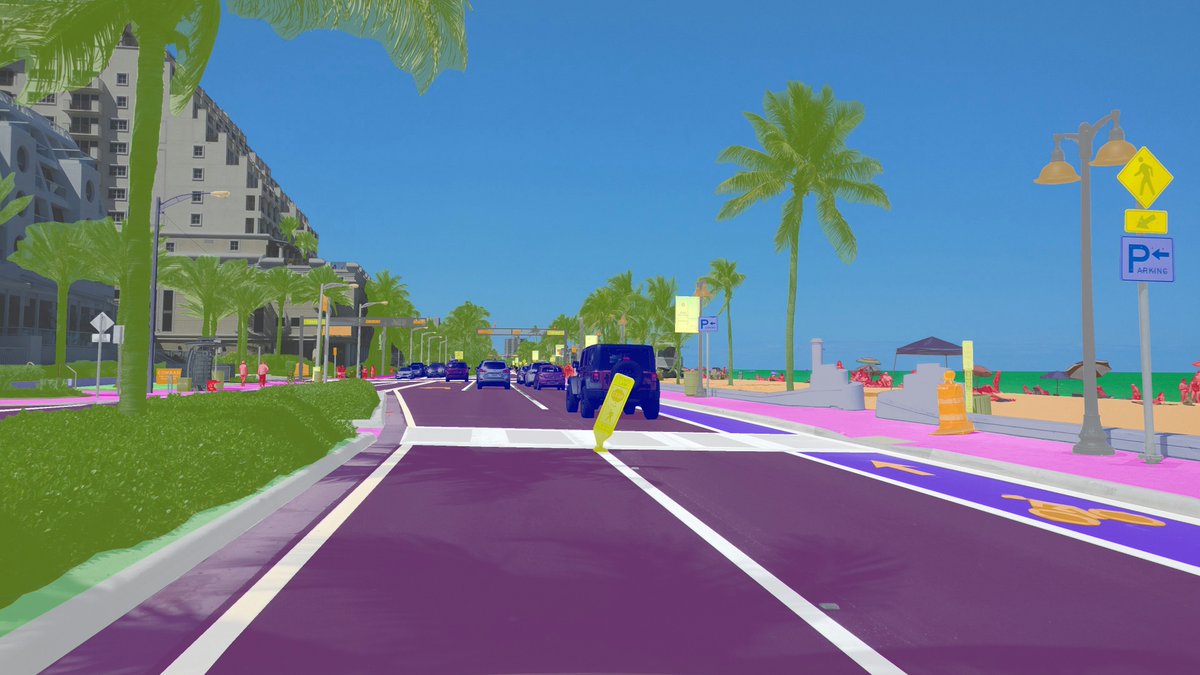
Today we are announcing the release of Vistas 2.0. Vistas is a street-level image dataset of 25,000 images that helps machines to understand street scenes.
In this release we double the amount of labelling categories. Researchers can download 2.0 now.
blog.mapillary.com/update/20…
3
12
49
Open Map Lebanon retweeted
7 Jan 2021
And here's a composite plot showing (1) how people reduced their mobility in response to measures, (2) daily positive cases, (3) ICU occupancy, and (4) airport arrivals and testing. ICU capacity should be reached somewhere in February, but better numbers and models needed.

1
6
12