Empowering Traders, Analysts, and Portfolio Managers to discover unique market opportunities with powerful software and valuable education.
Joined May 2009
- Tweets 4,638
- Following 463
- Followers 10,277
- Likes 4,033
3,036 Photos and videos


To request a free demo of our advanced charting and analysis software see here: optuma.com/trial/
2
1
17
24,208
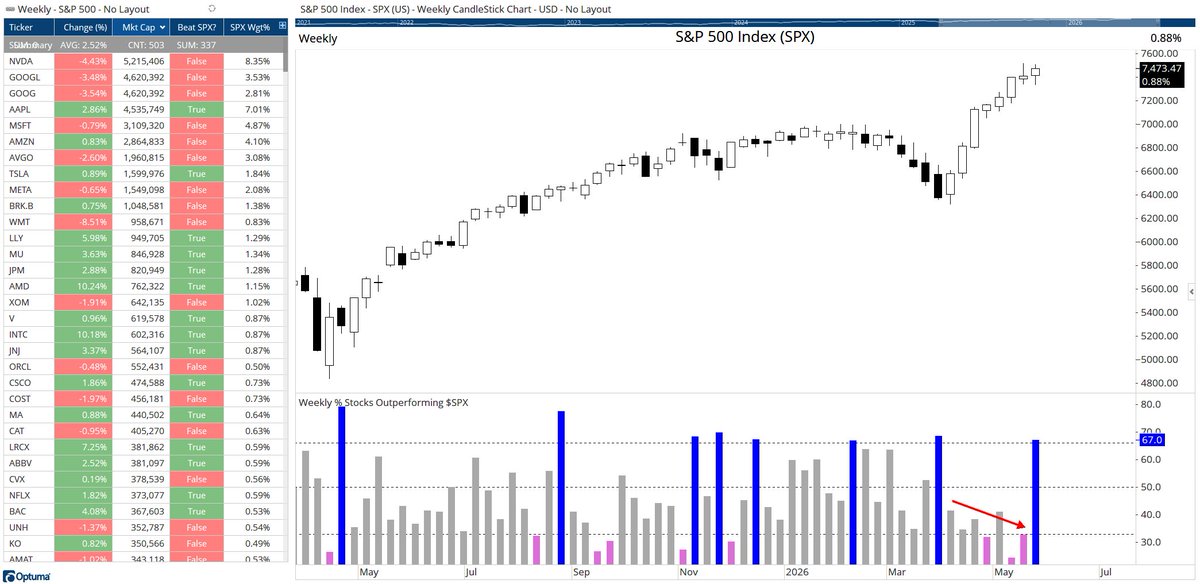
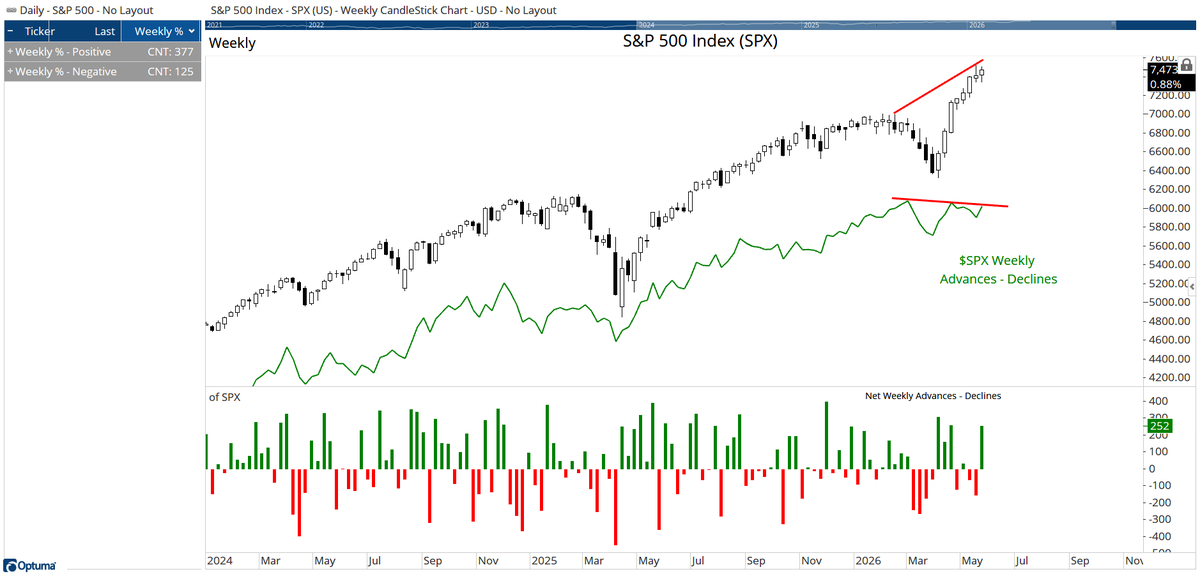
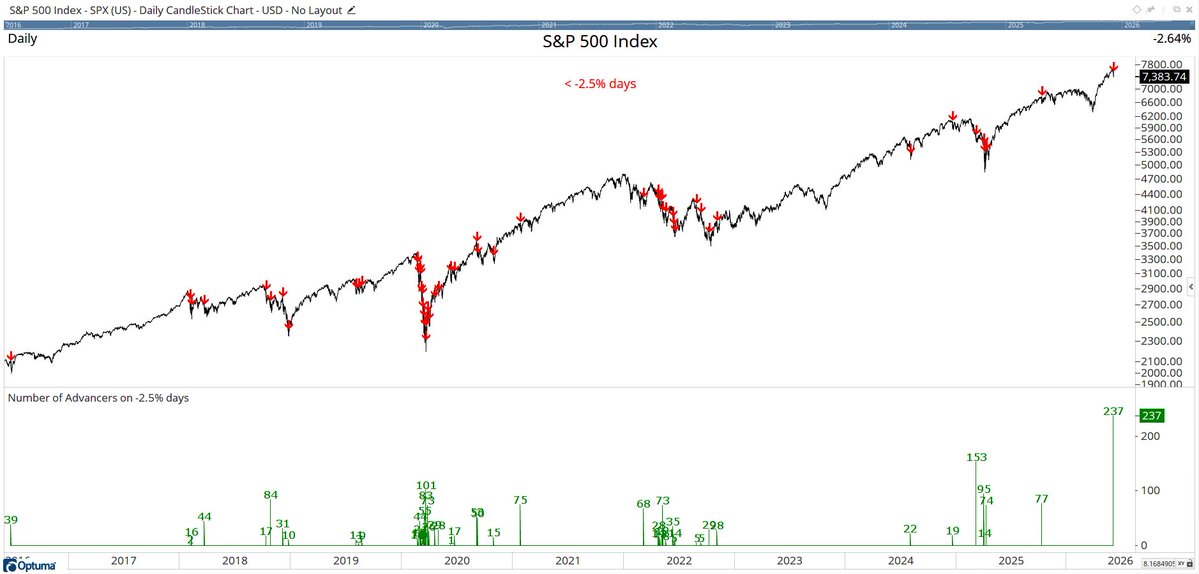
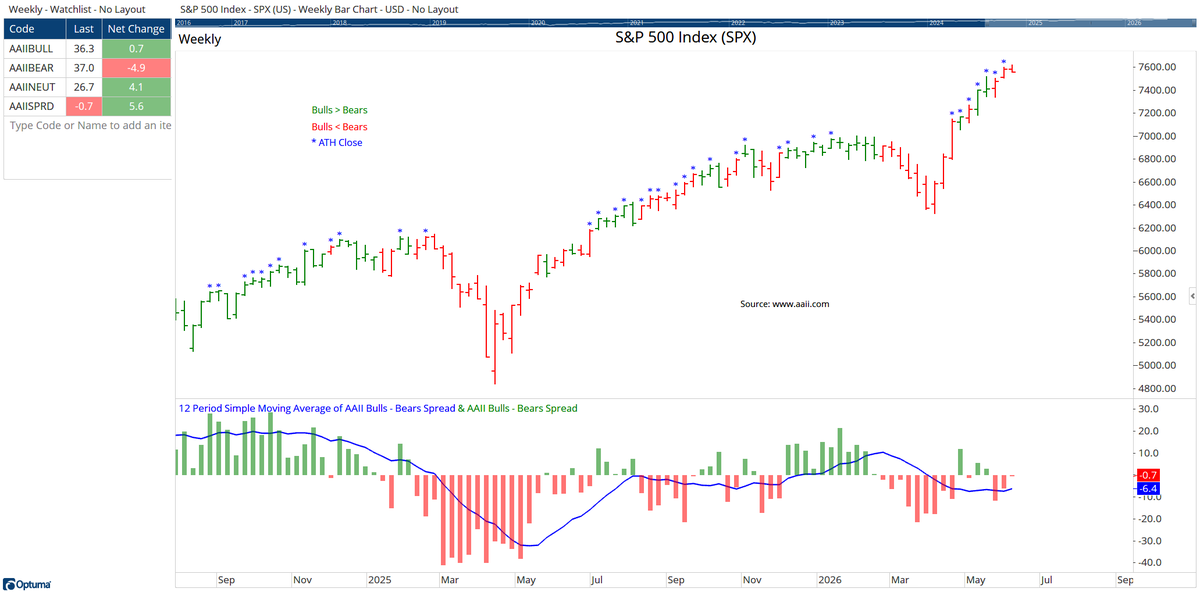
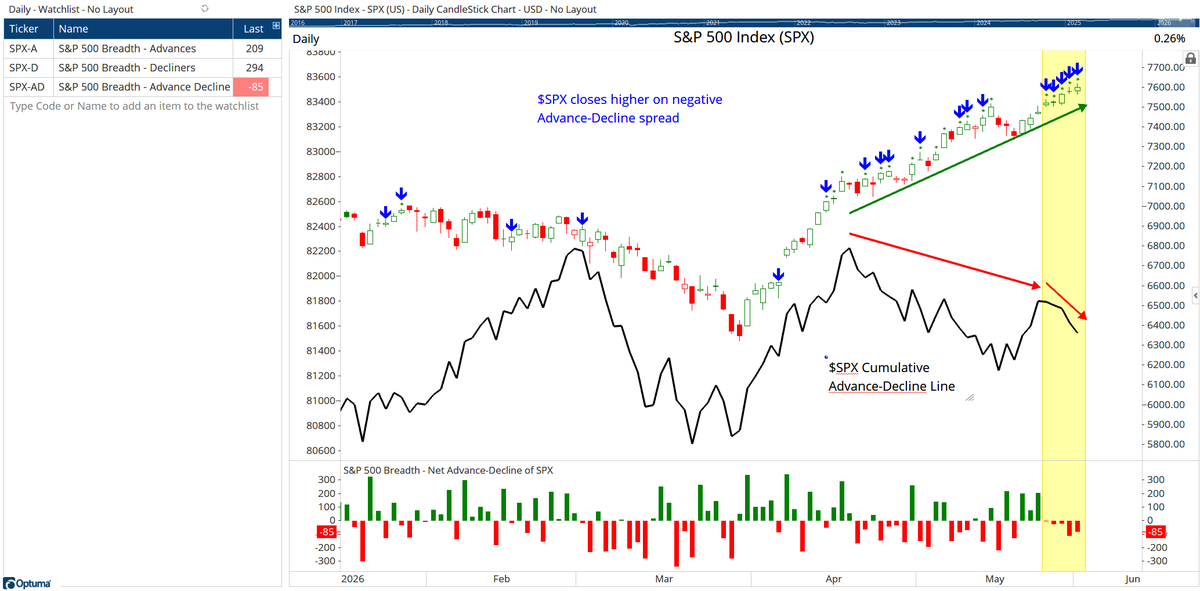
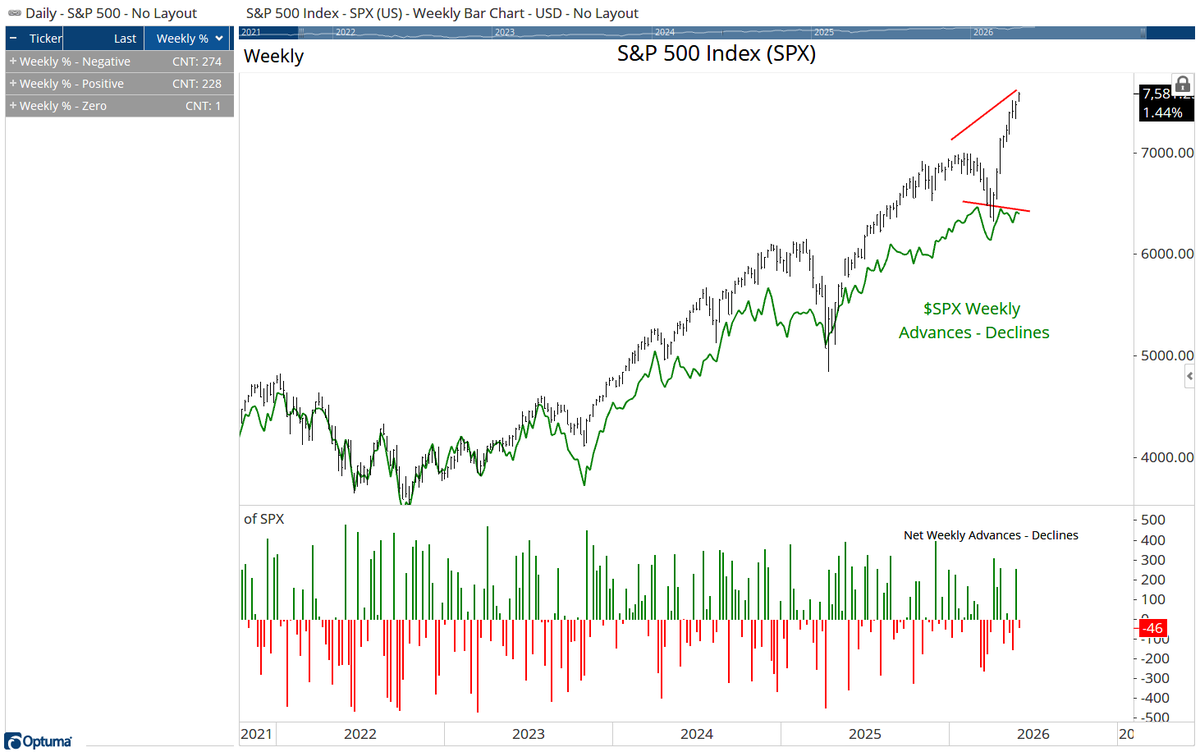
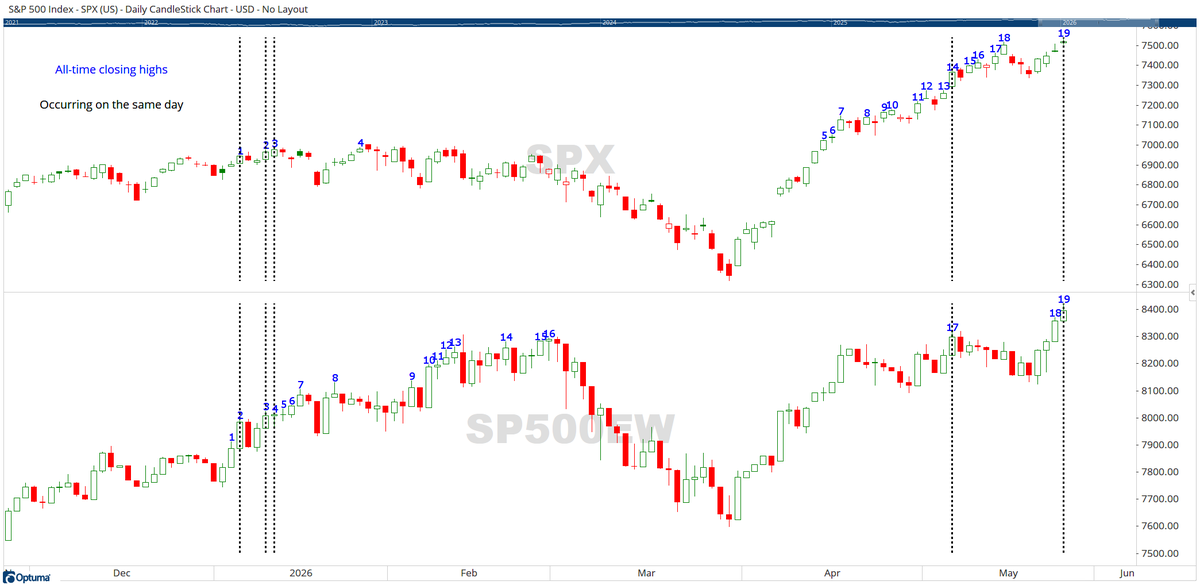
For the 1st time ever, the $SPX has made all-time closing highs the last 5 straight days, with more stocks declining than advancing on each day.

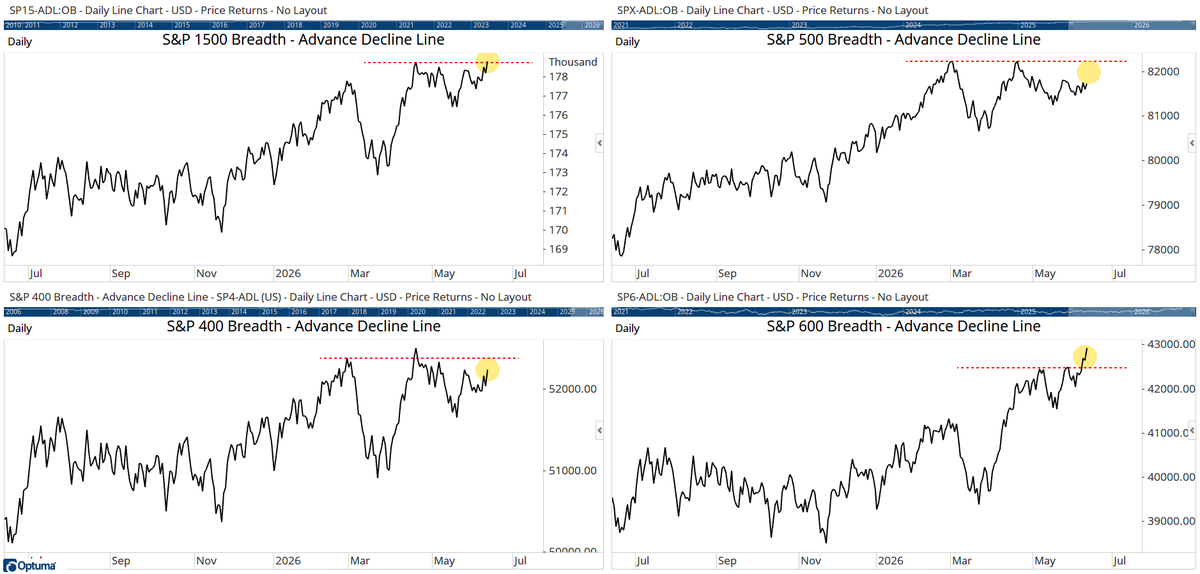
Is breadth sending a warning signal?
Join me live at 8 PM ET tonight as I break down what the market is really telling us.
👉 youtube.com/live/SxSb_UJxv_w

1
5
27
4,694