
Development planning expert | Decades in the uncomfortable trenches of demography, sociology, macroeconomics, housing policy & sustainable development | Charts
Joined June 2020
- Tweets 36,345
- Following 193
- Followers 2,349
- Likes 11,154
7,630 Photos and videos


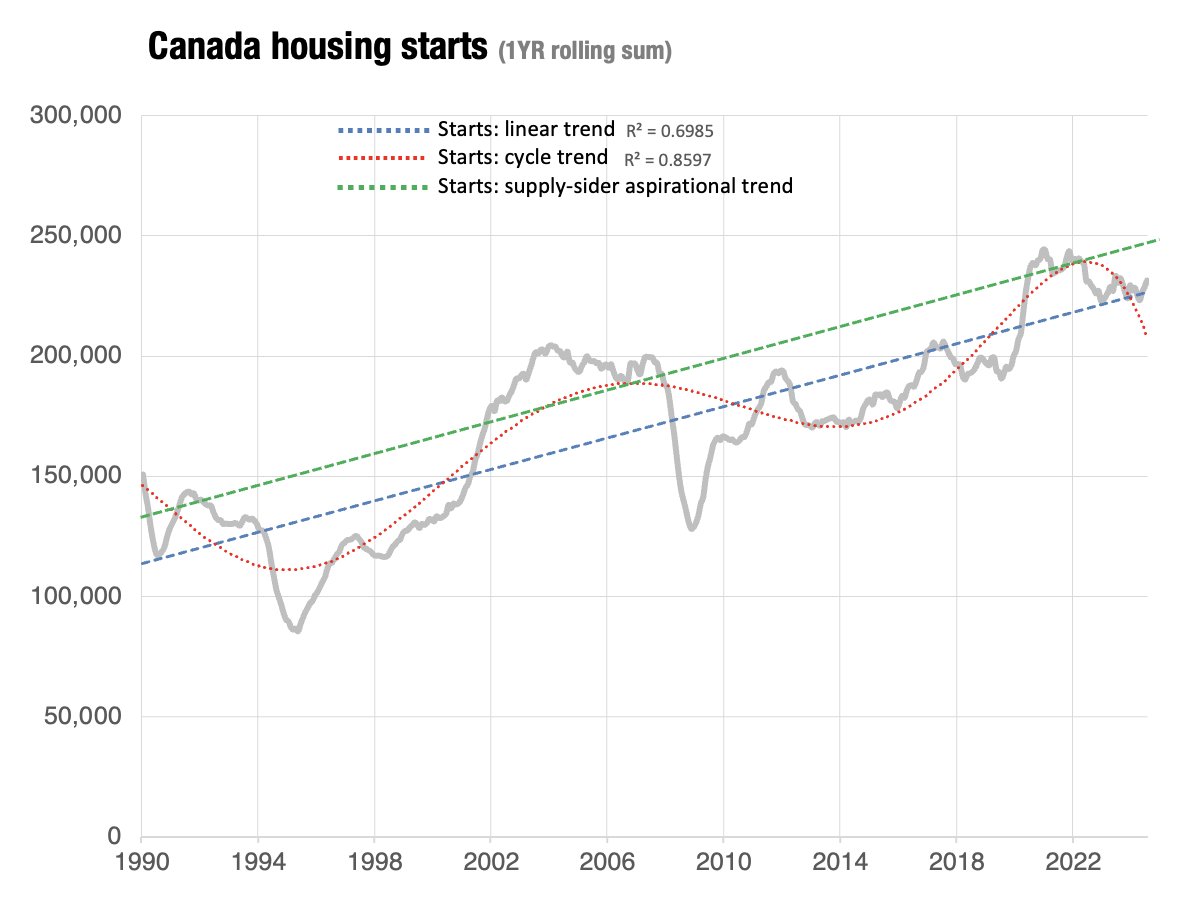
Housing starts swing wildly. Annoying I know.
Linear trend always “up,” polynomial shows the cycle (better fit with data).
Can we get to the mythical supply-sider green line where volatility is suppressed more supply more empty units...which presumably drives price⬇️?
2
4
13
28,268
Land transactions fall when price decelerates, land transactions rise when prices accelerates.
Land economics 101.
Jun 13

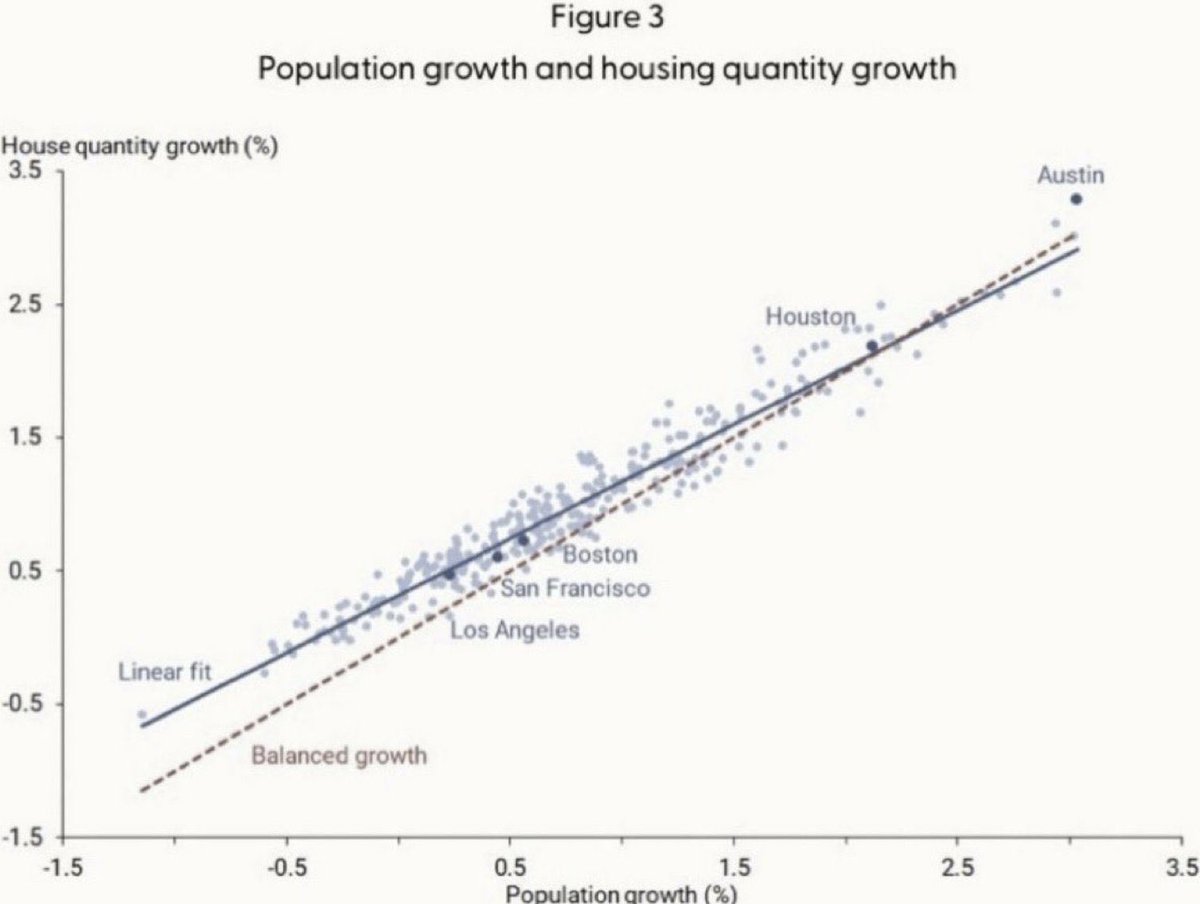
Why do housing and land prices rise together? Simple: increased demand for housing and constrained supply.
Higher housing demand translates to higher demand for land, and when zoning constrains supply, increased demand pushes up prices.

1
164
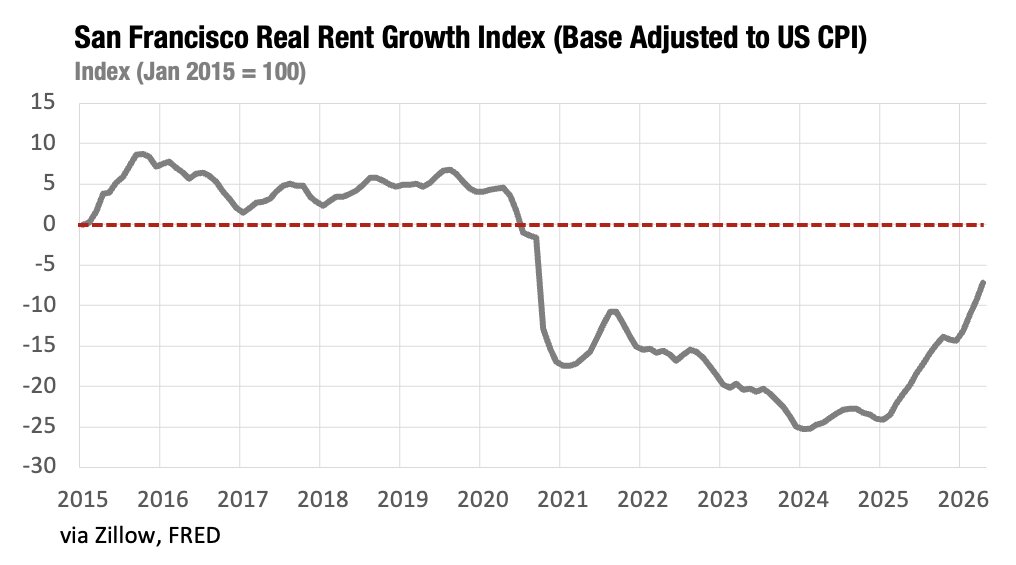
Inflation adjusted.

Can you say AI Boom?
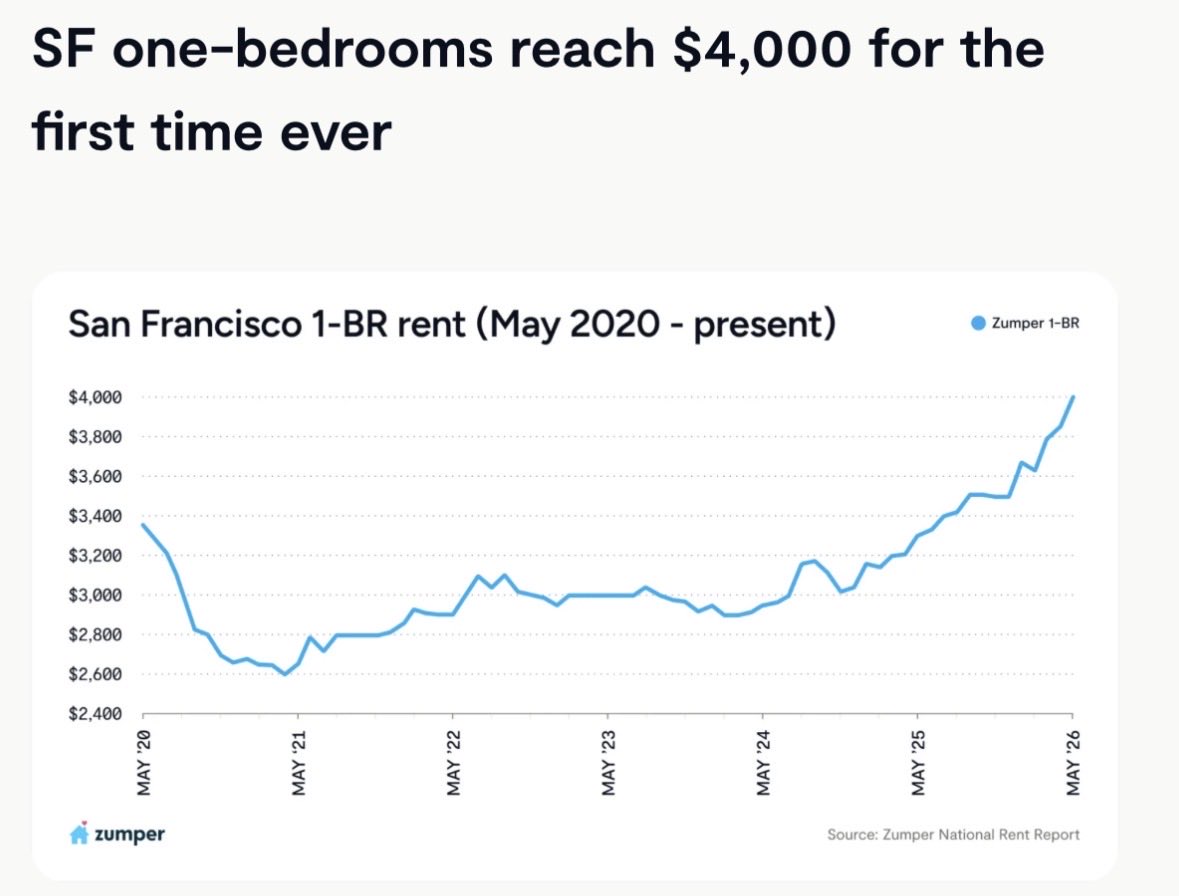
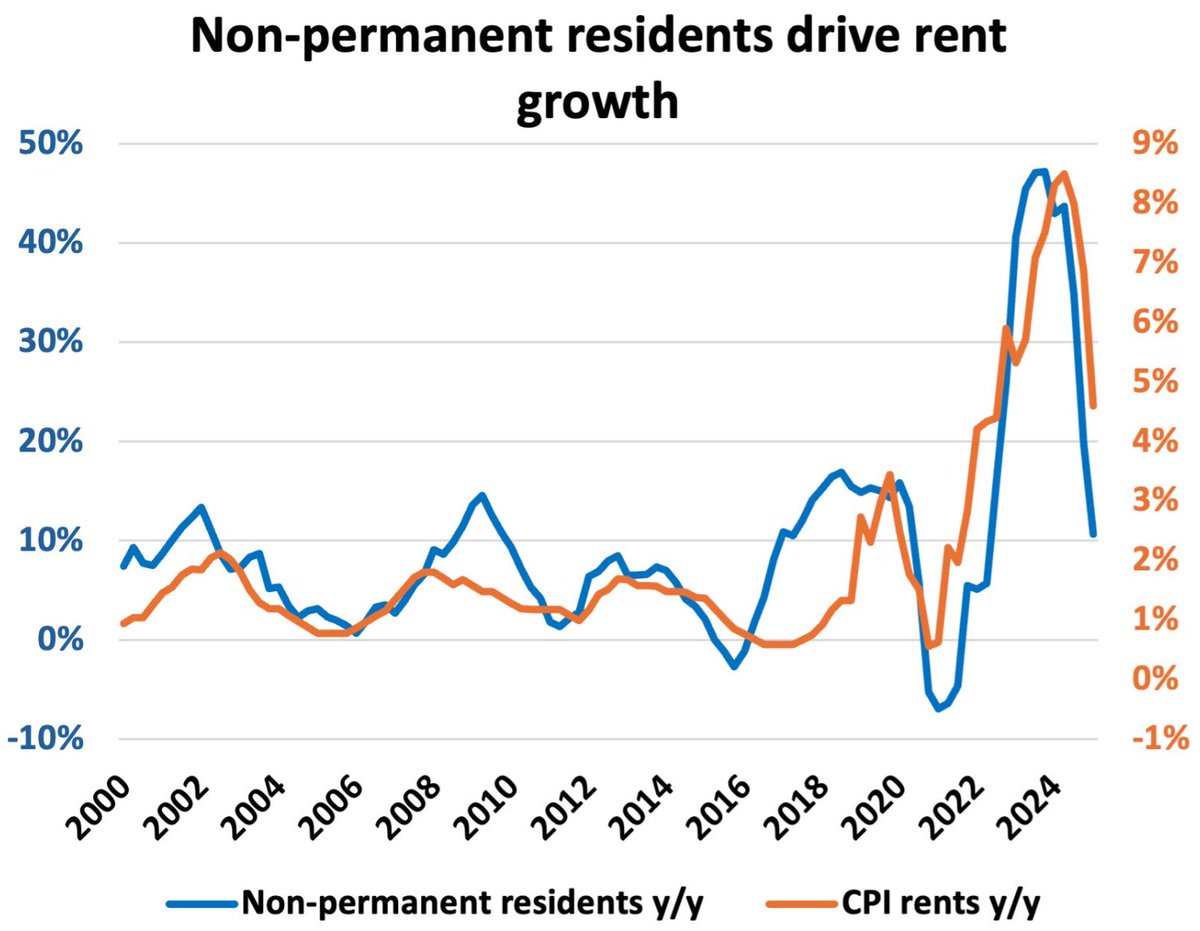
Despite rent growth softening in many markets nationwide, SF is an outlier with median rent for a ONE BEDROOM now surpassing $4000/mo for the first time in city history
1
553
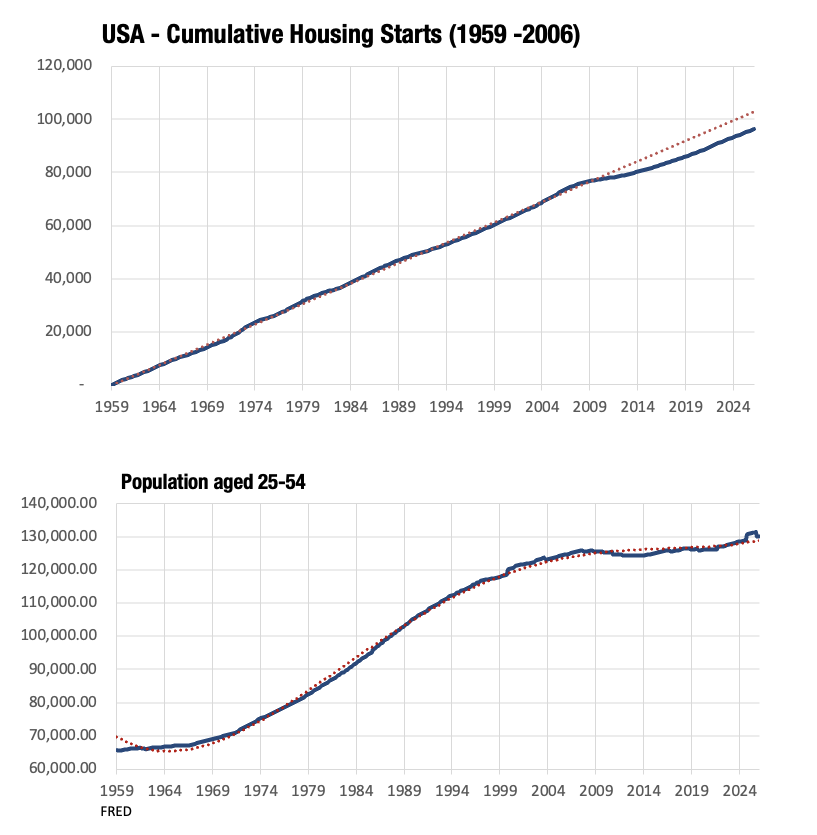
Some folks lament/blame housing issues (shortages) in the US because of housing starts shifting lower off trend post-2009.
The other thing that happened post-2009 was a flattening in the growth of people aged 25-54.
Not sure if this has anything to do with it.
1
2
301
Home price change added for fun.
15h

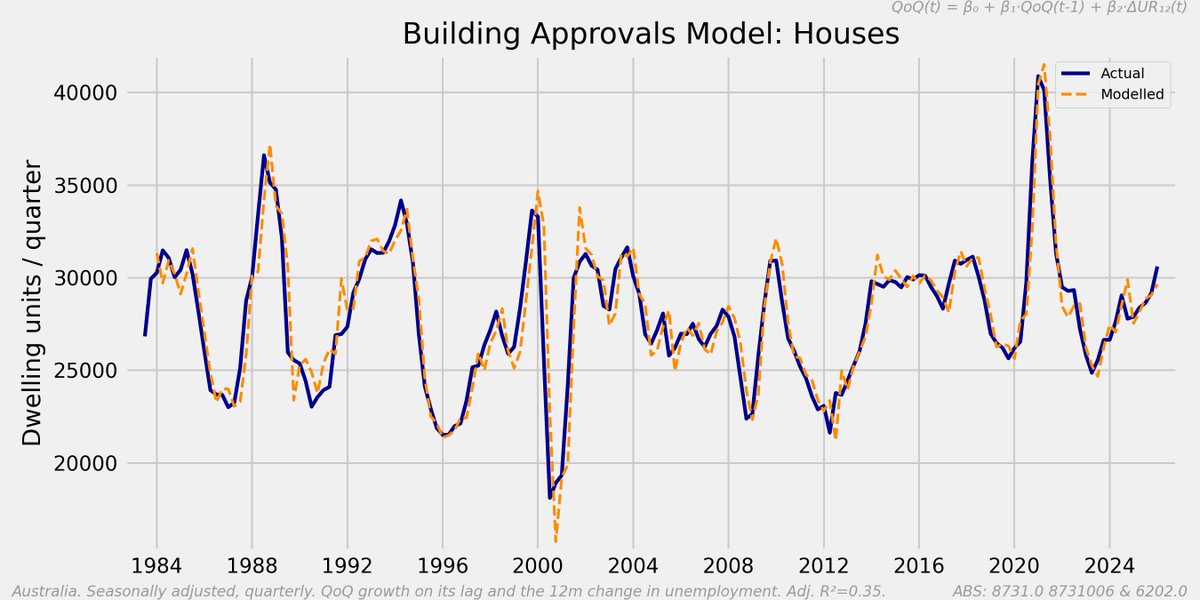
A building approvals regression model - it is about half momentum (AR(1)) and about half the 12m change in the unemployment rate.
The counterintuitive bit: a rising unemployment rate predicts stronger approvals growth, not weaker. That's because approvals lead the economic cycle and are driven by interest rates, and the RBA cuts rates precisely when unemployment is climbing. So "unemployment rose over the past year" really stands in for "the RBA has been easing," which lifts approvals. The unemployment rate is just a cleaner, less noisy way to capture that monetary cycle than the cash rate itself.
Tested and rejected on AIC/BIC gounds: Approvals level, log-level of approvals, year-on-year approvals growth, 1-month approvals growth, 3-month approvals growth, monthly frequency with stepped quarterly GDP, GDP Q/Q growth, GDP-per-capita Q/Q growth, GDP Y/Y growth, GDP-per-capita Y/Y growth, GDP-per-capita Q/Q lagged 1 quarter, GDP-per-capita Q/Q lagged 2 quarters, 3-month change in cash rate, 12-month change in cash rate, 12-month population growth (smoothed 15 ), lagged dependent on Y/Y
143
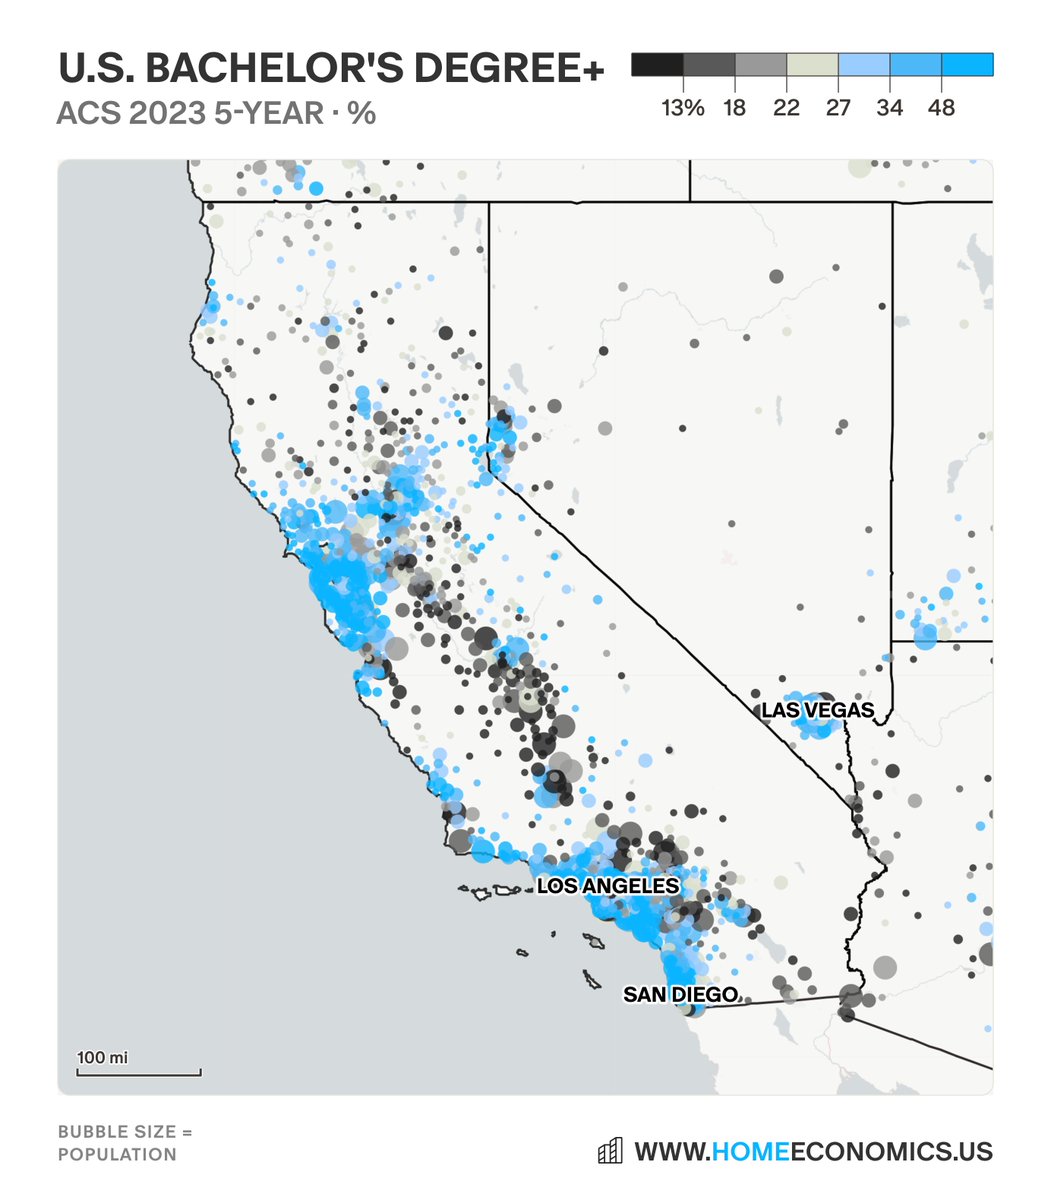
Just because you are educated doesn't mean you vote the right way😉

1
235
Doesn't really matter how you vote individually--it all depends on how the majority of your neighbors vote.
Suburbs, exurbs historically more conservative, central cities more liberal.
No need to pontificate about this too much.
Jun 13

The underappreciated divide shaping Canadian politics
A recent academic paper revisits an old question in Canadian politics: Does where one works shape how one votes?
Drawing on data from 16 federal elections between 1968 and 2019, the authors find evidence that Canada’s so-called “sectoral cleavage” remains alive and may even be growing stronger. Public-sector workers are generally more likely than their private-sector counterparts to hold Left-leaning economic views and support parties such as the NDP. The differences are especially pronounced among public-sector professionals and managers.
The paper cannot tell us exactly why these differences exist. It may be that people with more interventionist political preferences disproportionately choose careers in government. It may also be that employment itself shapes political attitudes over time. Most likely, both factors are at work.
Yet the findings are notable because they connect to several of the most important debates in contemporary Canadian politics.
For years, political scientists have understood Canadian politics through the lenses of region, language, class, and ideology. The paper suggests that the employment sector deserves a place on that list. Public- and private-sector workers increasingly appear to constitute distinct political constituencies with different interests, incentives, and policy preferences.
Readers of The Hub will recognize this theme. We’ve explored it previously in debates over the public-sector compensation premium, work-from-home policies, pension arrangements, and government workforce growth.
What often appears on the surface as a dispute about pay, workplace flexibility, or management practices can reflect a deeper divide between those whose livelihoods depend primarily on government spending and those whose livelihoods are more directly exposed to market forces.
This helps explain why debates over government spending, regulation, taxation, and public-sector compensation often feel so contentious. They’re not merely ideological disagreements. They increasingly involve groups whose livelihoods are tied to different parts of the economy.

The findings also resonate with insights from public choice economics, which emphasizes that political actors respond to incentives just as market actors do. The point of course isn’t that public servants are uniquely self-interested. It’s that the interests of those who depend primarily on public budgets may not always align with those whose livelihoods depend on competitive markets, entrepreneurship, investment, and business formation.
Recent controversies over public-sector work-from-home policies offer a useful example. What began as a debate about workplace flexibility quickly became a broader argument about accountability, productivity, and the obligations associated with taxpayer-funded employment. Beneath the surface lay competing assumptions about the role and purpose of public institutions themselves.
None of this means that public- and private-sector workers are destined to be political opponents. But as government employment grows and public spending occupies an ever-larger share of economic activity, the divide identified in this paper may become increasingly important for understanding Canadian politics.
Where one earns a paycheque may not determine one’s political views. But it appears to matter more than many observers once assumed.
1
306
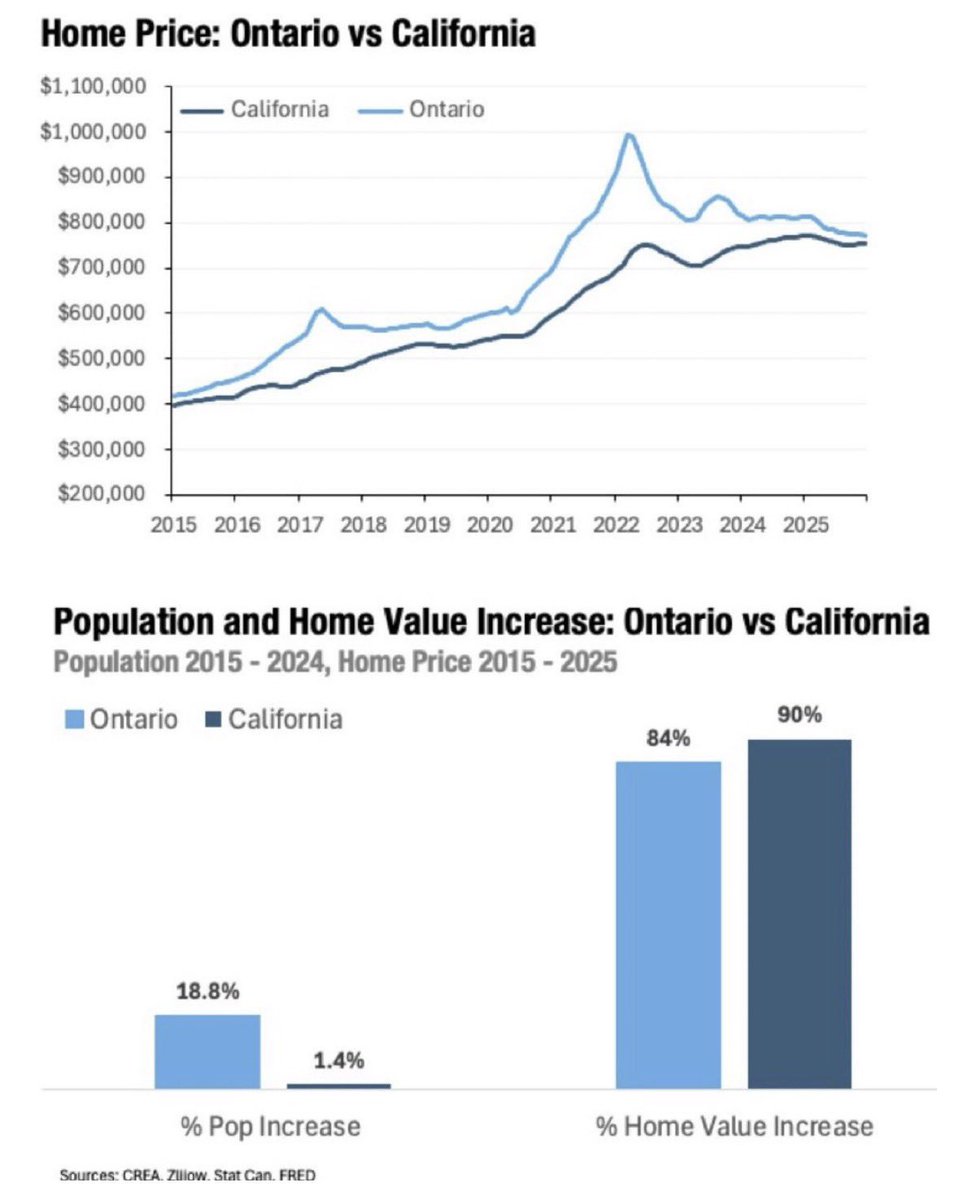
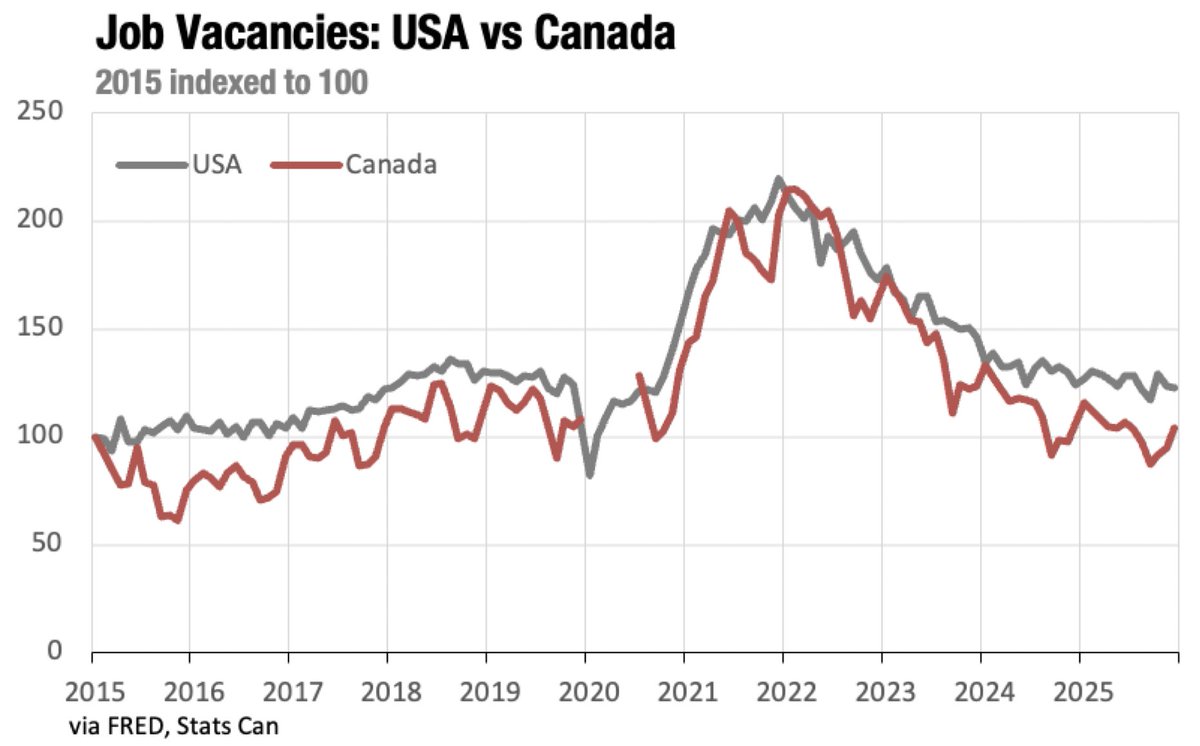
Actually COVID and the international response to it created all the problems... from home price change, rents, labour market tightness followed by labour market looseness. We will feel the ripple effects for years.
But good to see rents back into affordability territory.


3
1
5
1,251
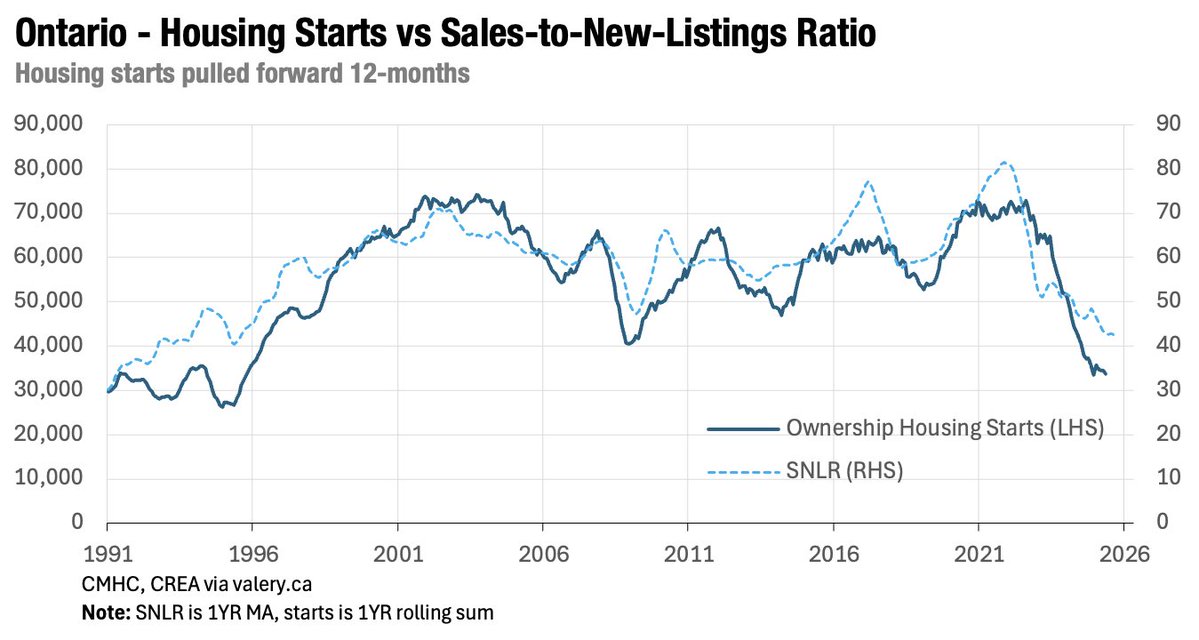
If you want to sound smart when advising policymakers or folks involved in the housing space, talk to them about the sales-to-new-listings ratio.
It tells you what you need to about resale market tightness, price, and will foreshadow strength of housing supply response.
Jun 13

At a national level, Canada is the closest we've been to a buyers market since the Global Financial Crisis

2
7
1,438
Vote Conservative!
They know this and will tell it to you straight.

Stephen Gordon, economist, Laval: "This is *so* dumb. If grocery stores really had market power to speak of, they wouldn't settle for the razor-thin margins they have now.
What the hell is Carney playing at?"
Note: ave grocery margins (not cosmetics, household essentials, pet care, pharmacy items etc) is typically 2.5% to 3.5%.
PS Reminder - PM Carney doesn't grocery shop -
Leaders Debate "I'm not one who deals with the food shopping at the house"
300
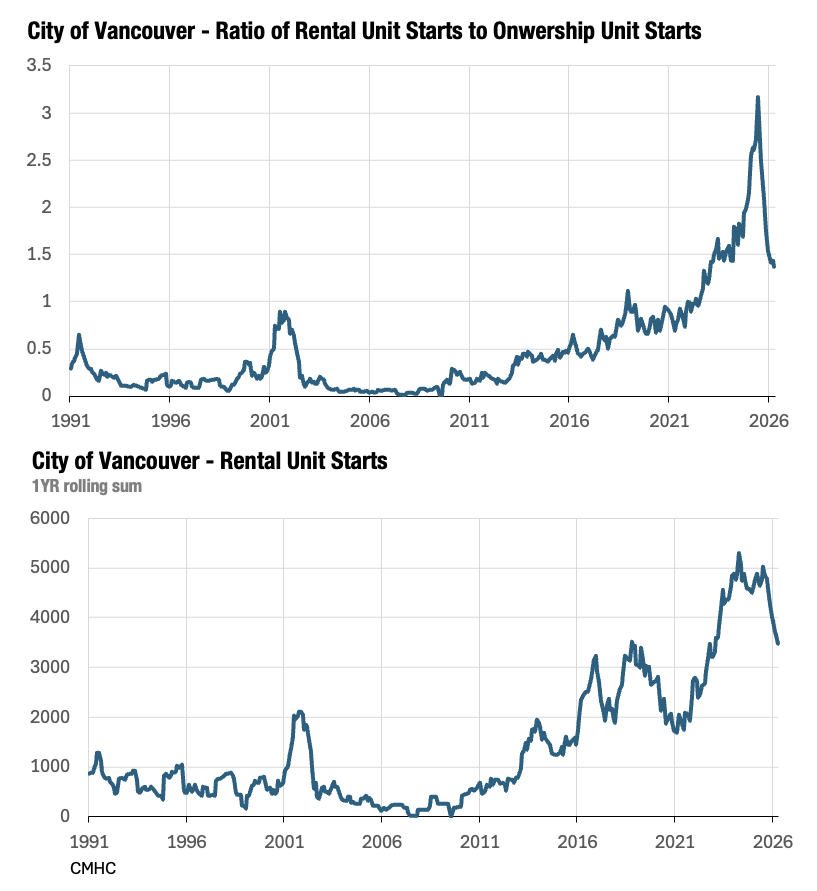
For folks interested on latest rental housing production data for the City of Vancouver, couple charts for you.
I would attribute slowdown on rents falling, vacancies rising and population growth taking a big breather.
But I could be wrong.

The tweet was rent-to-income, not home price, which another thing altogether.
This includes data post-2020.
Rents track wages. Home prices will detach from income based on interest rate environment and how strong animal spirits.
Supply moves on home resale price signals.
1
292
The tweet was rent-to-income, not home price, which another thing altogether.
This includes data post-2020.
Rents track wages. Home prices will detach from income based on interest rate environment and how strong animal spirits.
Supply moves on home resale price signals.


3
4
1,666
FYI people...
Note the piece's date. Well ahead of the curve...
Since 2020, everyone somehow became a zoning, building code, tax, municipal finance, demographics and housing supply expert.
Follow Cameron instead of getting all bent out of shape.
1
391
Also read👇
x.com/AzizSunderji/status/20…
Jun 11
Reminder: even when people make more money, unless they climb the income *ranking*, their % income spent on housing stays constant

334
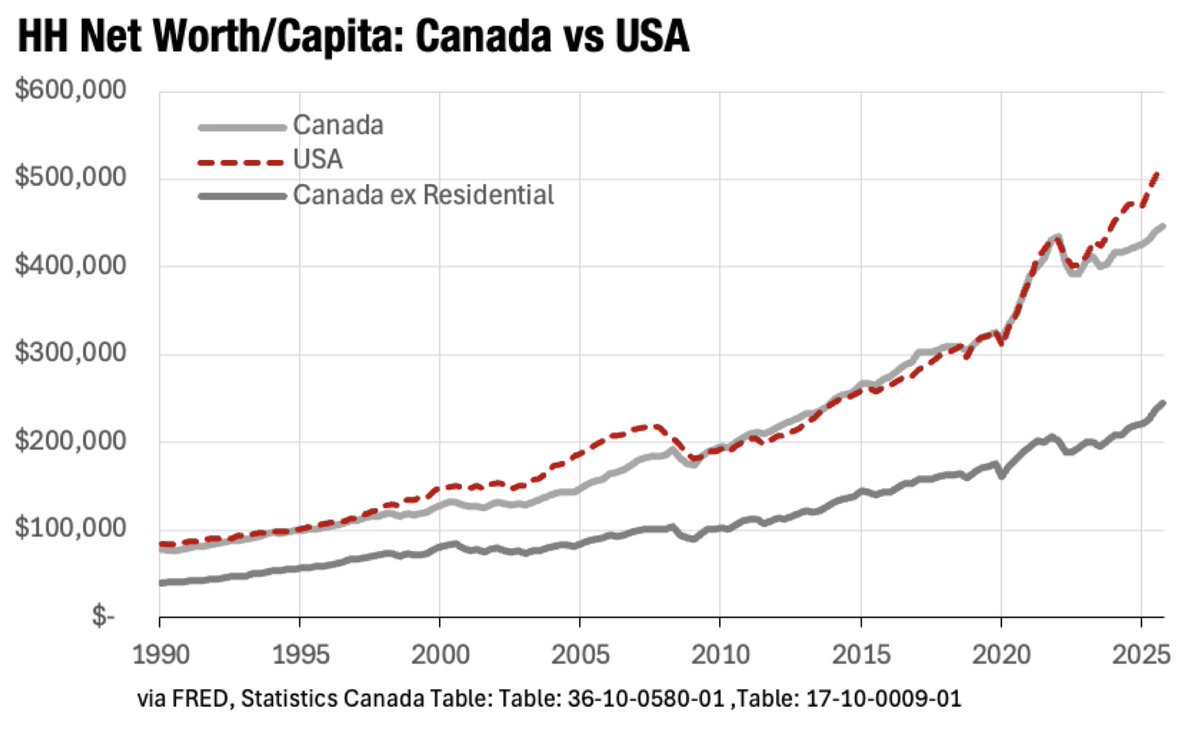
Reminder that productivity is a terrible measure of wealth, that pensions are included in wealth measures across all countries and that while more wealth is captured in homes in Canada vs USA, Canada's house wealth has stabilized to long term average.
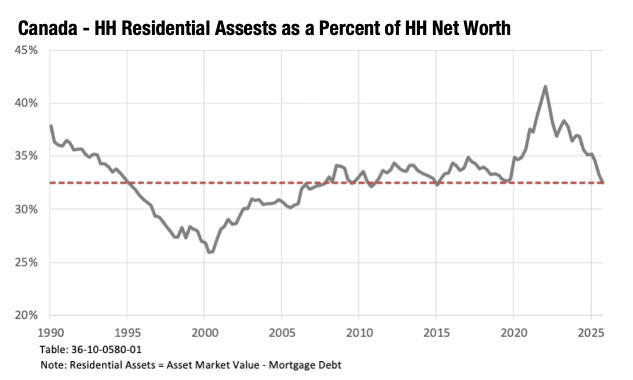

An annual reminder that median wealth is a very bad measure of either living standards or productivity. It largely reflects the housing market (including prevalence of rentals) and the country's pension system (whether it's recorded as a form of wealth)
1
1
8
1,218
Here are homeownership rates in Canada, USA and California.
I predict in the next census Canada's rate will drop some but not by much.


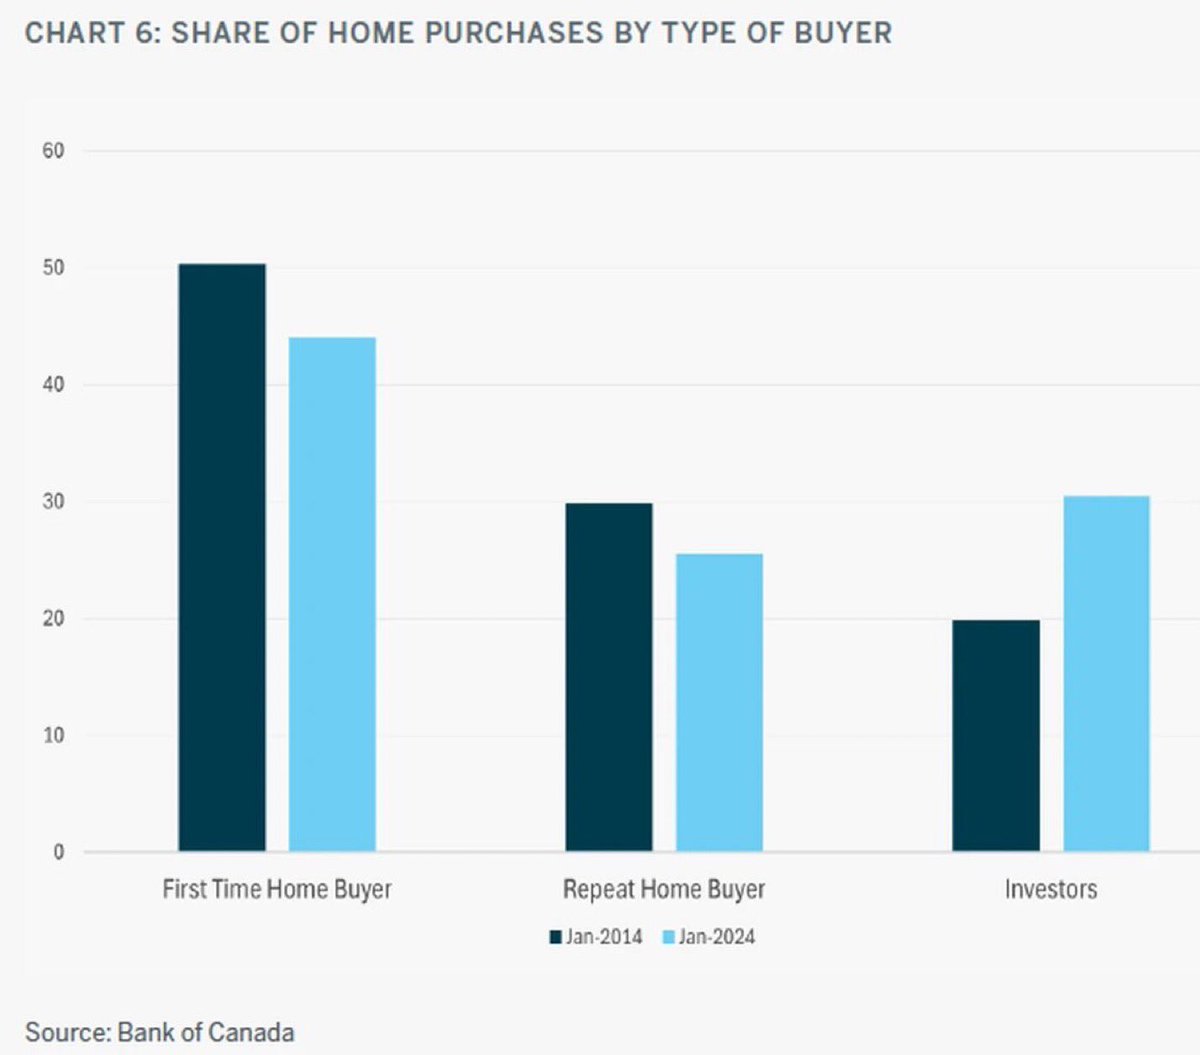
Much more than Real Estate agents or developers is investors that really profit. In Toronto & Vancouver we’re pushing 50% of homes are investor owned.
Caused a decade of almost no growth while home prices went sky high! 🤦♂️


4
1
3
2,119
