
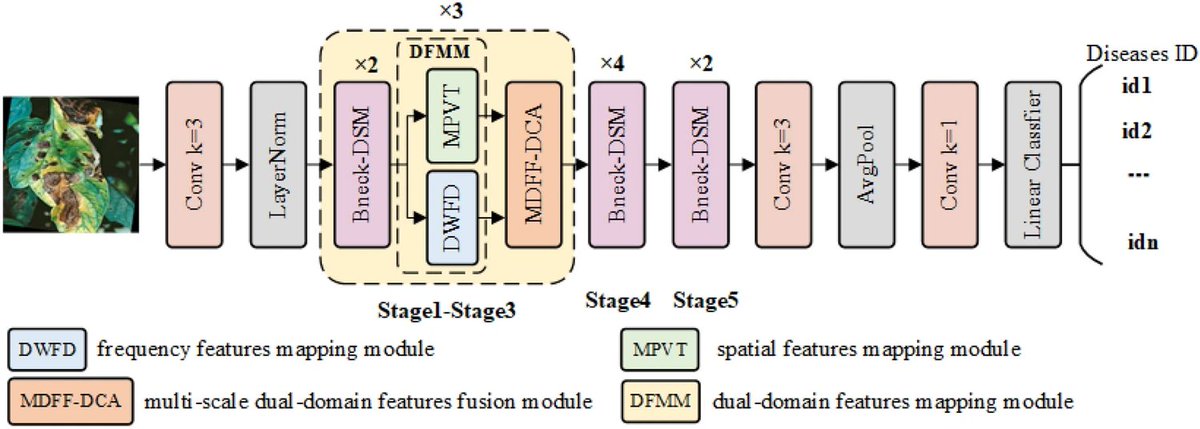
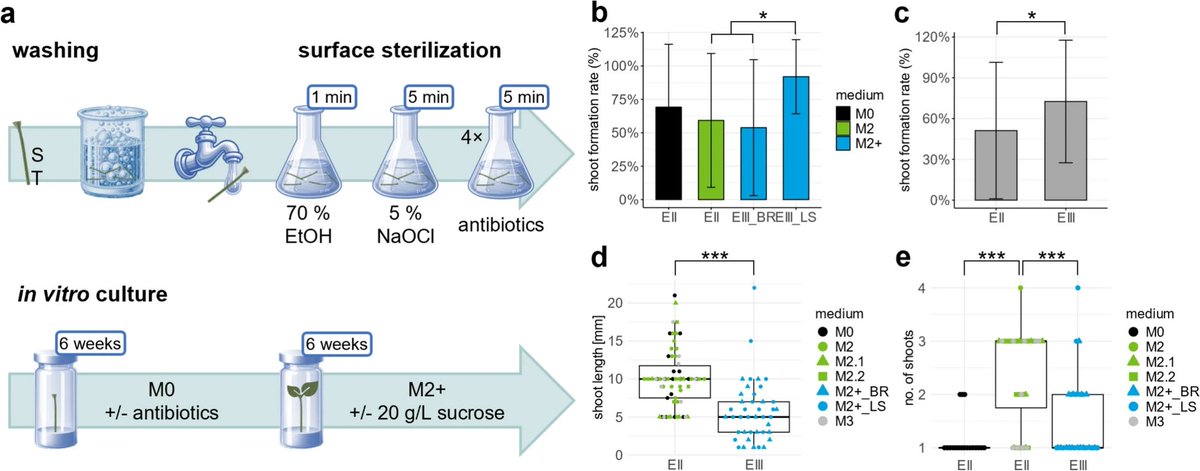
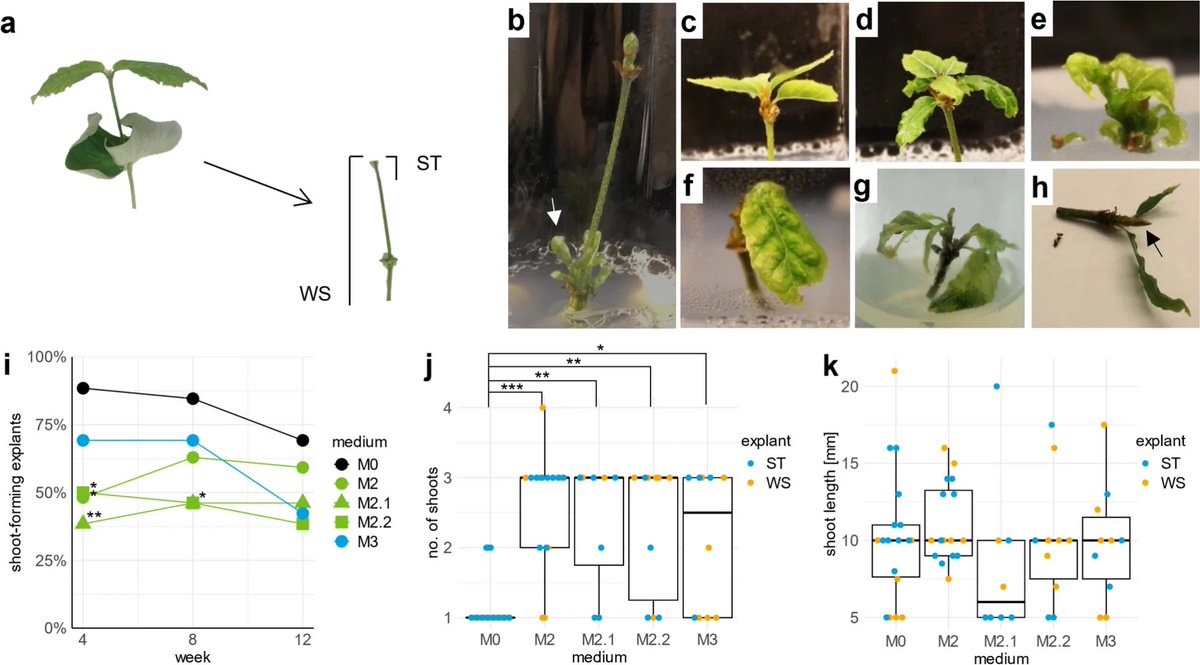
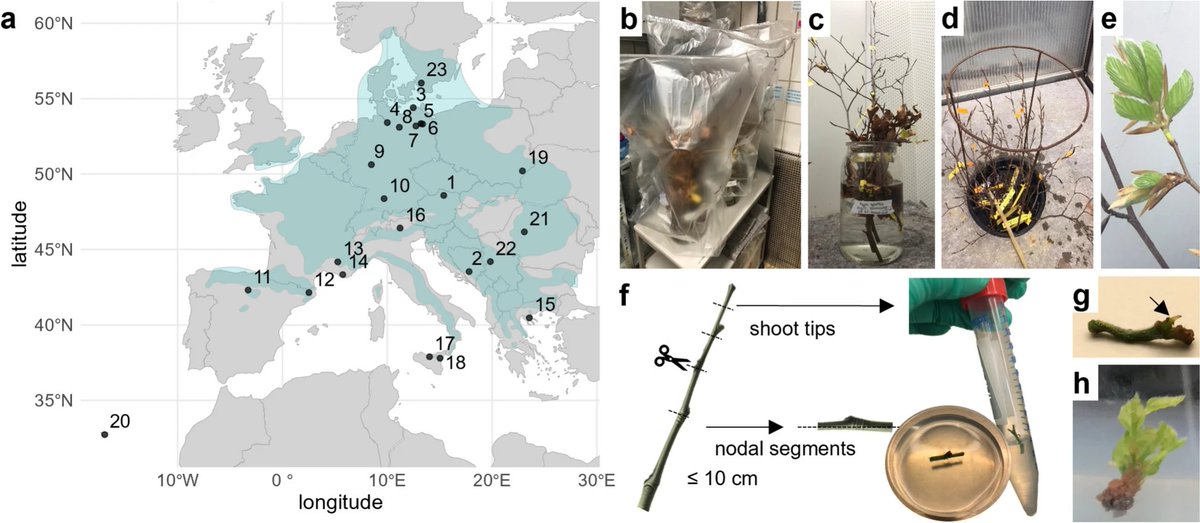
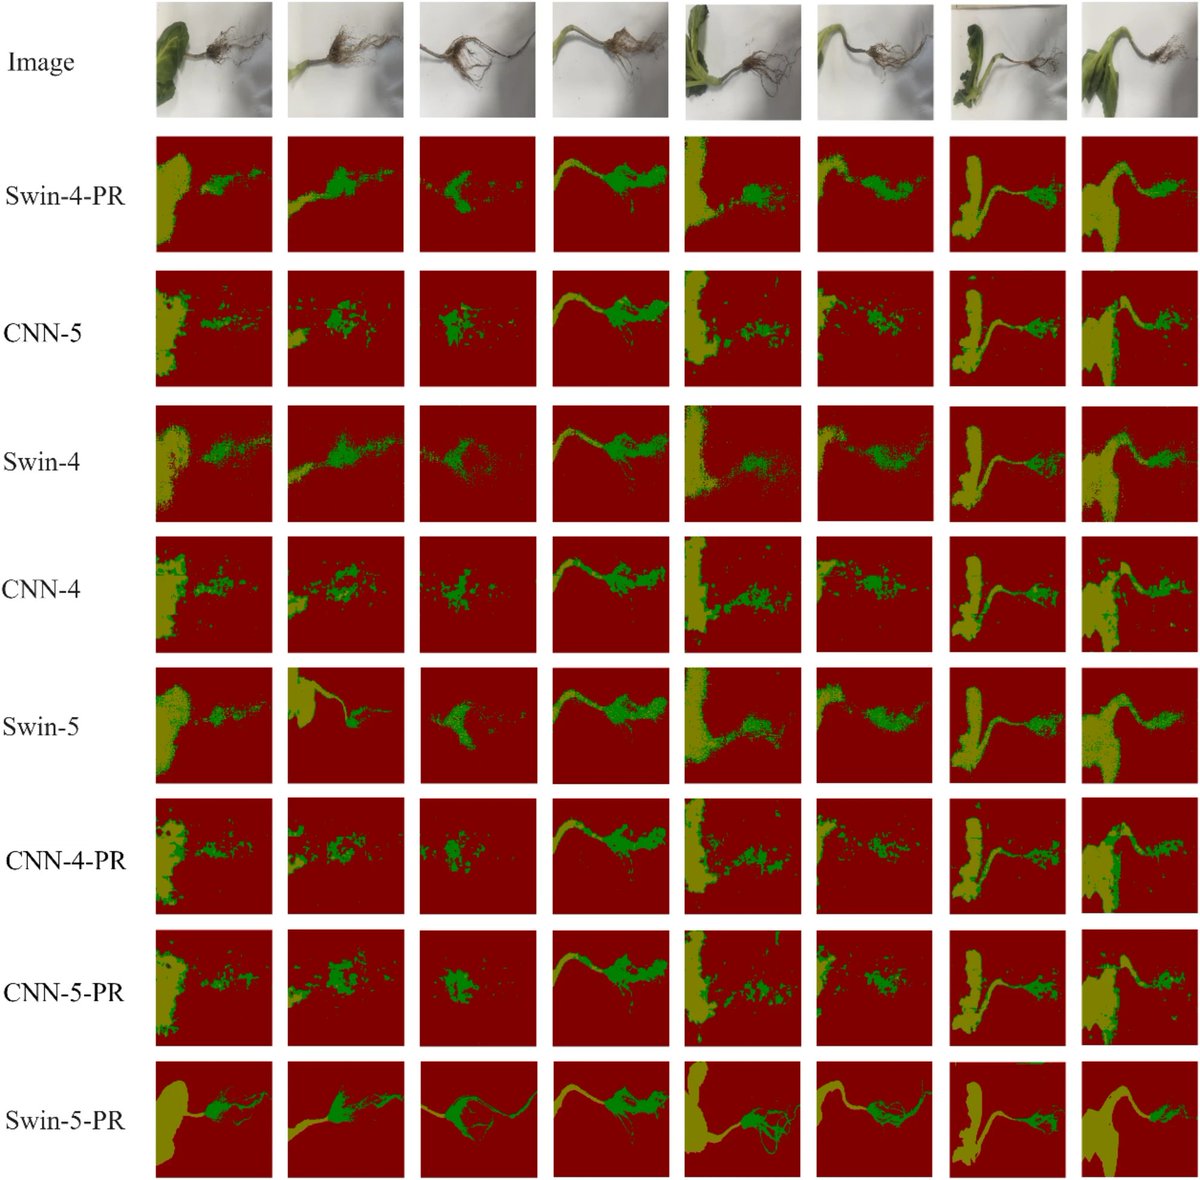
Plant Methods is an #openaccess journal for the plant community that encompasses all aspects of technological innovation in the plant sciences. #plants #science
- Tweets 2,463
- Following 193
- Followers 13,082
- Likes 25


ALT Determination of total leaf area. a The scale of the image was set against the ruler; the green channel of the image was used and then a filter applied to help smooth the background. b Leaves of one plant were cropped out for analysis. c The image was thresholded. d A mask was made of the thresholded image, removing any particles less than 1 mm in size; the masked image was then summarised, giving the total area. This analysis was performed in FIJI [26]. The corresponding code for each stage is shown to the right of the images
ALT Images of experimental materials, equipment, and methods. Sampled strawberry flower before exposure to VPD conditions (a), stamen types of strawberry flower: short (S), medium (M), and tall (T) (b), before anther dehiscence (c), the projected area of anther (blue line) and pollen clump (red line) after anther dehiscence (d), flower affixed onto the axis of the shaker (e), vibration equipment (f), camera for photographs before and after vibration treatments (g), the projected area of anther and pollen clump (blue line) before vibration treatment (h), the projected area of anther and pollen clump (red line) after vibration treatment (i), flower pistils before vibration treatment (j), and flower pistils after vibration treatment (k)
ALT Example of a plant top (a) and side (c) views and their 3D point clouds recorded with the 3D cameras at top (b) and side (d) views. The point cloud surfaces reconstructed by Alpha shapes algorithm with the alpha parameters 0.2 (e) with a sectional view (f) and Ball Pivoting algorithm with the ball radius 5 cm (g) with a sectional view (h), and with the Vacuum package algorithm (i) with a sectional view (j)
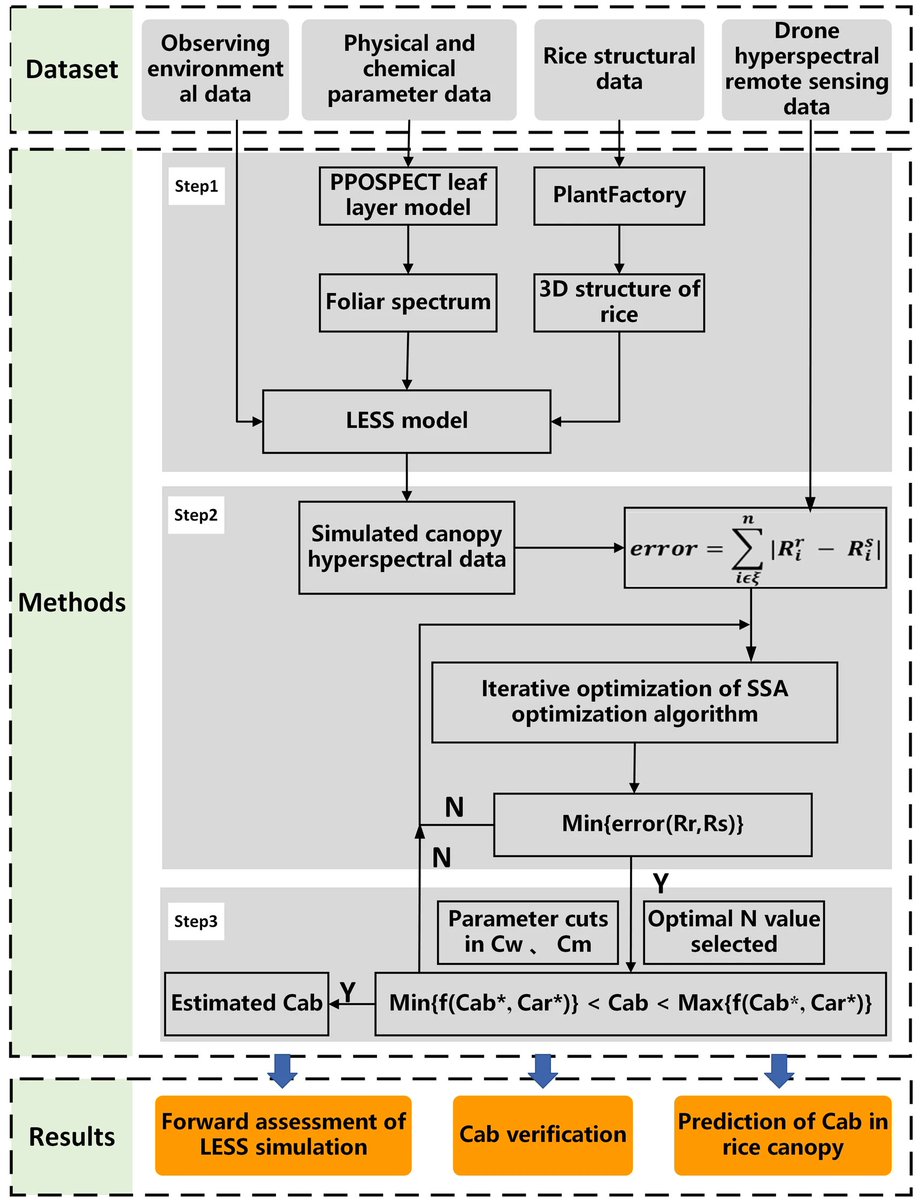
ALT Strategy flowchart for estimating Cab using a joint inversion model
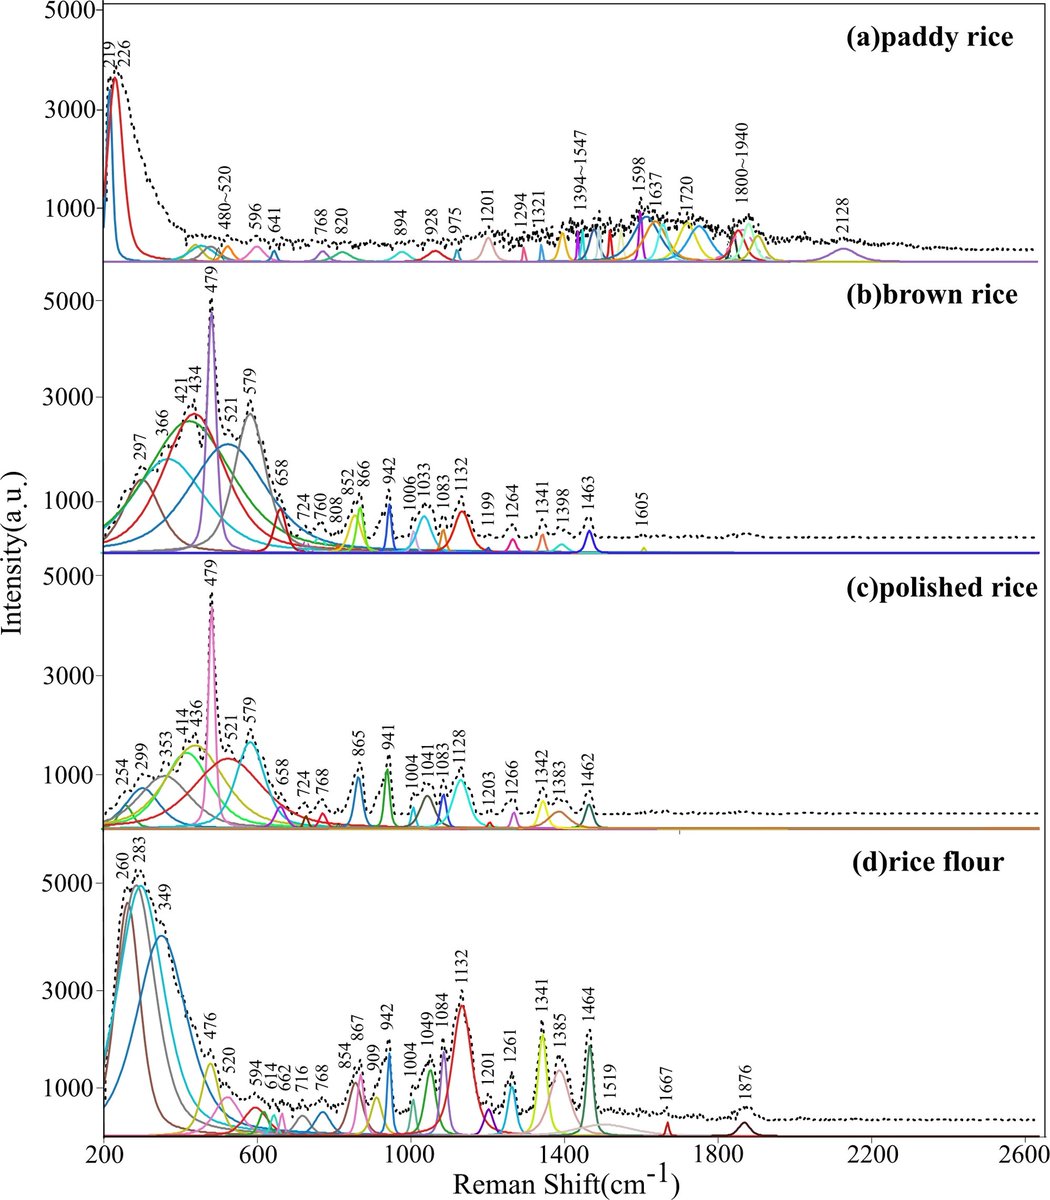
ALT Characteristic Raman spectral peaks assigned to four sample types. (a)paddy rice, (b)brown rice, (c)polished rice, (d)rice flour. The dotted line represents the average spectral profile across 20 varieties of each sample type, the solid lines depict individual characteristic peaks post-peak identification. The numbers accompanying the peaks indicate the Raman shifts. Different colors represent the characteristic peaks at different positions obtained after peak searching operation of the NGSLabSpe software