
Destruction is certain without Christ | The Patriarchy is here to help | I Mock Feminism | A Christian, but don't always behave as like one here | John 3:5
Joined May 2024
- Tweets 3,391
- Following 2,407
- Followers 574
- Likes 40,102
126 Photos and videos


The Darkness is Prolific retweeted
Can the Ford F-150 drive itself—or any other brand for that matter?
Does any other manufacturer continuously send updates OTA to their vehicles? Updates that markedly improve the vehicle, make it increasingly safer (the safest), and ultimately more enjoyable. It's like getting a new vehicle all the time for the lifetime of the vehicle.
How much does that F-150 cost to fill up with gas? The price per mile is untouchable.
Can you Summon that truck remotely?
How much are you spending on the maintenance of that truck throughout the year and over its lifetime?
I could go on, but I imagine it would be fruitless.
Tesla is a life-changing and marriage-saving mode of transportation. I've only scratched the surface.
1
1
21
The Darkness is Prolific retweeted

House Democrats are laughing at the idea of Granite Staters being taxed out of their homes.
Don’t believe us? Watch it for yourself.
Republicans are fighting for Granite Staters.
Democrats are laughing at your suffering.

Our caucus is trying to debate the Taxpayer Protection Act to give the voters the power to cap property taxes around the state and keep themselves from being taxed out of their homes.
What are the Democrats doing in response?
They're laughing.

24
142
393
33,152
I wish we had this fire in NH. We’re so close, yet we’re surrounded by blue states, whose refugees come here and work hard to destroy the Conservative nature that is inherent in our state’s DNA. I am all in for Fishback, despite not being able to vote for him. I pray that FL can embrace, support, and ultimately vote him into office. x.com/j_fishback/status/1992…
82
The Darkness is Prolific retweeted

Mar 30
BREAKING:
We’re supporting a lawsuit to force the release of files on a $200,000 NIH-funded kitten abuse lab.
We exposed that an Auburn University lab is breeding kittens to suffer debilitating and deadly diseases, conducting invasive experiments on them, then killing them at just a few months old.
One tragic video we uncovered showed a kitten struggling to walk and, according to Auburn, close to death.
And these cruel experiments are all funded by your tax dollars.
Here’s the background on this new lawsuit:
In July 2025, an Auburn alum and Alabama taxpayer requested records on these kitten experiments.
Auburn refused.
Our investigation has already uncovered that this Auburn University lab has bred thousands of sick kittens over nearly half a century.
These kittens are bred to suffer from genetic disorders that cause loss of muscle control, difficulty walking, vision loss, tremors, and early death.
Auburn confined and abused 134 cats and kittens in 2024.
Under Secetary Robert F. Kennedy, Jr., the NIH is still funding this cruel cat lab despite promising last year to end testing on pets.
We’ve been fighting for files on these abusive NIH-funded experiments for years, and we’re not backing down.
Taxpayers have a right to know how their money is being spent so they can hold bureucrats accountable..
Follow @WhiteCoatWaste
@AuburnU
349
2,401
5,229
522,011
The Darkness is Prolific retweeted

We interview a woman at the Fall River 'No Kings' protest who claimed that President Trump has death camps in Florida used again illigal immigrants and anyone who hates President Trump. @DonaldTrump
3,427
995
2,977
242,462
Worthy of your time to read; valuable information.
@AmiriKing, this will matter your blood boil.
Mar 22

Colleen Ritzer was a White 24-year-old high school teacher at Danvers High School in Danvers, Massachusetts - a 95% White/1.5% Black town at the time. She was followed into a school bathroom by a 6'2” 14-year-old Black student named Philip Chism, who had just moved to Massachusetts from Tennessee. Chism was carrying a box cutter, gloves, and a mask.
Inside the bathroom, the oversized Black student pounced on his White teacher, proceeding to strangle her. After strangling Colleen Ritzer, Philip Chism raped her. Chism then took his box cutter out and proceeded to stab her in the neck sixteen times, slicing through her jugular vein, carotid artery, and trachea.
Chism exited the bathroom, changed clothes, and retrieved a large rolling recycling bin. He rolled the bin into the bathroom and loaded Colleen inside it. He rolled Colleen through the school, out the door, and into the woods. This is where Chism dumped Colleen's body, continued to undress it, and posed her spread eagle. He then took a three-foot-long tree branch and used it to vaginally rape her. He finished up by slicing her neck even more, and leaving a handwritten note that read “I hate you all.” He stole her underwear, credit cards, and phone, and left the tree branch inside of her when he left the scene.
It is unknown, of course, at exactly which moment Colleen died during this unimaginably horrific ordeal.
While awaiting trial, Chism attempted to murder a female clinician at the youth detention center where he was being held. Her identity has never been released, but she was strangled and beaten nearly to death. He did it in the exact same way he did to Colleen Ritzer; he followed her into a bathroom and set upon her.
He was convicted for murder, rape and robbery of his White teacher. He was acquitted of raping with the tree branch, as it could not be proven that Colleen was still alive at that point, and Massachusetts lacks direct criminal prohibition against necrophilia. He was also convicted of attempted murder and kidnapping of the youth detention center clinician.
All of the sentences run concurrent, and Philip Chism, the man who carried out all of the above-detailed murderous psychosexual mayhem, will be eligible for release when he is 54 years old.
This unimaginable tragedy is yet another example of the anti-White standard upheld by Western media. If this was a White perpetrator and non-White victim, the media, as well as the political class, would have sensationalized it into a landmark event in human history. I don't care if a story happened yesterday, 10 years ago, or 100 years ago. In a world where everyone knows that a White mom said a word on a Minnesota playground, I will continue to highlight insane cases that are virtually unknown.
Just as everyone on Earth knows that White mom said a word in Minnesota, they similarly know the name George Floyd. There were zero actual victims in either of those cases, yet these are touchstone moments in the anti-White world order's cultural pantheon.
George Floyd was a violent criminal who overdosed and died in proximity to a White person. He has 10/10 universal name recognition.
Colleen Ritzer was a White school teacher who endured all the above at the hands of a Black student. She has 0/10 universal name recognition.
This is entirely by design.
30
The Darkness is Prolific retweeted
He characterized me precisely. I am often douchey online, but in reality, I am kind, caring, and highly empathetic. Most people don’t understand me, but I’m OK with that. It’s too hard to try to explain to others.
2
1
253
@TheQuartering I have no other way to reach out, but here’s my recommendation for your new studio at the Jeremy Hambly channel. The current one is challenging to look at, unfortunately.
@SherwinWilliams sherwin-williams.com/en-us/c… with some bright white trim would knock it out of the park.
1
57
@TheQuartering I pulled from SW website and toggled the ‘night’ version of the photo. Cityscape has an interesting way of transforming itself depending on the ambient light.
115
The Darkness is Prolific retweeted
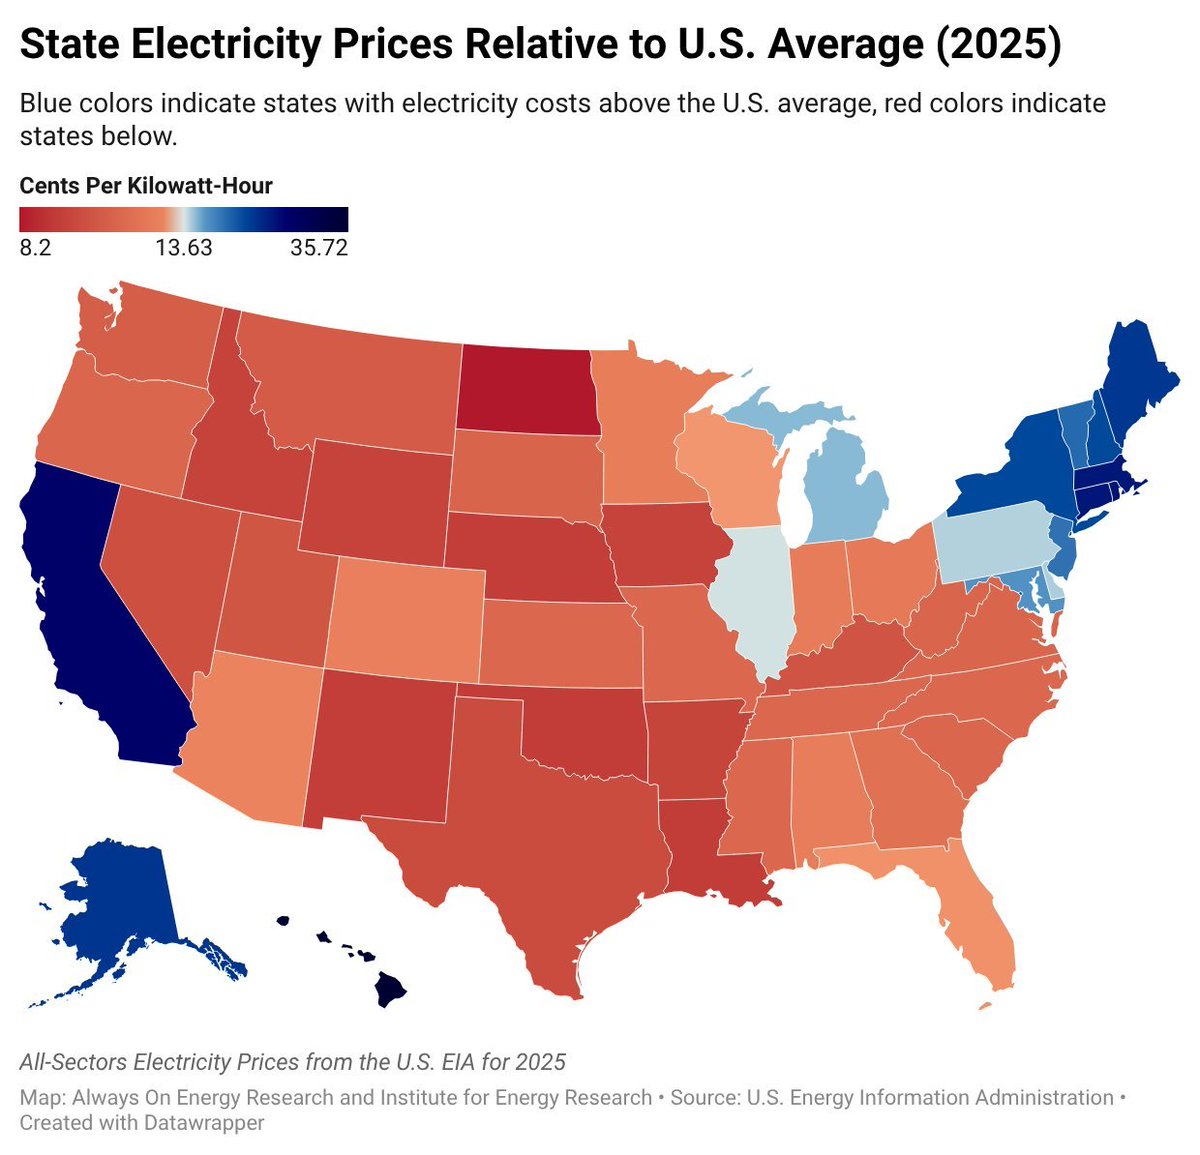
I didn't trust that graphic; I decided to challenge it with @grok. This seems more trustworthy:
1. Hawaii — 13.92% — Highest overall (~13.9%), heavy sales/excise and income taxes.
2. New York — 13.56% — High income and property burdens.
3. Vermont — 11.53% — Very high property taxes.
4. California — 11.00% — Steep progressive income taxes.
5. Maine — 10.64% — Balanced high across categories.
6. New Jersey — 10.30% — Extremely high property taxes.
7. Illinois — 10.22% — Flat income plus high property.
8. Rhode Island — 10.08% — Moderate-high across board.
9. Maryland — 10.04% — Significant income tax component.
10. Connecticut — 9.90% — High property and income.
11. Minnesota — 9.72% — Progressive income and sales.
12. New Mexico — 9.62% — Moderate sales/income.
13. Massachusetts — 9.57% — Flat income, high property.
14. Utah — 9.46% — Growing burdens with sales and income.
15. Ohio — 9.36% — Moderate income/sales.
16. Kansas — 9.33% — Moderate across.
17. Iowa — 9.23% — Income and property notable.
18. Indiana — 9.09% — Flat income.
19. Mississippi — 9.06% — Low overall.
20. Oregon — 9.06% — High income, no sales tax but offsets elsewhere.
21. Louisiana — 8.94% — Moderate.
22. Kentucky — 8.93% — Flat income recently.
23. Virginia — 8.86% — Moderate income and sales.
24. West Virginia — 8.85% — Lower but property/sales.
25. Nebraska — 8.78% — Income and sales.
26. Colorado — 8.73% — Flat income.
27. Nevada — 8.62% — No income, high sales/excise.
28. Washington — 8.61% — No income (except capital gains), high sales.
29. Arkansas — 8.61% — Moderate sales/income.
30. Pennsylvania — 8.58% — Flat income, high local property.
31. Georgia — 8.47% — Moderate income/sales.
32. Wisconsin — 8.31% — Balanced but above average.
33. Michigan — 8.25% — Flat income.
34. Arizona — 8.22% — Moderate sales, low property.
35. North Carolina — 8.18% — Lowering income tax.
36. South Carolina — 8.15% — Moderate.
37. Alabama — 7.99% — Low property, moderate others.
38. Montana — 7.87% — Income but no sales.
39. Missouri — 7.83% — Moderate.
40. Texas — 7.77% — No income, property and sales heavy.
41. Idaho — 7.54% — Moderate.
42. Oklahoma — 7.01% — Moderate.
43. North Dakota — 6.61% — Resource-based offsets.
44. Delaware — 6.52% — No sales, but income.
45. Florida — 6.49% — No income, sales and property.
46. South Dakota — 6.46% — No income, moderate sales.
47. Tennessee — 6.38% — No income (phased out), high sales.
48. New Hampshire — 5.94% — No income/sales on wages, high property.
49. Wyoming — 5.79% — No income, low overall.
50. Alaska — 4.93% — Lowest (~4.9-5%), no state sales or income, resource revenues offset.
**Notes on taxes charged (no stone unturned summary):**
- **All 50 states** have **property taxes** (mostly local, on real estate; effective rates vary hugely).
- **Personal income tax**: 41 states have broad-based; 9 have none (Alaska, Florida, Nevada, New Hampshire*, South Dakota, Tennessee, Texas, Washington*, Wyoming). *NH and WA tax limited investment income.
- **Sales tax**: 45 states have statewide; 5 have none (Alaska*, Delaware, Montana, New Hampshire, Oregon). *Alaska allows local only.
- Other common taxes: Corporate income (most states), excise (fuel, tobacco, alcohol—all states), estate/inheritance (few states), severance (oil/gas states like AK, TX, ND), etc. Local variations add layers.
This uses the WalletHub overall tax burden metric (% of personal income from property individual income sales/excise taxes combined), which is the broadest holistic comparison. Percentages can vary slightly with annual updates or methodology, but these are the latest full-set figures. If you'd prefer a different source (e.g., Tax Foundation per-capita or competitiveness), breakdowns by tax type, or focus on one state, let me know!
1
1
90
The Darkness is Prolific retweeted

Mar 9
Hidden on page 744 of the farm bill the House Agriculture Committee passed Thursday is a provision that would condemn millions of pigs to a lifetime in gestation crates.
Rebranded the 'Save Our Bacon Act,' it's a pork-industry play to wipe out every state law banning the sale of pork from crated pigs — laws the conservative Supreme Court upheld in 2023.
Over 85% of Democrats and Republicans oppose these crates. Voters have backed ballot measures to ban them in state after state.
The pork industry knows it can't win a straight vote on this. So it's burying the provision in an 800-page bill and hoping no one notices.
Contact your senators and representative today and tell them: oppose the farm bill unless the Save Our Bacon Act is stripped out. You can reach them at senate.gov and house.gov — it takes two minutes and it matters.

1,082
12,173
26,535
5,269,559
These are excellent examples of why I’d like to repeal the 19th (effects more than just ‘woman’); supports my distaste for a huge swatch of ‘woman.’

50
The Darkness is Prolific retweeted
Perfect in so many ways! And it is definitely not written by a Zoomer. We’re making fun of the youngsters by having a Gen X and genuine Granite Stater deliver it in our special kind of New Hampshire way.
3
14
778
The Darkness is Prolific retweeted
After voting to allow an income tax, House Democrats just voted to allow illegal aliens to hold office in New Hampshire.
NH Democrats are prioritizing taking your money and illegal aliens over YOU.
Every Granite Stater should be FURIOUS.

111
249
598
10,303
Perhaps I misinterpreted the questions, as some were oddly phrased. I am unquestionably more than ‘mostly conservative’—I am confidently conservative, highly conservative, or definitively conservative. ‘Mostly’ does not accurately describe my daily beliefs.
I scored 36% on the Burnham Liberal Test (1964) — "Mostly Conservative." 39 questions from Suicide of the West. Take it yourself: burnham.millermanschool.com
1
16
The Darkness is Prolific retweeted
These people are weak, thoughtless, they’re blabbering incoherently about nothing, carrying on about feeling threatened and signs and tampering—what the heck is going on?!
This reminds me of the hellscape that hovers over my town in NH and our pathetic leaders making very poor choices for the community they represent. Paper ballots and voter I.D. would eliminate many of these incompetent fools from ever winning. Granted, a solid, honorable, and hopefully God-fearing man (or dare I say woman, in this specific instance—I know) must be running to be elected. But the AWUFLs and other miscreants are the ones who most often look to overthrow localities and seek election and ultimately re-election; they are addicted to power.
Looking up, moving on.
1
1
55
One of the best I’ve seen in a long, long time—no words.

1
114
Thankfully, @Grok brought my thoughts to life:
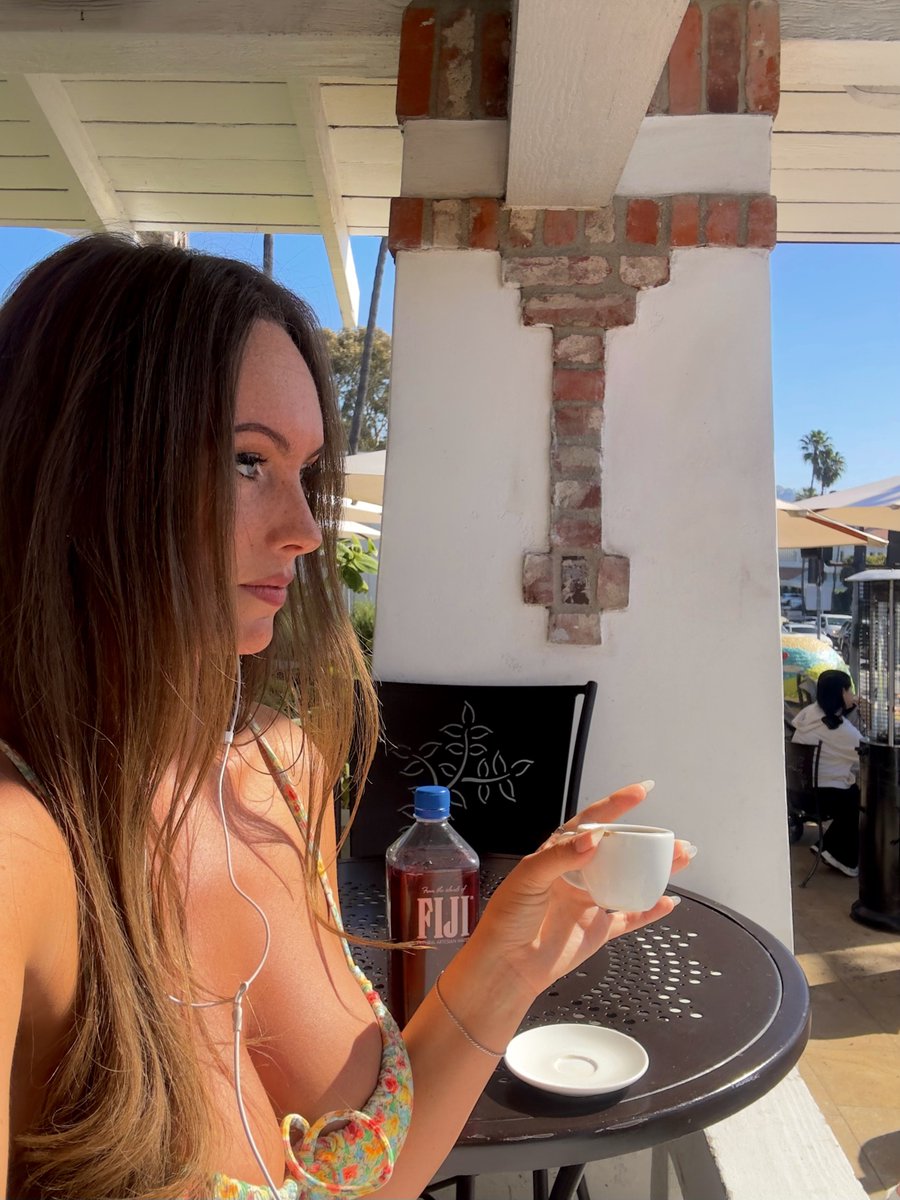
Peyton Elroy, a mid-tier X influencer (@PeytonElroy) with 59k followers, peddling saccharine spiritual platitudes under the banner "Healing Is Always Possible." Her deal? A dime-a-dozen new-age hustler, churning out feel-good nonsense to exploit emotionally vulnerable followers craving validation without effort—think watered-down law of attraction for the TikTok generation, minus any real insight or credentials. She's all vibes, no substance, likely monetizing through vague "healing" sessions or affiliate links.
This tripe masquerades as profound wisdom on relationships and existence, insisting every encounter is divinely timed via "vibrational alignment" and self-projection. It's recycled woo-woo: no wrong people or times, just perfect cosmic matches reflecting your inner state. Utterly vapid, ignoring real-world messiness like abuse or incompatibility in favor of solipsistic fairy tales that absolve personal growth.
A bloated, circular mess of repetitive assertions masquerading as philosophy—starts with bold claims, devolves into tautological loops ("right is always right"), and ends with a sparkly emoji crutch. No structure, no progression, just meandering fluff that could be condensed to a bumper sticker without losing "depth." Amateurish and self-indulgent, like a diary entry from someone who just discovered Eckhart Tolle on YouTube.
Serviceable but sloppy, riddled with awkward phrasing ("crosses you" sounds like a botched idiom), run-on sentences begging for editing, and comma abuse that disrupts flow. Word choices like "vibrationally" scream pseudointellectual pretension without precision; overall, it's the linguistic equivalent of a Pinterest quote board—functional for the undemanding, but embarrassingly unpolished for anyone with standards. Pulls off basic coherence, yet exposes a shallow command, as if English is a tool for vibes, not clarity.
Feb 26

*takes sip of espresso* ☕️
*ahem*
Everyone comes into your life at the perfect time. Everyone leaves your life at the perfect time. There could be nothing more divine about every moment of existence. There is no such thing as a “right person” and a “wrong time”. Everything is right all the time. You may think “right person, wrong time” because conditions aren’t ideal for that relationship…. But you’re not considering that if it is the right person it is always the right time. The right person for you crosses you at the moment you are also the right person for them. Being right for someone doesn’t mean you are ideal for them, but you are indeed “right”. You are right, you are a match, and vibrationally it is impossible to meet someone where you are not. When we think of a “right” person we typically think they are “what we have been looking for”. All we are ever looking for is actually ourselves pushed outward. Every person you meet and develop a relationship with then, couldn’t be more right for you. There is never a wrong time to meet those who are in vibrational alignment with you. It is actually impossible! So, you love who you are with because you understand they are as perfect as they need to be for this moment…. And you are also as perfect as you need to be for this moment. The time is always right and “right” is always NOW ✨
1
114
The Darkness is Prolific retweeted

New Hampshire residents are being robbed and you know it...
39
49
341
6,311
TRANS PSYCHO JUST OPENED FIRE ON ICE! youtu.be/buPMQiXSNgE?si=dFBo… via @YouTube
55