
Accountant | Data Analyst | Spreadsheets, Excel, SQL, Power BI, Tableau, Python | Pressing Data into Insights | Sharing projects & my analytics journey
Joined December 2025
- Tweets 347
- Following 112
- Followers 41
- Likes 983
131 Photos and videos


Pinned Tweet

6 Dec 2025
It’s Better to burn out than to fade away.
2
712
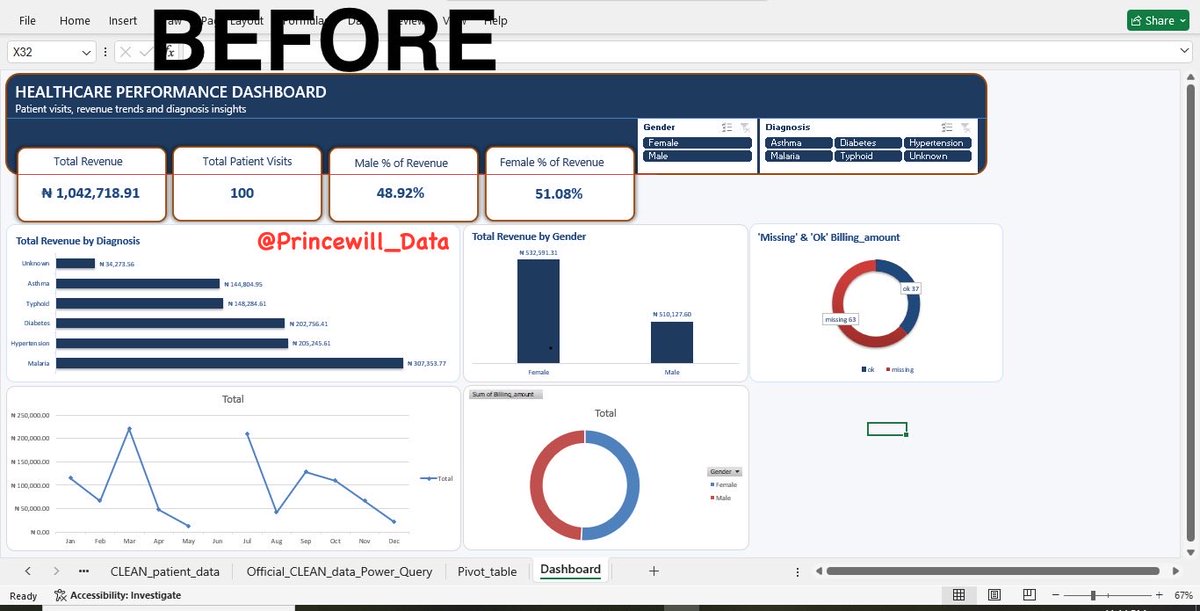
A common mistake in reporting is showing everything. More charts don't always mean more insight.
Sometimes a single KPI supported by the right visual tells a stronger story than an entire dashboard full of charts. #PressingData #DataAnalytics #DataVisualization #PowerBI #Excel
2
6
This picture makes data analysis look easy 😂. What it doesn't show are the hours spent cleaning data, fixing errors,switching between tools & questioning your life choices when something breaks. But that's (CONT⬇️) #PressingData #DataAnalytics #PowerBI #Excel #BuildingInPublic
2
5
55
the beauty of it.
Turning messy data into clear insights never gets old.
Hope you had a productive Friday.
The Data Press Guy
1
12
One thing I've learned from working with data: The quality of your insights depends on the quality of your questions. Today wasn't about dashboards or SQL. It was (CONT⬇️)
#PressingData #DataAnalytics #Research #CriticalThinking #DataDrivenDecisions #DataFam
Princewill_Data
1
1
13
about reviewing records and asking:
Who do they fund?
Where do they focus?
Do their actions match their mission?
Those questions helped separate real opportunities from good looking records. Data doesn't always provide answers. Sometimes it helps you ask better questions.
1
8
People 👀 the dashboard. They don’t see the hours spent cleaning data, fixing errors,testing formulas, building measures & figuring out why something isn’t working.
Data analytics looks simple when it’s finished😀. #PressingData #DataAnalytics #PowerBI #Excel
The Data Press Guy
5
48
A dataset can contain thousands of records but not every record is useful. Today involved filtering nonprofit data, validating records across multiple sources and enriching data with (CONT⬇️) #PressingData #DataAnalytics #DataAnalysis #Excel #DataResearch #DataDrivenDecisions
1
2
24
funding priorities and eligibility requirements.
The goal isn’t to collect more data.
The goal is to identify the right data.
That’s where better decisions start.
Princewill_Data | Pressing Data into Insights
2
15
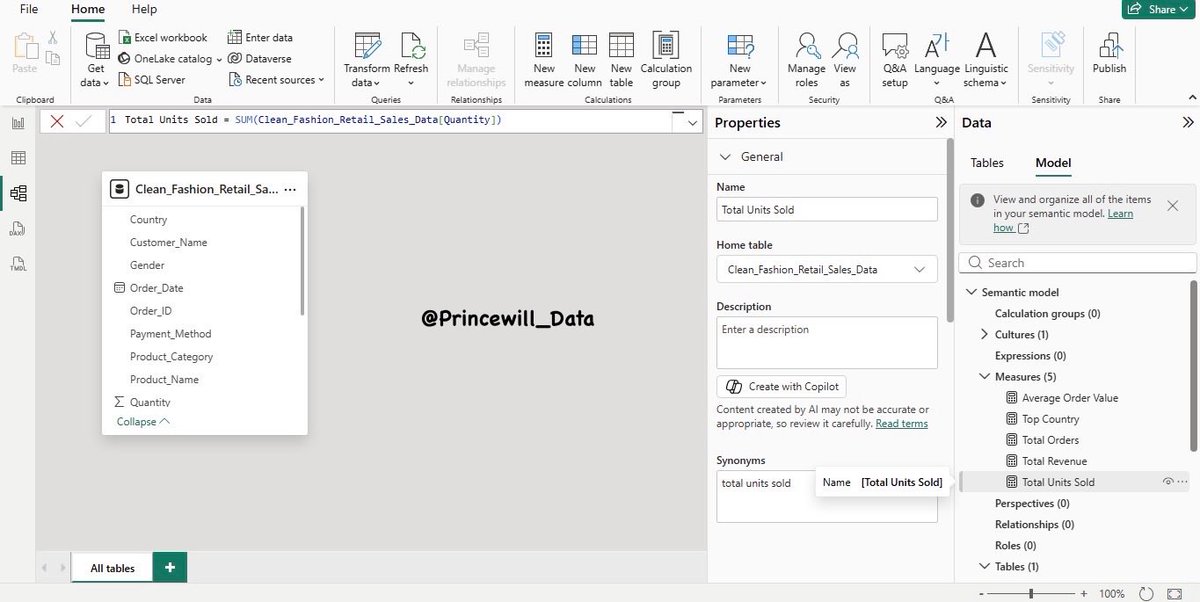
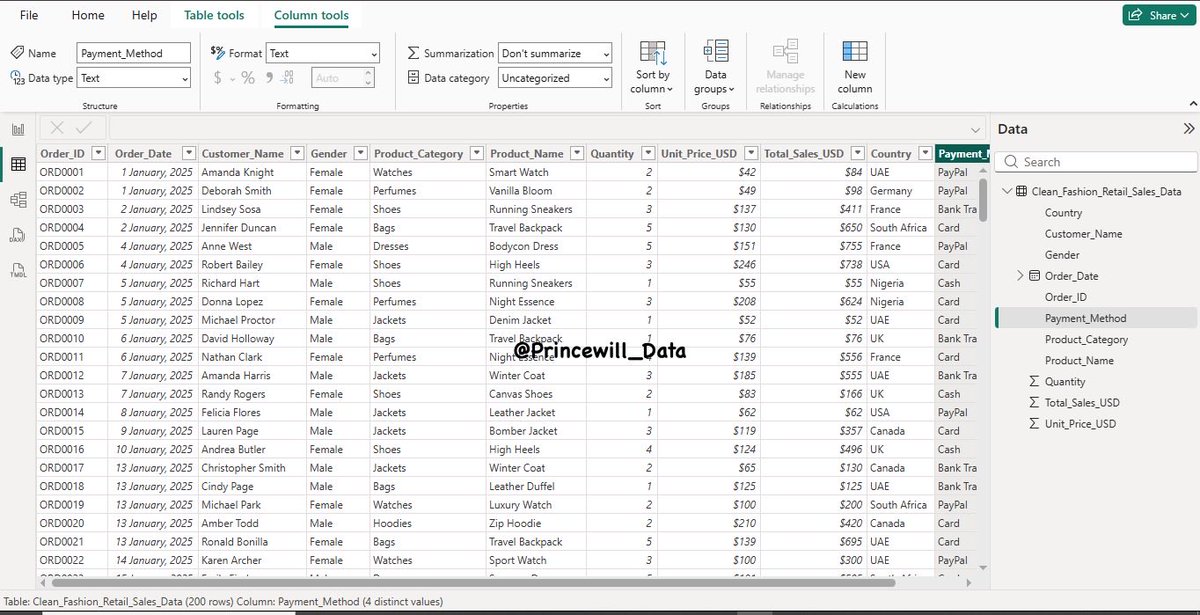
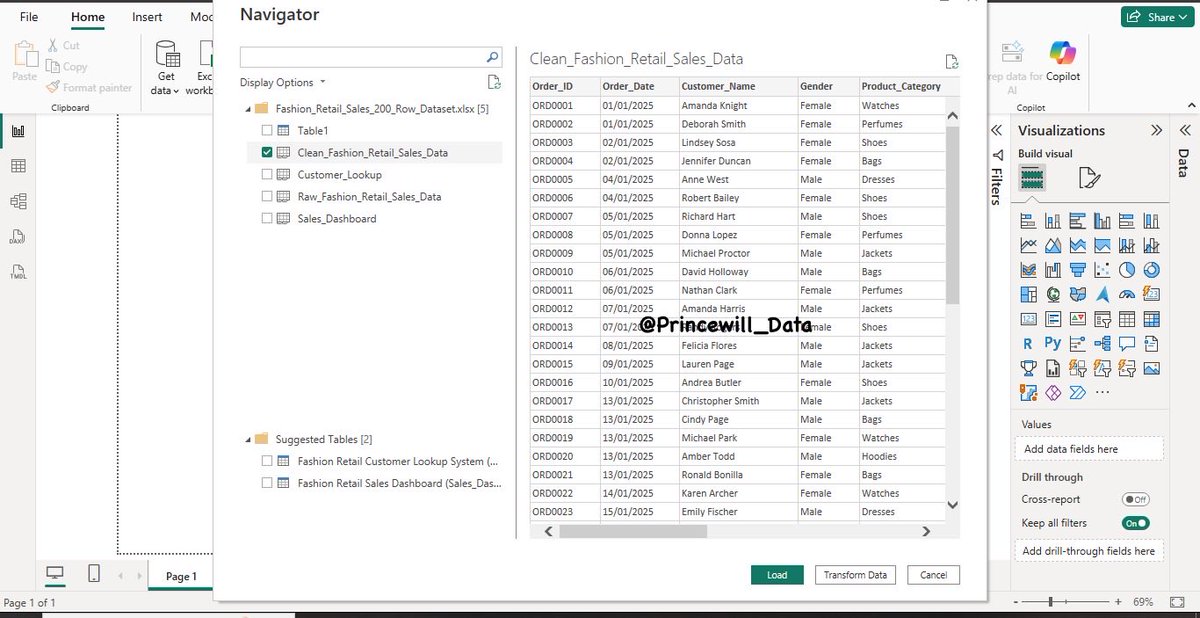
Completed my Fashion Retail Sales Dashboard in PowerBI. Simple design but focused on what matters most:clear insights, business performance and decision making.
From raw data (CONT⬇️)
#PressingData #DataAnalytics #PowerBI #Dashboard #DataVisualization #BuildingInPublic #Datafam
1
4
38
and cleaning to DAX measures and dashboard development, it's satisfying seeing the full analysis come together.
Every project teaches something new.
Princewill_Data | Pressing Data into Insights
1
26
Today’s analysis work involved exploring a large nonprofit dataset and learning how public records can help identify potential grant funders.
A reminder that data analysis isn’t (CONT⬇️) #PressingData #DataAnalytics #Excel #OpenData
1
2
38
always dashboards and charts. Sometimes the real work is finding, validating and organizing the right data first.
Princewill_Data | Pressing Data into Insights
2
32
One thing i appreciate more as i build dashboards isthe KPI card. Before it,you’re scrolling through rows, tables & pivot reports looking for answers. After it,no digging through tables. No scrolling through hundreds of rows. (CONT⬇️) #PressingData #DataAnalytics #PowerBI #Excel
1
2
27
Just KPI’s telling you exactly where the business stands. Total Revenue. Total Orders. Profit. Growth. The best dashboards don’t just show data. They show what matters first.
The Data Press Guy
1
12
Funny thing about Data Analytics.
You can spend 3hours building a dashboard then spend another 2hours moving charts around by a few pixels because"something doesn't feel right"😂
The data is correct.
The visuals work.
But your (CONT⬇️)#PressingData #DataAnalytics #PowerBI #Excel
2
7
78
analyst brain still wants perfection.
If you know, you know.
The Data Press Guy
1
16
Started shaping my Fashion Retail Sales dashboard in Power BI. KPI cards are in place, the sales trend is taking shape and category analysis is already revealing patterns. This stage (CONT⬇️) #PressingData #DataAnalytics #PowerBI #DashboardDesign #BusinessIntelligence
1
1
5
85
is the skeleton of the dashboard. I prefer building slowly and intentionally because the quality of the final insight is usually decided long before the dashboard is finished.
Princewill_Data | Pressing Data into Insights
1
45
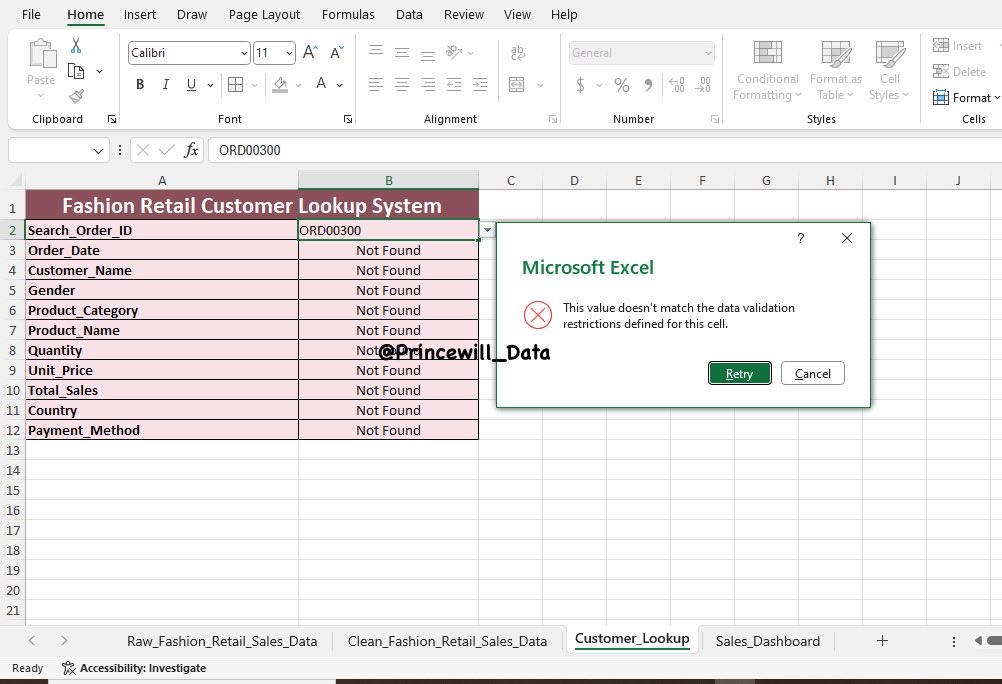
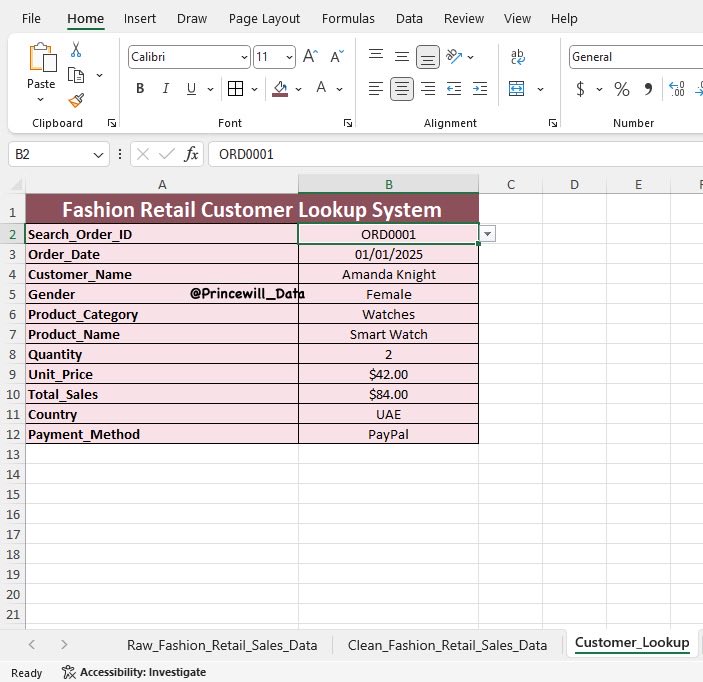
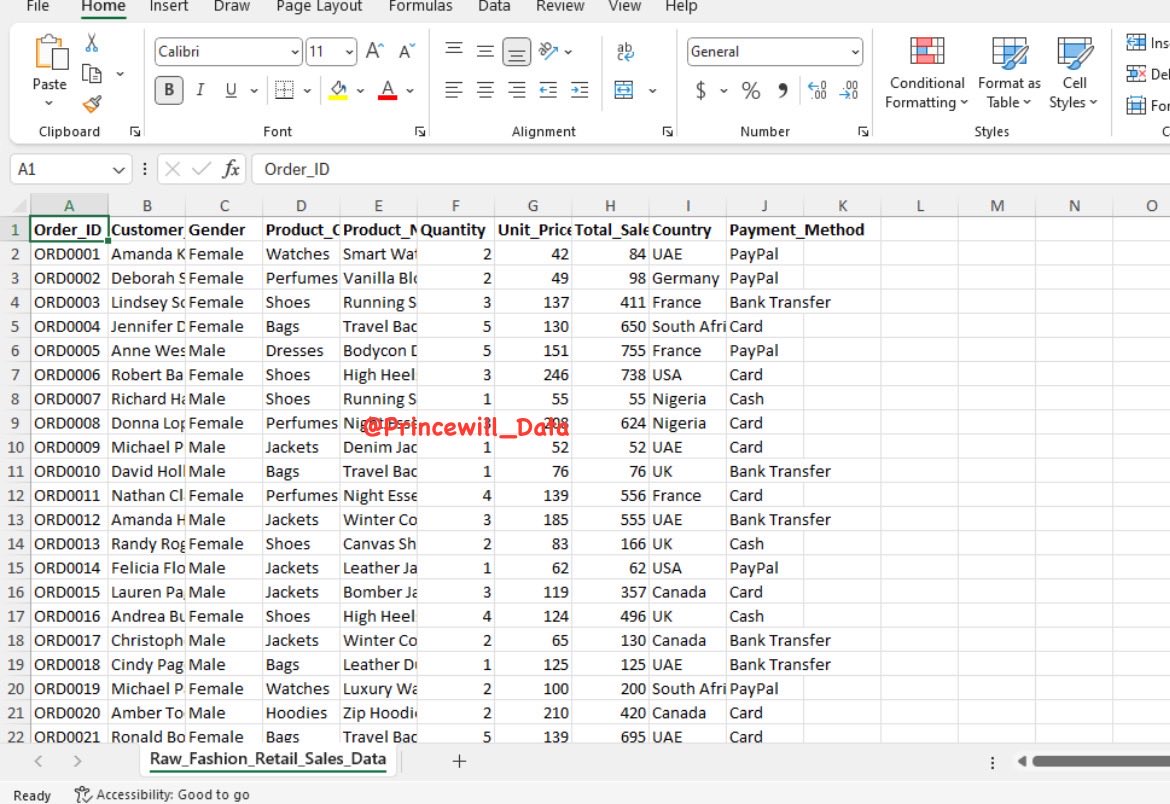
This past week was a mix of data cleaning, XLOOKUP systems, Power BI modeling, dashboard building and a lot of problem solving behind the scenes. One thing I'm learning is that (CONT⬇️) #PressingData #DataAnalytics #Excel #PowerBI #BuildingInPublic #Datafam
The Data Press Guy
1
2
39
progress rarely shows up as one big breakthrough. Most times it's just stacking small wins until they become impossible to ignore. Back at it tomorrow.
The Data Press Guy
1
13