
Joined May 2021
- Tweets 96,816
- Following 946
- Followers 18,792
- Likes 419,908
28,781 Photos and videos


Pinned Tweet

Jun 5
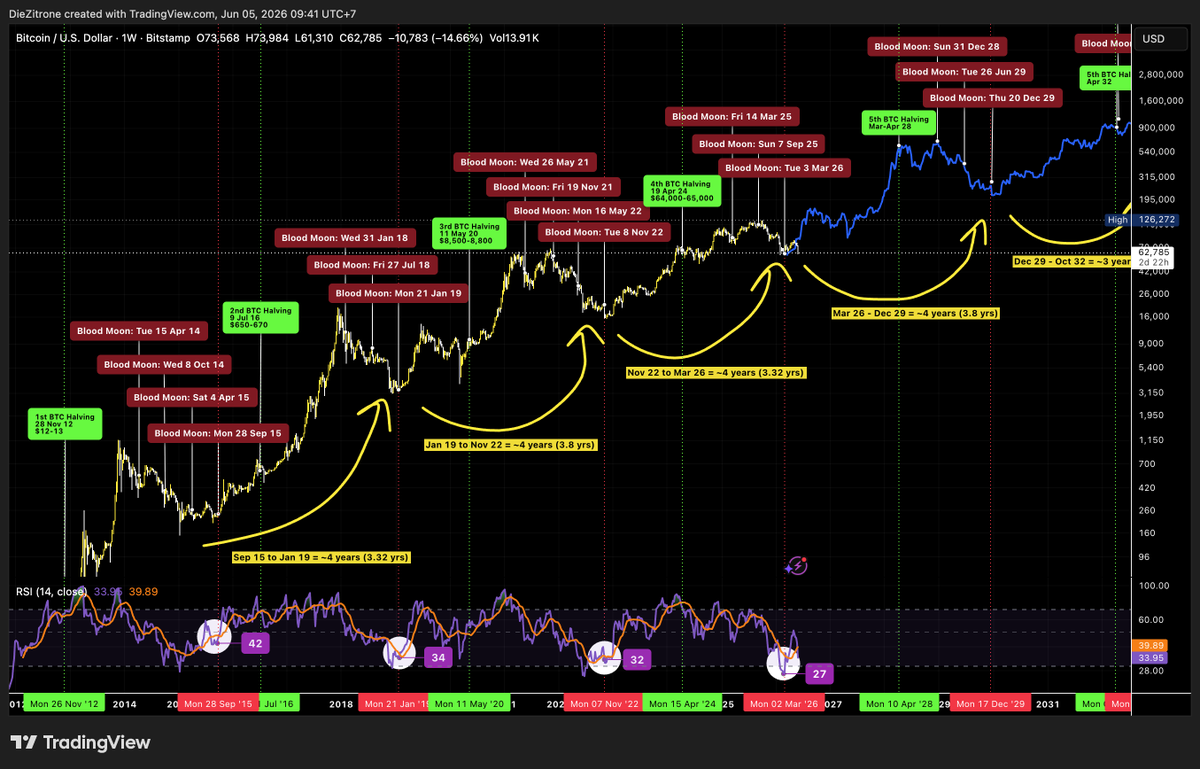
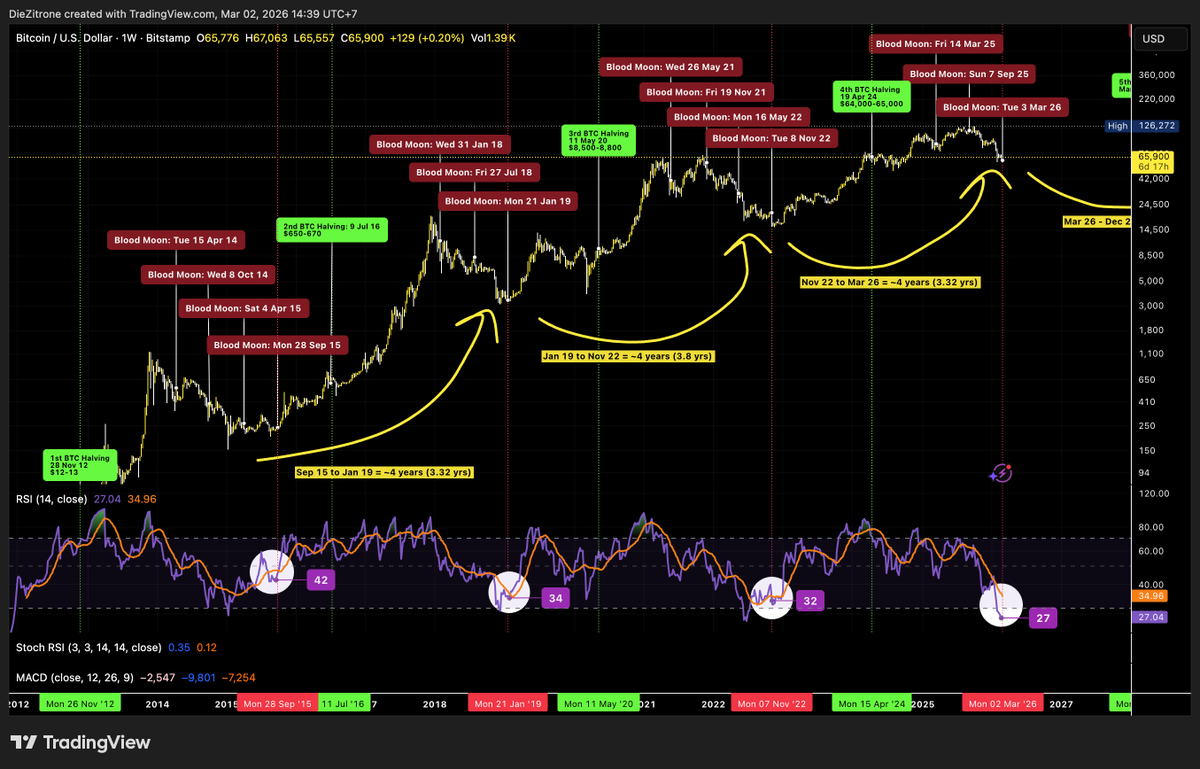
$BTC Cycle Analysis (Weekly Chart) based on 🌒 Blood Moons $BTC Halving Dates Weekly RSI on Blood Moons 🌒
Blood Moons have been marking major cycle bottoms for over a decade (between 2012 and now)
Every major BTC bottom has formed between the last Blood Moon of one cycle and the next as shown on this chart.
Halving Blood Moon 🌒 Rhythm
------------------------------------
1⃣ Halving (2012) > bottom near 2015 Blood Moons
2⃣ Halving (2016) > bottom near 2018-19 Blood Moons
3⃣ Halving (2020) > bottom exactly on Nov 2022 Blood Moon
4⃣ Halving (2024) > we’re now inside the 2025-2026 Blood Moon window
Cycle Timeframes (Low to Low)
---------------------------------
~3.3 – 3.8 years (very consistent)
Weekly RSI at Cycle Bottoms
-------------------------------
2015 > 42
2018 > 34
2022 > 32
Current (2026) > 27 = most oversold ever
We’re sitting at the lowest weekly RSI in Bitcoin’s history, right in the middle of the Blood Moon cycle window, exactly where every previous bottom has formed.
My analysis is based purely on the observed pattern between Blood Moon dates, Bitcoin halvings, and weekly RSI levels. I could be wrong, but I just wanted to share what I’m seeing on the chart.

9
6
41
10,057
bitcoin:native
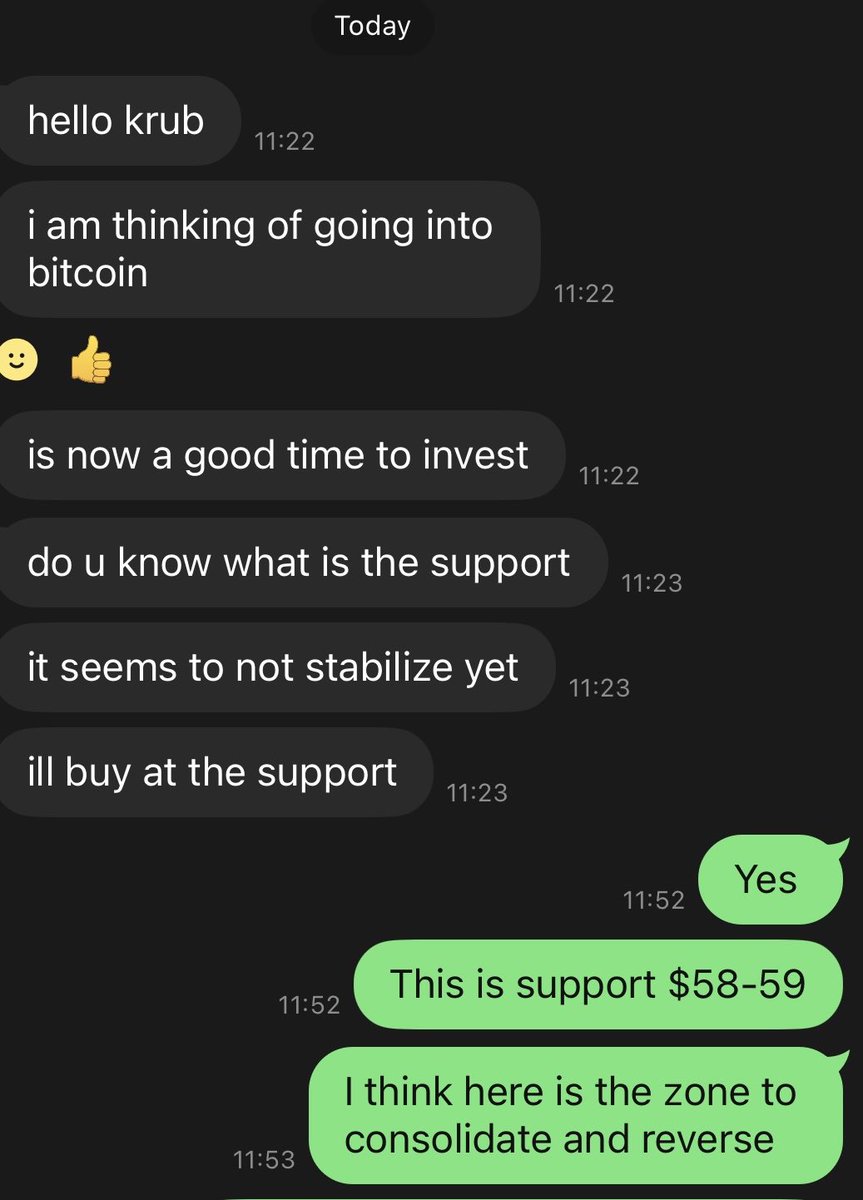
Perfect timing. He bought Bitcoin near the recent lows, and it's now up almost 10% since then.
Jun 6
He sent me texts just now, asking about the support of $BTC as he wants to invest in Bitcoin 👌🏼
1
5
361
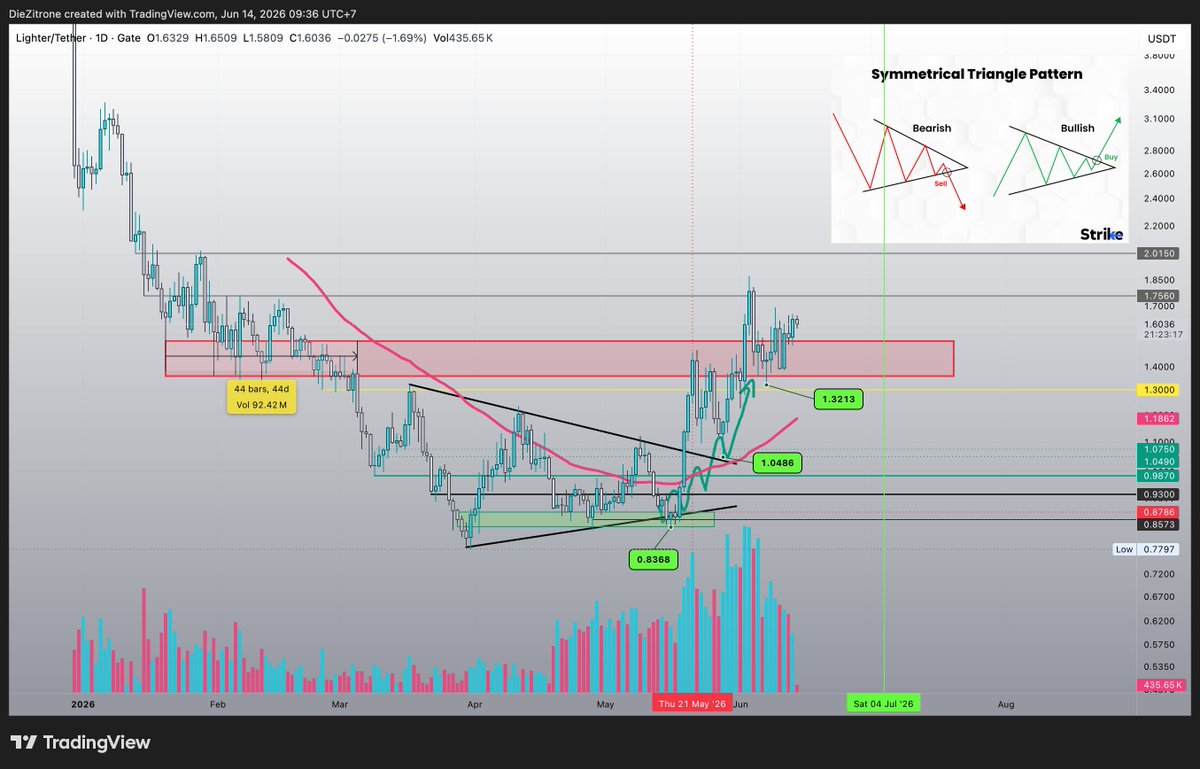
$LIT l @Lighter_xyz
Price continues consolidating in this range. I expect a breakout from the resistance zone in the next few weeks, likely around July 4.
Jun 11
$LIT l @Lighter_xyz
Price retraced to the support zone between $1.2–$1.3, which is still holding up well.
As expected, price is now consolidating and should attempt another breakout once this consolidation phase is completed in the coming weeks.

2
410

$BEAT the 82x party is now over, potential bearish H&S pattern on 1H timeframe will likely push price down back to $1 or lower in the coming weeks

1
2
513
Pure8 retweeted

17
42
251
23,478
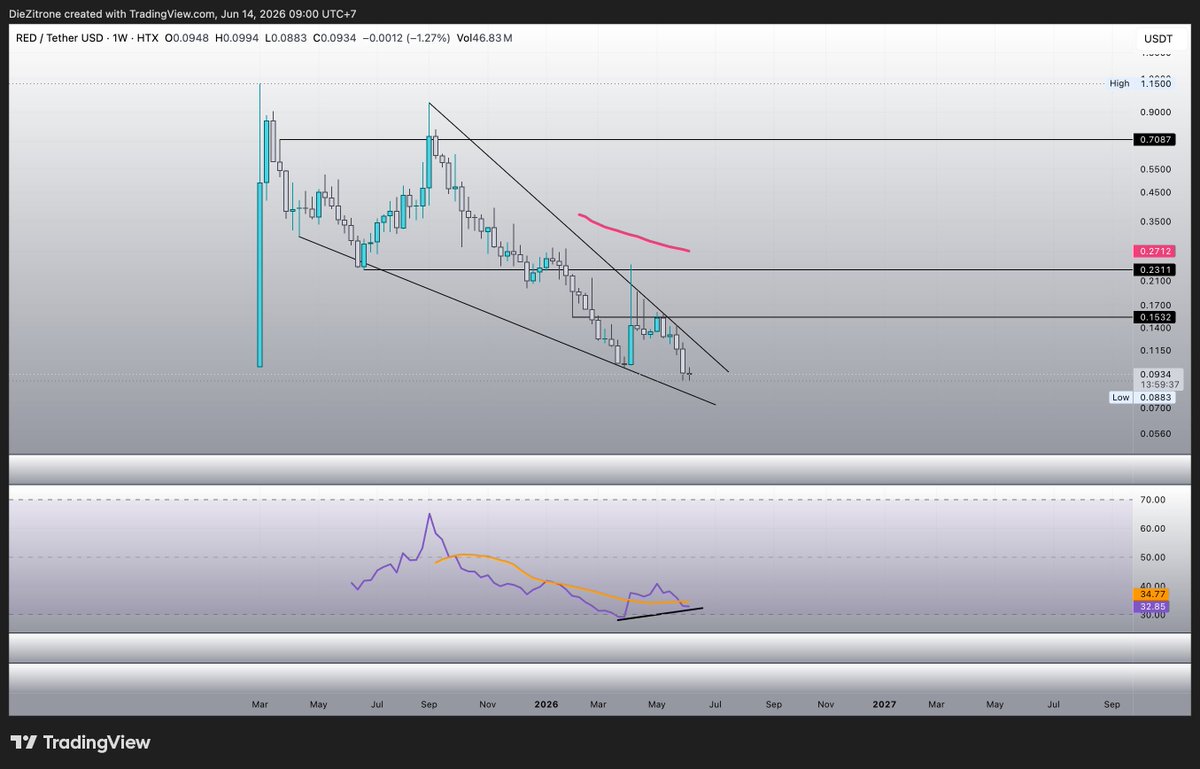
$RED / $REDSTONE l @redstone_defi
Potential bullish divergence forming on the 1D, 3D, and weekly charts. Price is near the bottom and ATL while fundamentals look solid, I like this kind of setup.
1
394
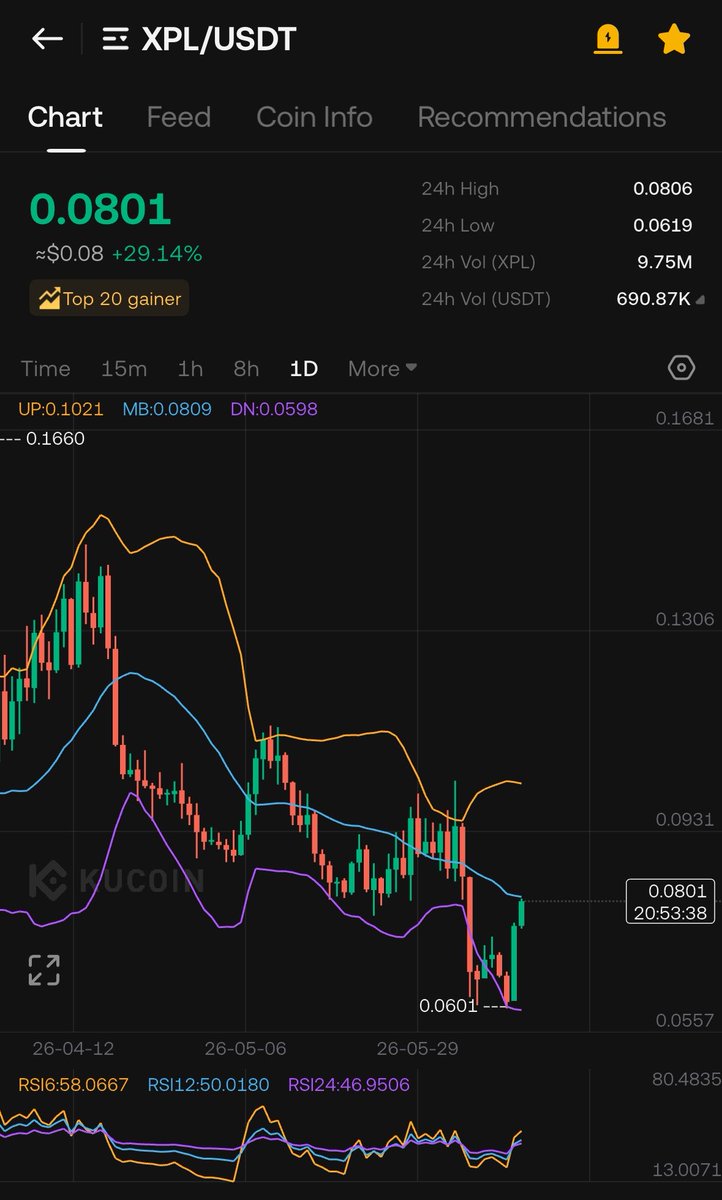
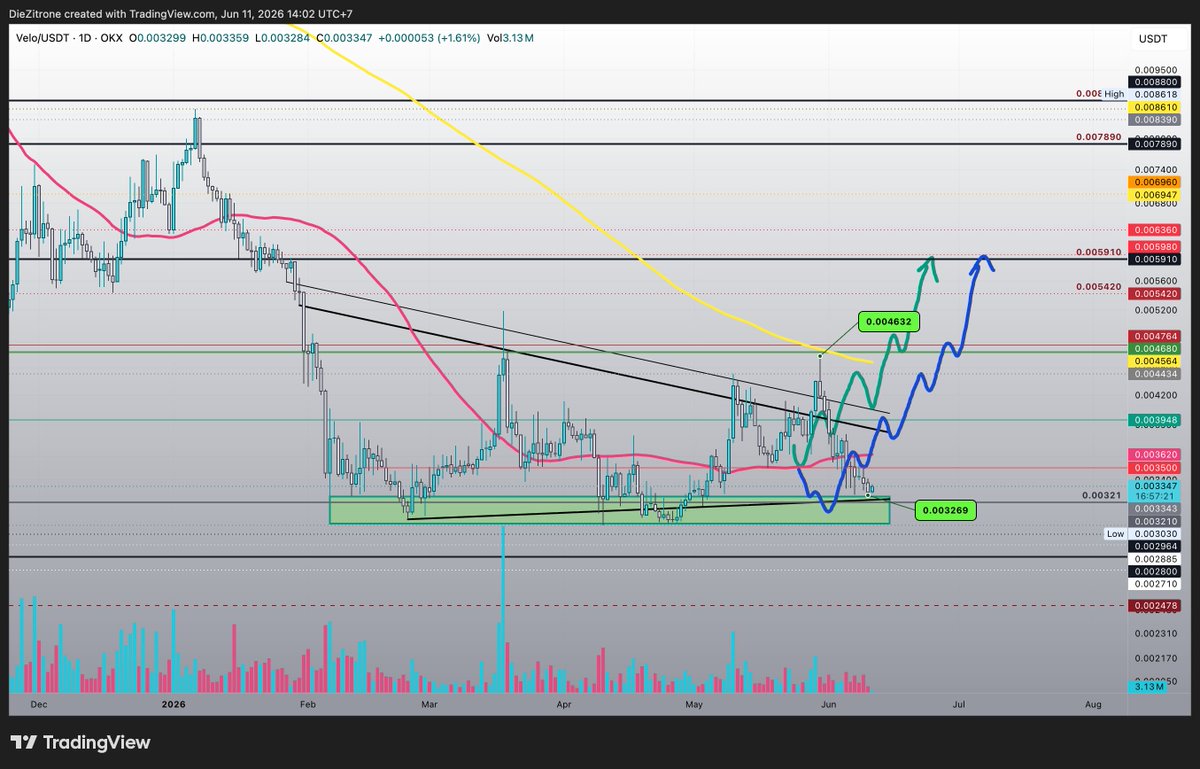
$VELO l @veloprotocol
Price continues consolidating at the current base zone.
Daily MACD is approaching a bullish crossover within the next 2–3 days, with the daily RSI also expected to move above 50.
Jun 11
$VELO l @veloprotocol
Price dropped into the demand zone on the 1D chart and bounced.
A positive development, with a bullish crossover forming on the 1D Stoch RSI. However, 1D MACD and RSI remain bearish for now.
3
28
717
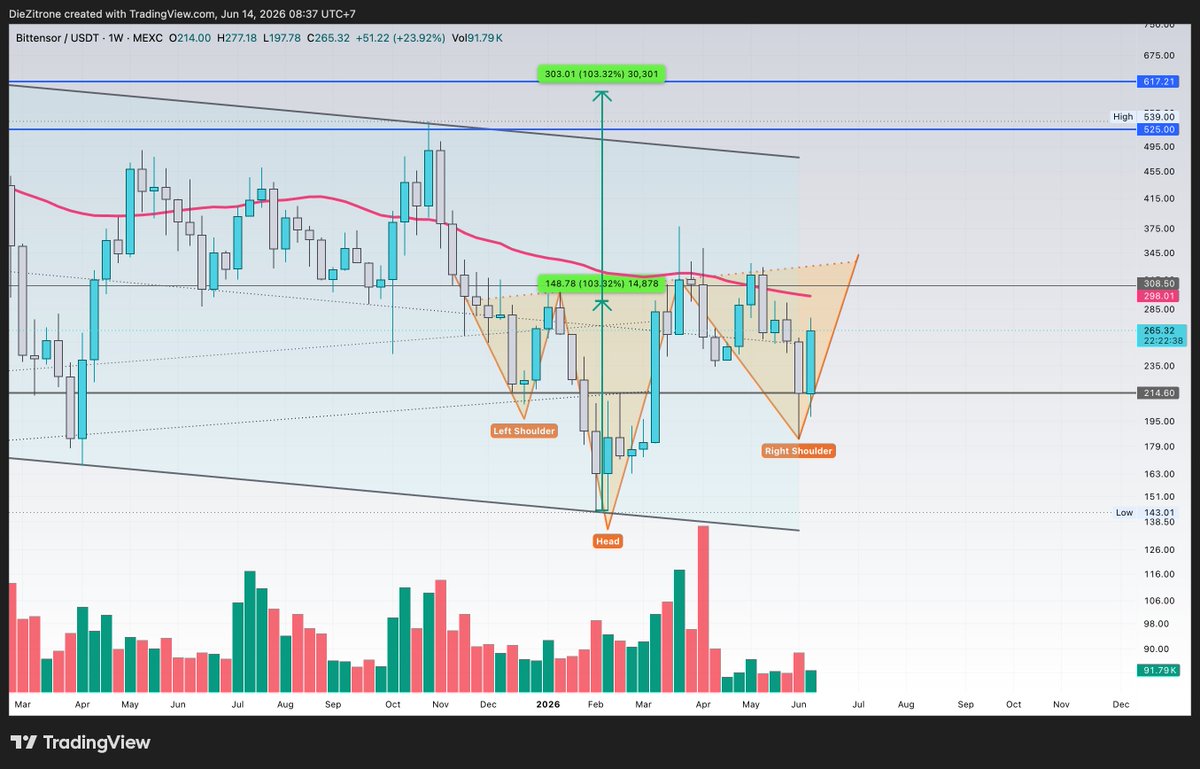
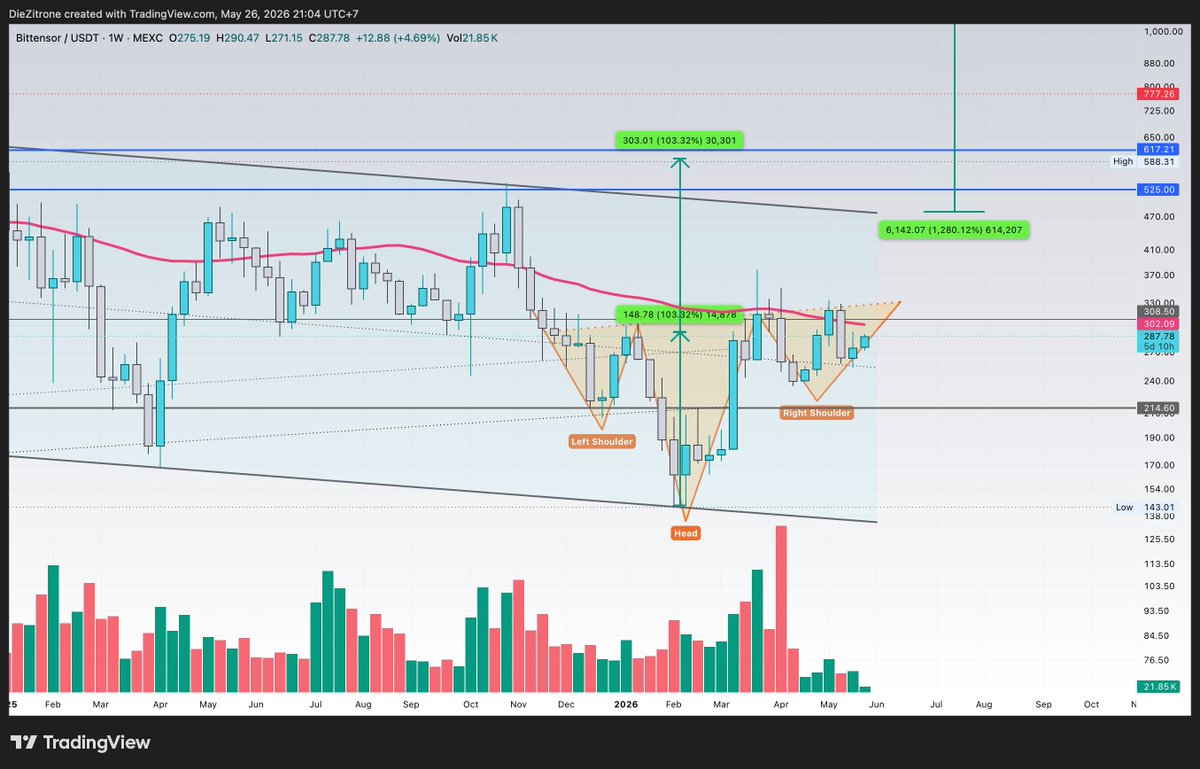
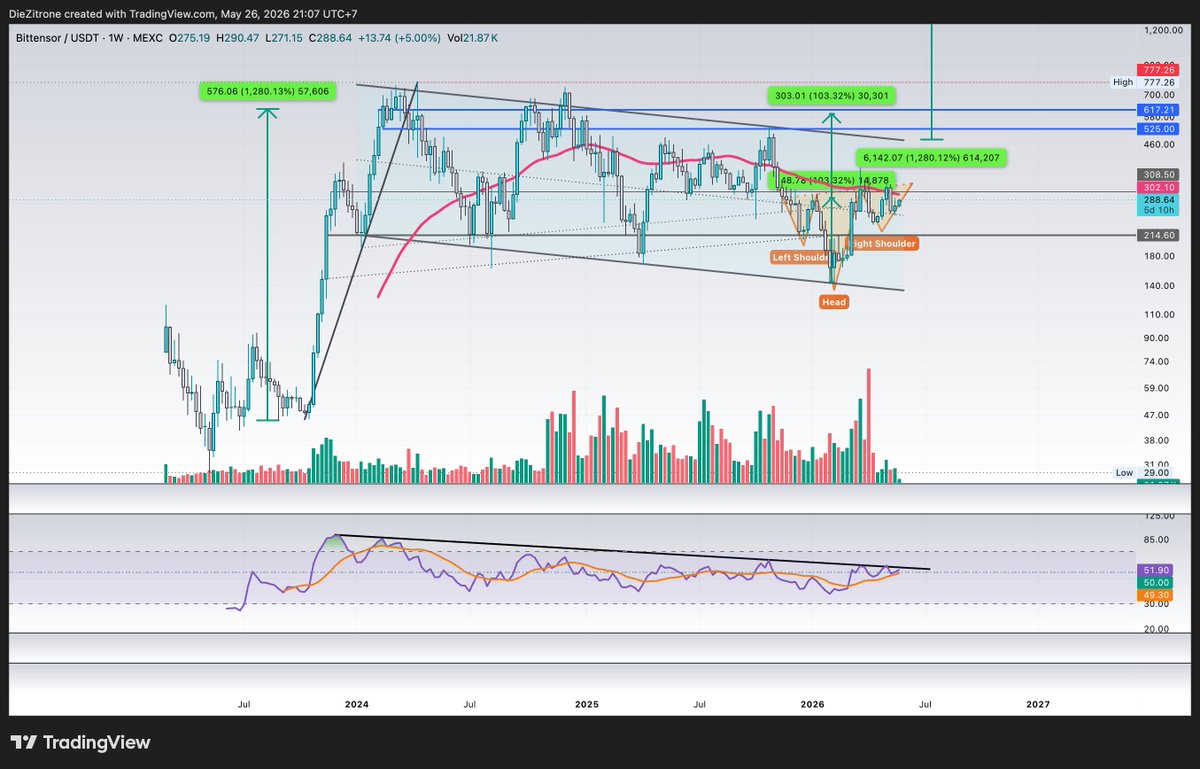
$TAO
Adjusted the inverted H&S pattern on the weekly chart to better align with recent price action. The pattern is still forming and has not been invalidated.
A potential bull flag idea on the weekly remains unchanged.

May 26
$TAO
Chart Update
The inverted H&S pattern on the weekly chart is still forming and has not been invalidated, including the potential bull flag pattern idea on the weekly chart.
1
6
593
Jun 12
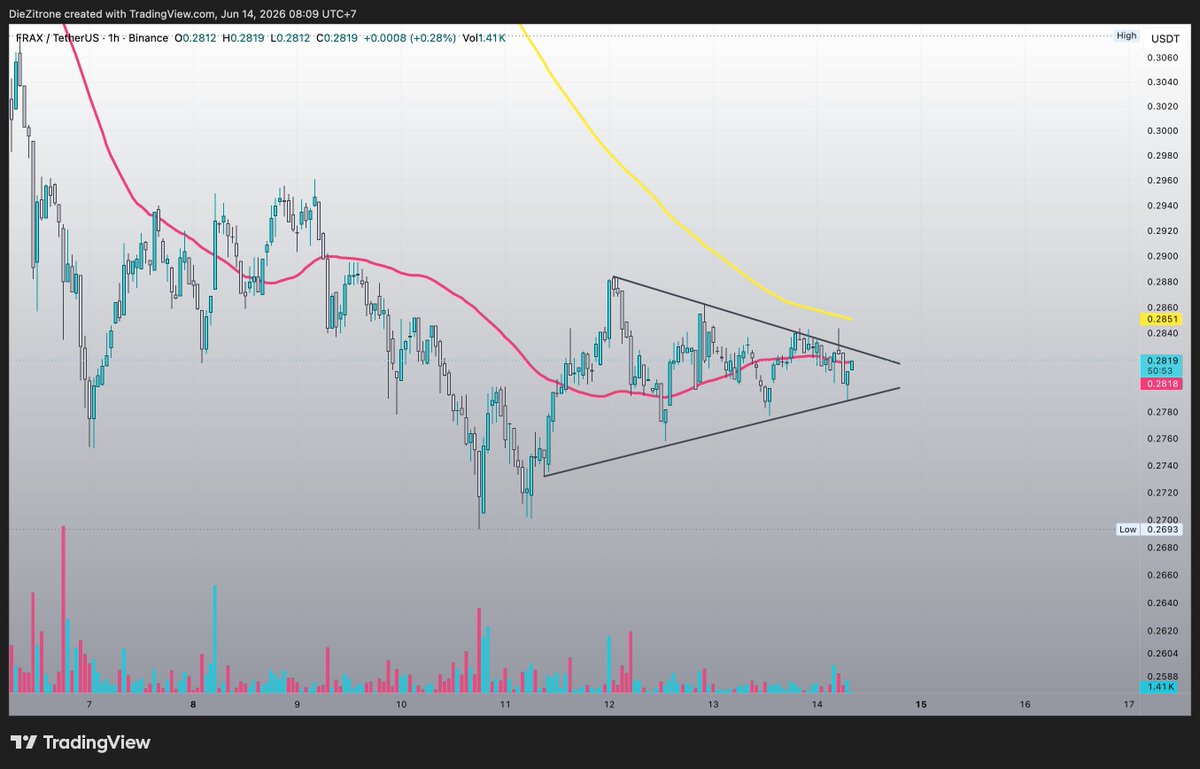
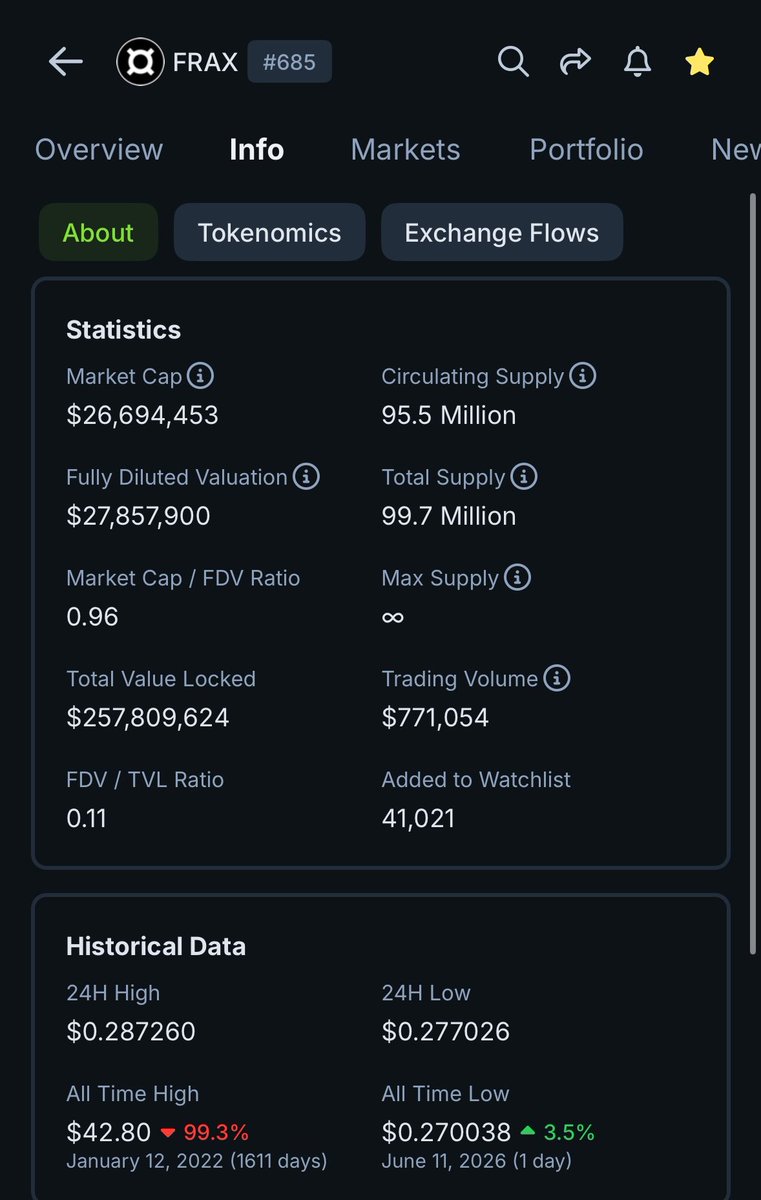
$FRAX didn’t bounce but dropped lower and made a new ATL at 0.27 on June 11
BUT the daily RSI already reached oversold levels and due for a relief bounce, plus potential bullish divergence on the weekly timeframe remains unchanged.

1
489
15h
Looks like a great price
$RED

Jun 10

RedStone is joining @XDCNetwork as an institutional masternode validator.
Together with @CredoraNetwork, we will operate masternodes on the XDC Network, with data infrastructure support to follow.

1
4
1,483

17h
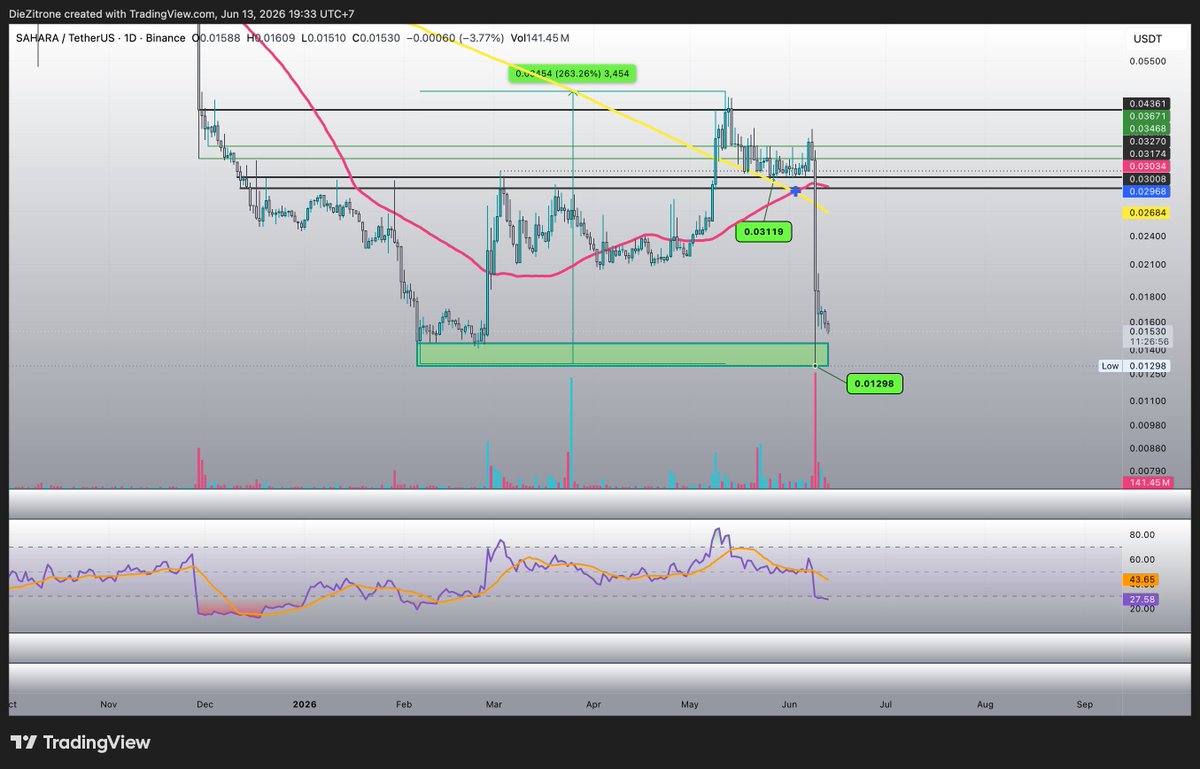
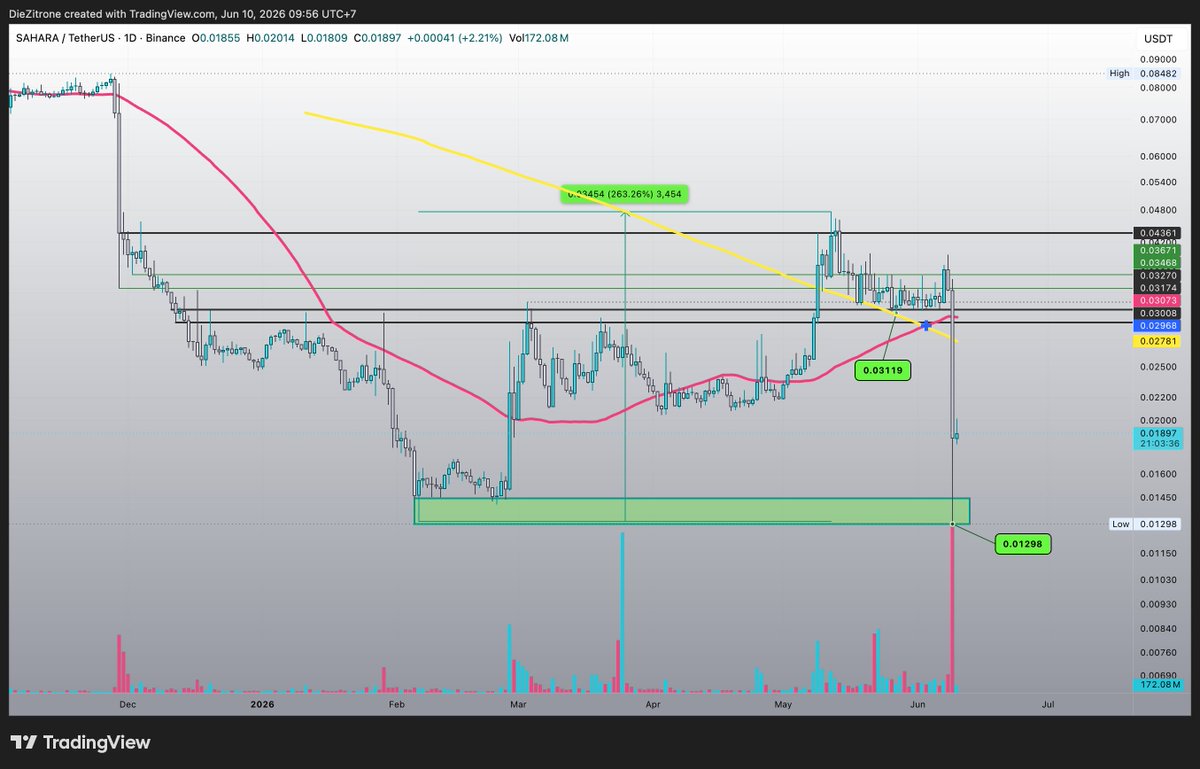
$SAHARA l @SaharaAI
Price is still retracing to fill the wick, as mentioned in my previous analysis. I expect it to bounce from this green zone, especially once the daily RSI drops into oversold territory near 20.
Jun 10
$SAHRA l @SaharaAI
Two weeks later… wow. I hadn’t been following the price action and just checked it now.
After the bearish divergence on 1D timeframe played out, price retraced sharply and dumped all the way back to the demand zone, completely erasing the entire pump. It's likely that price will still retrace to fill the wick of this 1D candle between 0.013-0.015 before a consolidation and a potential reversal.
This is exactly why it’s always smarter to take profits on the way up and set a stop-loss on the rest of your bag.
Moves like this can happen to any project, no matter how hyped or how big they are.
4
1,649
18h
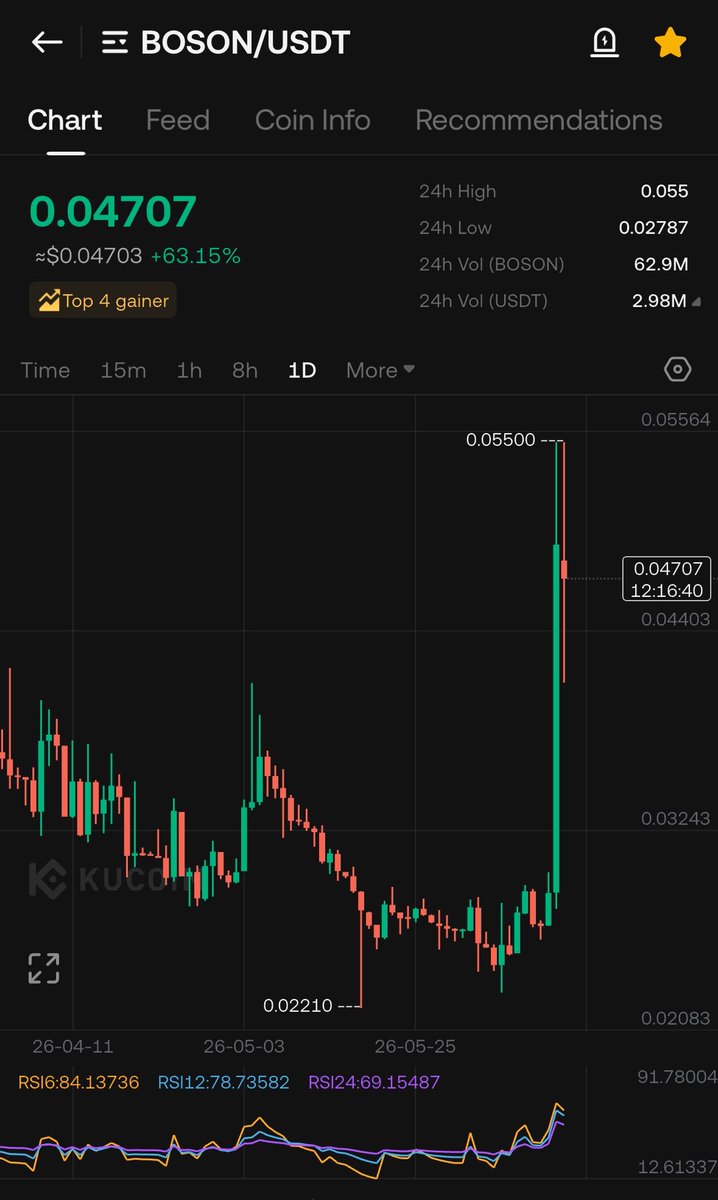
Now I know why $BOSON chart looks like this..
Jun 8

Boson x402B - secure commerce infrastructure for the agentic economy - is live on mainnet!
> Agentic Commerce is going exponential (a16z)
> By 2030 Agentic Commerce will reach $5T (McKinsey)
x402B enables agents to exchange any asset, of any value, between any counterparty. 🧵
2
1,075


Pure8 retweeted

Jun 11
When a person becomes wise, the first thing they give up is showing off.
168
5,587
27,253
346,595