
Daily rule-based strategies (Backtested) on Stocks/ETFs/Futures. 1000 algo trading strategies tested since 2012. | By Oddmund Groette And Håkan Samuelsson
Joined July 2021
- Tweets 5,586
- Following 132
- Followers 17,418
- Likes 26,864
2,132 Photos and videos


Pinned Tweet

12 Jun 2023
8 Quantitative Trading Strategies
(Backtests and Trading Rules)
youtu.be/rlSkRMmycWo
#Quantitative #tradingstrategies

146
442
3,411
16,134,354
QuantifiedStrategies.com retweeted

19h
673
686
8,494
1,054,742
There is a stark parallel between an alcoholic and a trader whose account is being demolished by losses.
- Alexander Elder
1
1
355
A Proven Trading Strategies With A 91.03% Win Rate
4
15
978
Evaluation Requires Sufficient Sample Size
You need many trades before judging a strategy.
Early results are often random and can lead to wrong conclusions.
1
6
820
We combined the #RSI and #MACD indicators to make a trading strategy with an 80% win rate:
quantifiedstrategies.com/mac…
3
625
Found this SPY day trading strategy with 1,985% total return over ~17 years. Real or too good?
3
23
1,667
QuantifiedStrategies.com retweeted
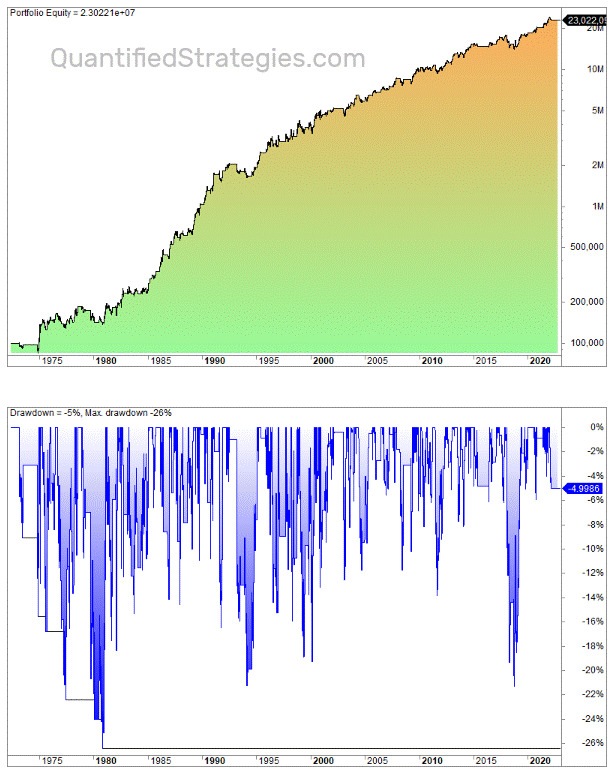
A Trend-Following Strategy (18% Annual Returns Since 1926)
A recent research paper, “A Century of Profitable Industry Trends,” by Carlo Zarattini and Gary Antonacci demonstrates that a straightforward trend-following approach applied to industries has produced impressive long-term results.
The system, based on breakout entries, trailing exits, and volatility-adjusted position sizing, generated approximately 18% annualized returns going back to 1926 across 48 industry portfolios, while maintaining strong risk-adjusted performance.
Trading Rules
The strategy detects trends using simple breakout techniques.
A long position is initiated whenever an industry’s closing price rises above the upper boundary of either a Donchian Channel or a Keltner Channel.
The Donchian signal uses the highest price observed during the previous 20 trading days, while the lower band relies on a longer 40-day lookback period.
This asymmetry encourages the system to remain invested during sustained advances.
The Keltner Channel is constructed around a 20-day exponential moving average combined with a volatility buffer equal to 1.4 times the Average True Range, again paired with a 40-day lower band.
The strategy only takes long positions. When no industries display clear upward momentum, capital is allocated to Treasury bills instead of remaining exposed to equities.
Risk management
Risk management is handled through volatility targeting. Each industry position is scaled so that it contributes a similar amount of risk to the overall portfolio.
Allocation weights are therefore inversely proportional to recent 14-day volatility, meaning more volatile industries receive smaller positions.
To keep leverage within realistic limits, total portfolio exposure is capped at 200%.
Exits are governed by a trailing stop mechanism. The stop level is defined as whichever is higher between the lower Donchian band and the lower Keltner band, both calculated using a 40-day lookback.
Importantly, once the stop moves higher, it is never reduced. This allows profitable trends to continue while ensuring losing trades are closed quickly.
Results (Backtest below image)
To read our full article on this strategy, check out our X-post (Feb14-26). I strongly recommend reading the original research paper for a deeper understanding.

10
40
321
28,020
QuantifiedStrategies.com retweeted
Mean reversion vs. trend following:
MR: high win rate, many trades, small gains, rare big losers, negatively skewed. Fat tails problematic.
TF: low win rate and big winners. Fat tails are to your advantage.
Combine them in your portfolio!
4
6
57
4,240
QuantifiedStrategies.com retweeted
The “dumb money” label keeps aging badly.
Retail investors now account for about a third of U.S. equity trading volume.
And the data shows a persistent pattern:
They step in after drawdowns.
They buy when prices fall.
They have become one of the market’s key dip-buying forces.
3
6
33
6,237
QuantifiedStrategies.com retweeted
Why Multiple Strategies Beat One Strategy
Professional traders rarely depend on a single setup.
Different systems perform better during different market environments, so diversification across strategies helps stabilize returns and reduce dependence on one specific condition.
2
1
11
989
Why Most Traders Quit Right Before Improvement Starts
Many traders quit during the phase where progress still feels invisible.
They expect fast results, underestimate the learning curve, and lose confidence after normal setbacks.
Consistency is difficult because improvement in trading often happens slowly before suddenly becoming noticeable later on.
361
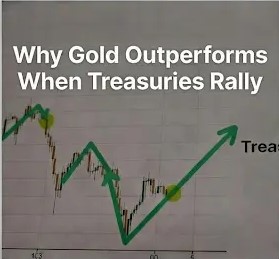
Why Gold Outperforms When Treasuries Join the Rally – A 50-Year Edge
For over 50 years, gold’s strongest and most reliable rallies have occurred when its 12-month momentum aligns positively with that of 10-year US Treasuries.
This simple month-end check has historically filtered out weaker periods—reducing exposure by about 19%—while capturing the bulk of the upside, all without complex indicators or overfitting risks.
The cross-asset relationship offers a timeless, elegant edge for timing gold exposure.
1
1
10
835
QuantifiedStrategies.com retweeted
6 Oct 2023
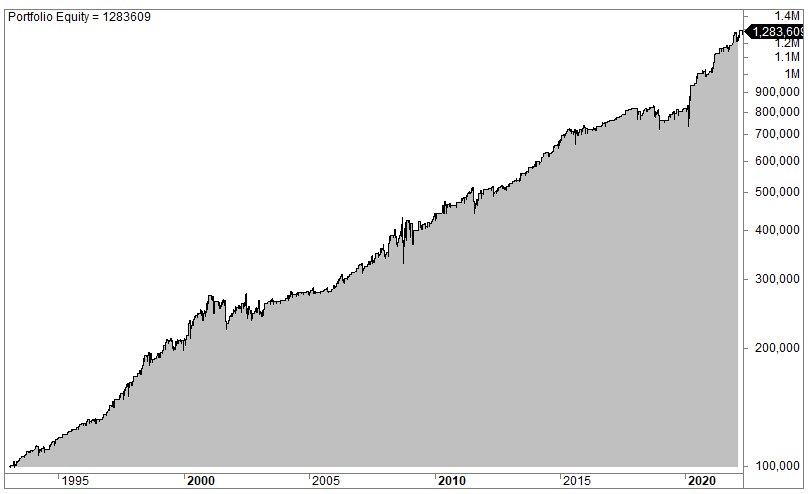
RSI SPY Trading Strategy (RSI(2) On SPY )
It turns out that our hypothesis is correct: the RSI works well on SPY. Even better, we improve the strategy by adding one extra indicator.
The trading strategy is really simple and reads like this in plain English:
* If RSI(2) is less than 15, then enter at the close.
* Exit on close if today’s close is higher than yesterday’s high.
The accumulated profit curve from 1993 until today is shown in the image below.
The trading performance metrics look like this:
* The average gain per trade is 0.57% (470 trades)
* The win rate is 75%
* Time spent in the market is 24%
* Max drawdown is 23%
* The profit factor is 2.3
You can find more info about this trading strategy here:
quantifiedstrategies.com/rsi…
#RSI #SPY #tradingstrategy #systematictrading #investing #trading #tradingtips #algotrading
7
18
281
19,948
A dataset from the Taiwan Stock Exchange analyzed hundreds of thousands of day traders.
Key finding:
Only about 15% were profitable in any given year.
Even fewer stayed profitable for multiple years.
Consistency is the real challenge.
11
1,169
Trading Journal The Habit That Makes Traders Profitable
2
3
8
1,034
People’s only excuse for using these models is that other people are using these models.
- Mark Spitznagel
1
555
Discipline as a Variance Reducer
Discipline helps you avoid impulsive trades.
This reduces random mistakes and makes your results more stable over time.
2
5
829
QuantifiedStrategies.com retweeted
1 Dec 2023
Bollinger Band Squeeze Strategy Explained – Backtest And Performance:
The Bollinger Band Squeeze strategy is about going in the same direction as the breakout after a period of low volatility. The assumption is that the breakout sets the tone of the action over the following days (or weeks – depending on the time frame).
We use the following rules to make a strategy:
* We use weekly bars (it seems to work better than daily)
* We use 10-week data
* We create a volatility band (10 weeks) that is the difference between the upper and lower Bollinger Bands
* We create a 10-bar RSI value for the volatility bands
The buy and sell signals read like this:
* The RSI of the volatility bands must be lower than 45
* The close (of the asset) must set a new 5-day high
* We sell after 20 weeks
Below is shown the performance on Pepsi (PEP).
Can the strategy be improved or made different? If you have any suggestions, please comment 👇
6
9
64
9,975