Democratos retweeted

macd bullish divergence
5
13
101
6,469

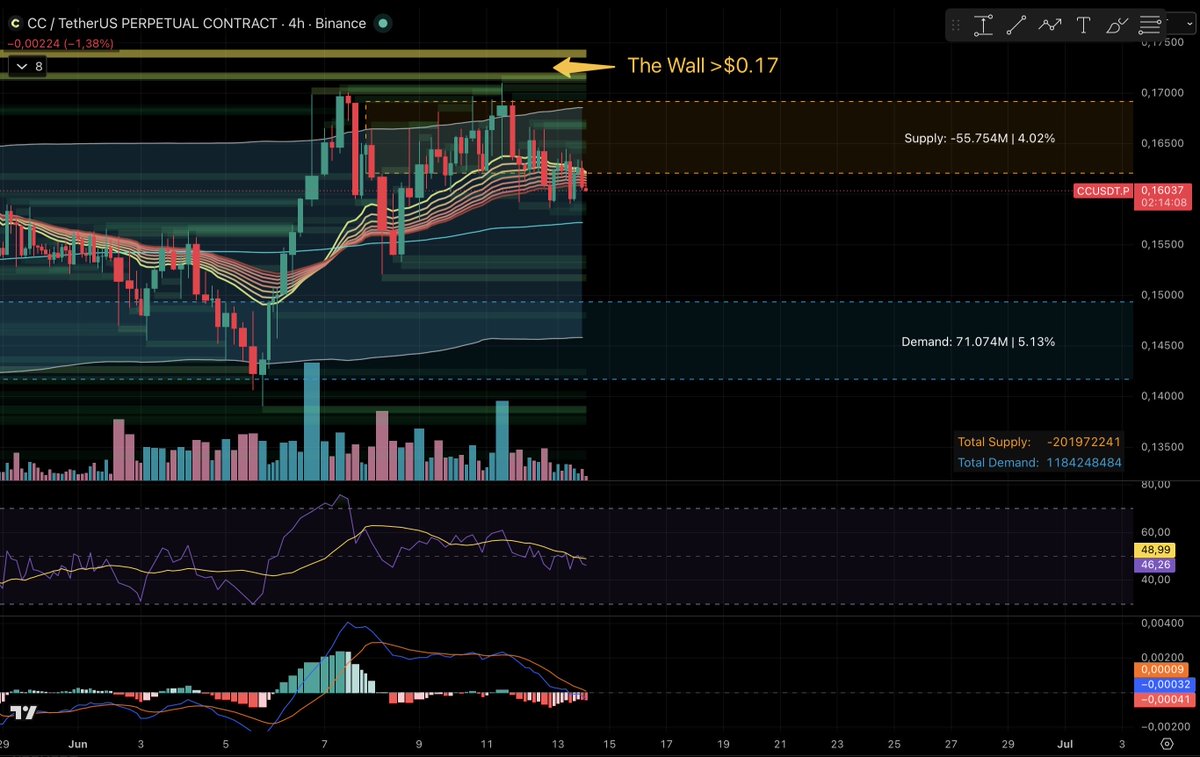
📊 Status quo for canton-network:native
So far, $CC has failed to break through the upper resistance zone at $0.17, while trading volume has continued to decline. 📉 Increased selling pressure has pushed the price back into a supply zone that is currently weighing on the market.
As a result, we’re once again moving closer to the middle of the Bollinger Bands and the 200 SMA on the 4H chart. The recent upward move caused the EMA bands within the EMA Ribbon to spread further apart, but this typically leads to price eventually returning toward the center of the bands. 🎯
The bulls failed to take full advantage of the recent upward momentum, and both the RSI and MACD have now moved below their signal lines, hovering close to the zero line. ⚠️
Let’s see what today’s session brings. 👀
A little bird whispered to me that Trump might inject some extra energy into the market today. 🚀🇺🇸
#CC #Crypto #Altcoins #TechnicalAnalysis #Trading #Charts #PriceAction #BollingerBands #EMA #RSI #MACD #CryptoCommunity #Bullish #MarketUpdate
5


朝からずっとオリジナルインジケーターを研究して
できたものが
よくよく考えたら
ほぼMACDだった
MACDの理解深まっただけ
1
3

🚨 $INX 1H Analysis
Price is stabilizing around $0.0077 after a brutal downtrend.
✅ MACD turning bullish
✅ RSI back above 50
✅ Buyers defending the $0.00745 zone
Key levels: 📈 Breakout: $0.00790
🎯 Targets: $0.00830
🛡 Support: $0.00745
Momentum is slowly shifting.
Will $INX reclaim $0.008 this weekend? 👀
#INX #INXUSDT #Crypto #Altcoins #Trading #Bitcoin #CryptoTrading

21

hey! here's a quick breakdown on $TRUTH #TRUTHUSDT 1h 🚀
- expecting price to RISE further in the short term, clear bullish momentum and strong breakout above all recent resistance levels
- bias is LONG, looking for continuation moves
- first target for price is the 0.01450 area, which is the next major supply/resistance above the current price
- possible pullback entries at 0.01270 and 0.01224 (former resistance, now likely support), watch for bullish engulfing or pin bar confirmation on LTF before entering
- take profit at 0.01450, partial TP at 0.01390 if momentum stalls
- if price closes below 0.01187 (most recent swing low), bullish bias is invalidated and I'd wait for a new setup
- strong confirmation from all indicators (MACD, RSI, momentum, etc.) — watch for volume spike and bullish candle structure as entry trigger
not investment advice, educational report only
📊 Need more detailed analysis, trade signals?
Try Finora AI Telegram Bot for free - t.me/FinoraEN_Bot

17
isaac11 retweeted

Jun 10
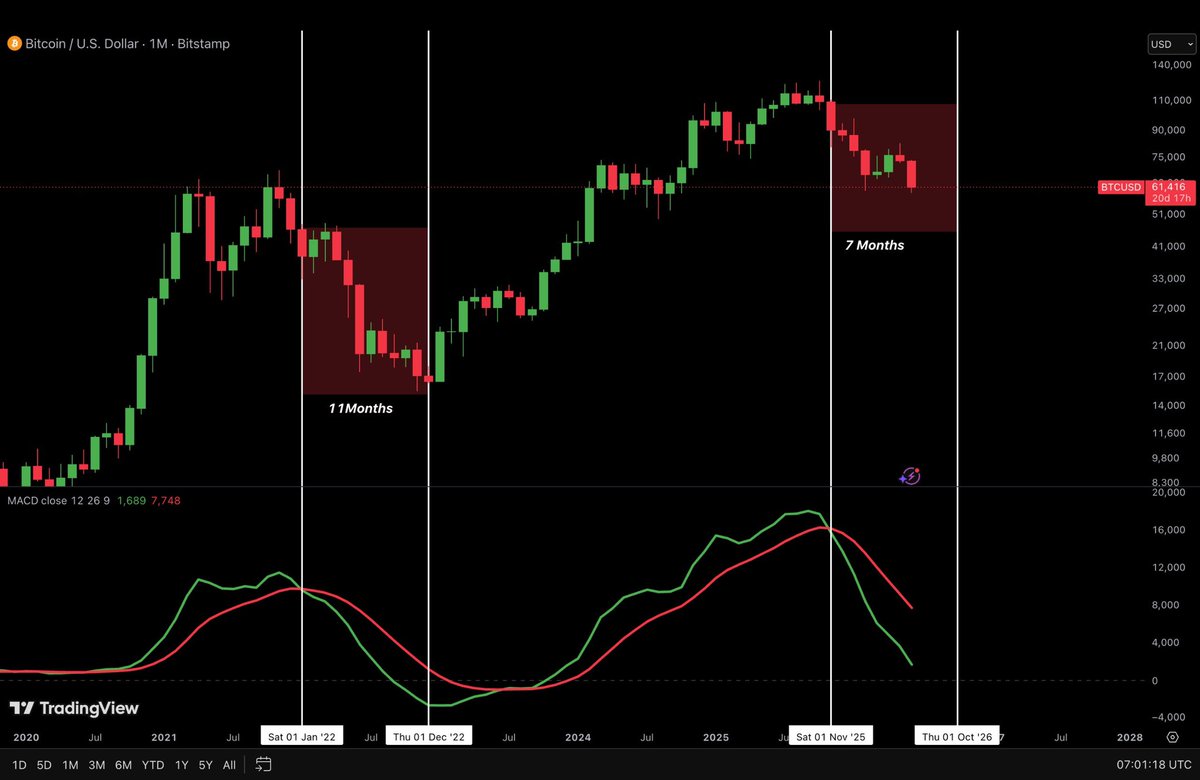
No one is talking about this.
In the previous cycle, Bitcoin bottomed 11 months after the monthly MACD confirmed a bearish crossover.
We’re now 7 months into the current one
if history repeats, the bottom could land around October this year, aligning with the 4-year cycle right before the next big run.
390
288
1,785
210,960

4/5 — $SYRMA
EMS
LTP: ₹1,268.3
Stop: ₹1,237.5 (-2.4%)
Target: ₹1,329.9 ( 4.9%)
Score: 6/10 | R:R 2.0:1
📐 STRONG UPTREND
📊 MACD: BULLISH
#SYRMA #NSE #SwingTrade
1
4
3/5 — $ELGIEQUIP
Capital Goods
LTP: ₹606.25
Stop: ₹589.15 (-2.8%)
Target: ₹640.45 ( 5.6%)
Score: 8/10 | R:R 2.0:1
📐 UPTREND HEALTHY
📊 MACD: BULLISH
#ELGIEQUIP #NSE #SwingTrade
1
3
2/5 — $DATAPATTNS
Defence
LTP: ₹4,535.6
Stop: ₹4,210.97 (-7.2%)
Target: ₹5,184.87 ( 14.3%)
Score: 10/10 | R:R 2.0:1
📐 STRONG UPTREND
📊 MACD: BULLISH
#DATAPATTNS #NSE #SwingTrade
1
6

Thanks you my boss I really appreciate this one self no small
Both my technical analysis and MACD and RSI everything dey in tact🔥🔥🔥
I will like to be hearing more news like this from you sir because am not regret knowing you since say one
3

33m
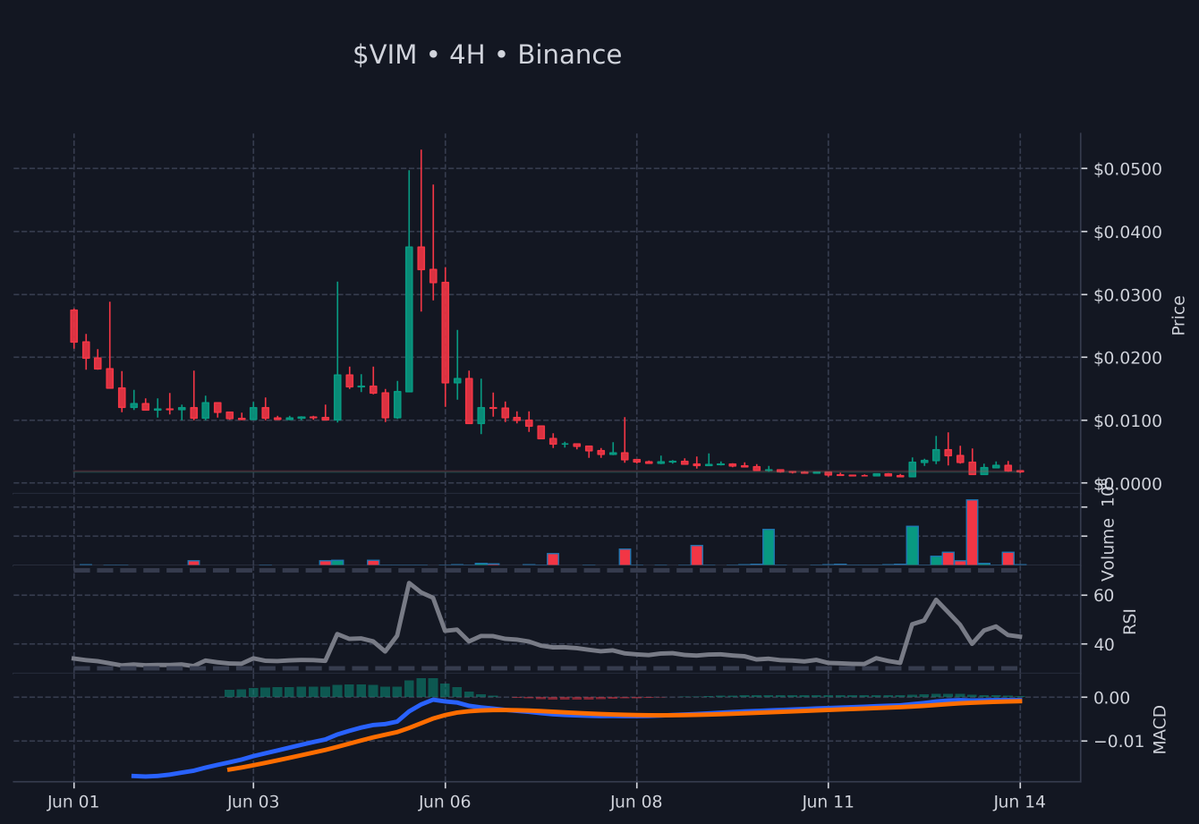
bidding here on $VIMUSDT. rsi is decent at 42 and macd is slightly bearish, but i think we can see some support around 0.0017-0.0018. i'll be looking to add to my bags if we get a bounce off this zone. let's see how this one plays out.
1


Ajay 001 retweeted

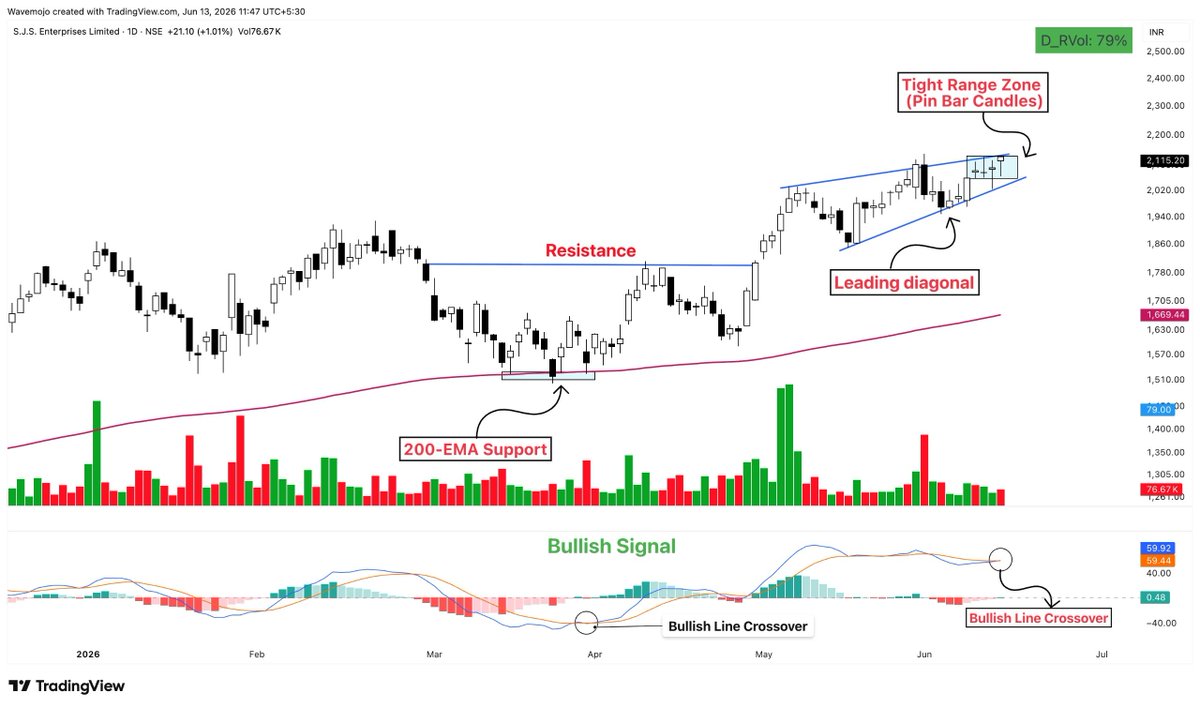
🚨 𝗠𝗔𝗖𝗗 𝗕𝗨𝗟𝗟𝗜𝗦𝗛 𝗖𝗥𝗢𝗦𝗦𝗢𝗩𝗘𝗥 𝗦𝗧𝗢𝗖𝗞𝗦 📈🔥
💥 Strong Price Action Fresh Bullish Signal
👀 High-Conviction Charts You Shouldn't Ignore
A Must Watch Thread 🧵
1- SJS
6
11
121
19,676
好的很 retweeted

1h
选股的尽头是简单
新手:
MACD
KDJ
RSI
布林线
筹码峰
龙头战法
几十个指标一起看。
最后发现:
真正有用的就几个核心变量:
行业景气度
资金流向
公司业绩
市场情绪
越复杂越容易迷失。
选股的尽头是简单。
1h

技术分析的尽头是资金
很多人研究形态:
双底
头肩底
箱体突破
但最后发现:
股价上涨的本质是资金推动。
没有资金:
再漂亮的图形也没用。
有资金:
烂图也能涨停。
技术分析的尽头是资金。
1
1
12
3,148

41m
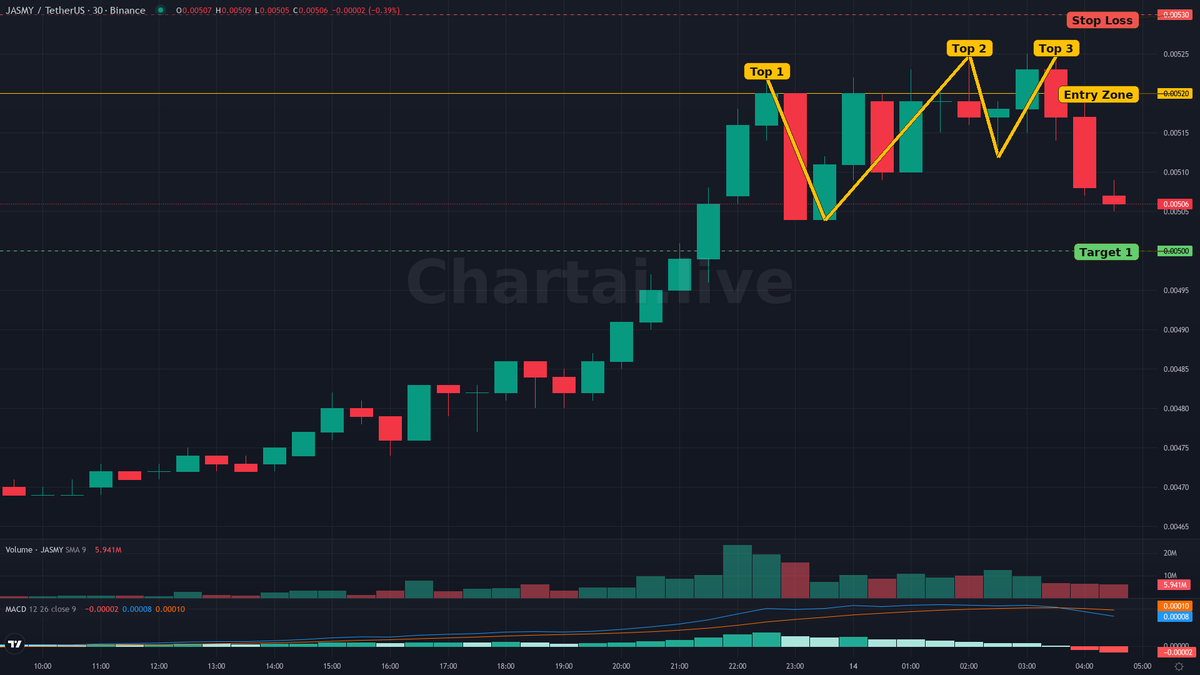
Triple Top detected on BINANCE $JASMY 30. Bias: Bearish.
Status: Active.
Risk/Reward: 2
Entry: 0.0052
Target: T1 0.005
Stop loss: 0.0053
Indicator fired: MACD bearish cross
Indicator fired: Price below WMA 20
Chartai gives your agent chart context. Your rules decide the trade.
68

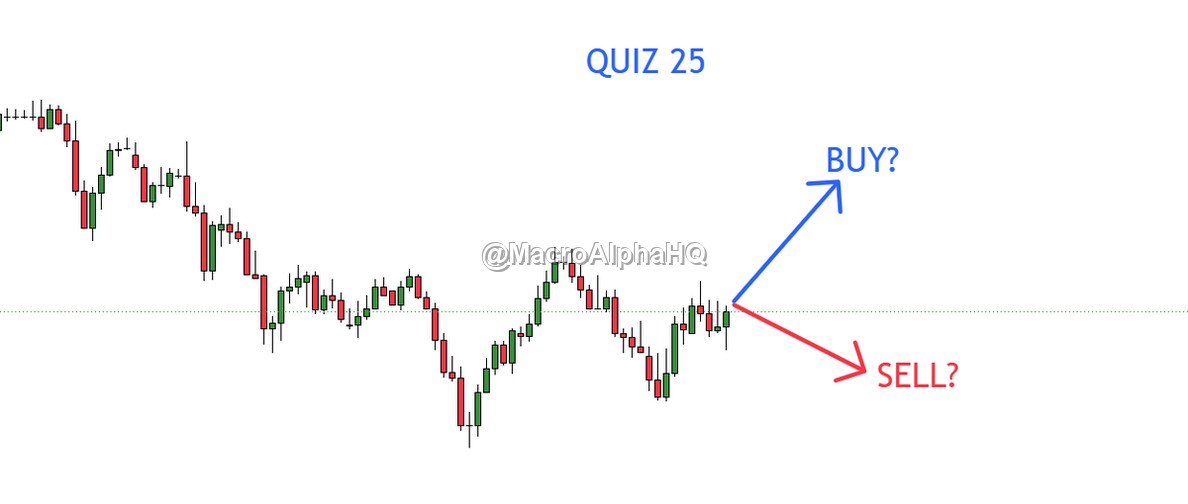
Engagement-farming trading gurus asking "BUY or SELL" on a naked chart is the absolute lowest tier of financial existence.
You retail guys actually sit in the replies debating moving averages like your opinion impacts the order book.
The reality is that institutional sentiment scrapers log your replies to these exact threads to map out where the retail liquidity clusters are hiding.
You think you are participating in a community discussion about market direction.
In reality, you are voluntarily handing over your directional bias to quantitative models designed specifically to hunt your stop losses.
Risk desks do not care about your retail chart patterns or your MACD crossovers.
They care about the fact that 80% of the replies are screaming "BUY" with maximum leverage.
That tells the clearing houses exactly how much inventory they can dump on you before the bid stack entirely evaporates.
These engagement accounts are not giving you alpha.
They are farming you for impression revenue while simultaneously providing free data points for predatory algorithmic execution.
Keep commenting your directional bias on $SPY for the timeline.
The execution algos need to know exactly where to price tomorrow's margin calls.
2
77

RT @getphantomflow: If you’ve tried RSI, MACD, EMAs — and still lose trades…
It’s not your fault.
Those tools were never designed to follow…

41
学技术指标之前,先想明白这 4 点,不然容易走弯路:
① 指标都是滞后的——基于历史价格算出来,本质是"价格的衍生品"
② 指标会骗线——震荡市里 KDJ、MACD 经常发假信号
③ 没有最好的指标,只有适合你交易风格的指标
④ 指标只是辅助决策,核心永远是量价和趋势
一句话:先有交易逻辑,再用指标验证,而不是看指标做交易。
17

noteこーしーん🫡
MACDのG.C、D.Cでシグナルが出るヤーツ。
持ってる人いるかもねー?
note.com/bonote01/n/na097578…
19