
Joined September 2022
- Tweets 909
- Following 61
- Followers 175
- Likes 948
435 Photos and videos


Jun 14
🗺️ THE WEEK AHEAD: FOMC CATALYST, 4H COMPRESSION & THE KANGAROO SWOON ON $NQ 🦘
Family, we are officially wading deep into the summer doldrums, but this week the algorithms are getting a massive injection of volatility. 📊
The Nasdaq 100 ($NQ) closed Friday at 29,677.75, dropping us into the lower quadrant of the monthly structural map. With the Federal Reserve taking the mic on Wednesday, the institutions are going to use the incoming data to hunt liquidity and force violent structural realignments across index futures. 💸
Here is exactly what the engine is tracking across the Daily and 4H timeframes, and the master level map for the week ahead. 🔍👇 (1/5)
📅 MACRO CONTEXT: THE VOLATILITY INJECTION 🚨
The "June Swoon" relies on thin liquidity to create wide, choppy ranges. This week, we have major catalysts that will momentarily flood the market with volume, creating perfect algorithmic traps on $NQ. 🪤
Wednesday (June 17): Retail Sales & FOMC Statement / Press Conference. 🎙️ This is the main event. Expect heavy "Ghost Volume" spikes (fake-outs) on $NQ leading up to the release. The engine will be hunting for a violent liquidity sweep followed by a structural slingshot. 🎯
Thursday (June 18): Unemployment Claims & Philly Fed. 📋 The hangover from FOMC. Thursday’s data will likely be used to confirm whatever trend the algorithms anchored during Powell's press conference. 🏛️ (2/5)
📉 THE $NQ MASTER LEVEL MAP (Close: 29,677.75) 📍
We are currently trading below the Monthly Center Pivot (30,415.50) and the Previous Month Close (30,405.25). Structurally, macro momentum on $NQ rests in a bearish posture until those levels are cleanly reclaimed. 🐻
Price is currently sandwiched in a high-tension zone:
🔴 OVERHEAD MAGNETS (RESISTANCE):
31,089.68 (Monthly Mid H) 🛑
30,536.00 (Previous Month High) 🛑
30,415.50 / 30,405.25 (Monthly Center Pivot / Prev Month Close) — The absolute line in the sand for macro bulls. 🚧
29,867.50 (Monthly Mid L) — Immediate HTF overhead resistance for $NQ. 🧗♂️
The 4H Bearish True C Fade Zone: Sitting directly overhead on the Nasdaq tape. ☁️
🟢 DOWNSIDE MAGNETS (SUPPORT):
29,517.75 (4H Equilibrium) — Immediate short-term floor. ⚖️
29,319.75 (Monthly L1) — The immediate macro downside target if the $NQ swoon continues. 📉
28,804.57 (Weekly 8 EMA) — Massive structural defense block. 🛡️ (3/5)
⚙️ SYSTEM INSIGHT: ENGINE & HISTOGRAM BREAKDOWN 🧪
Heading into FOMC, we have massive tension coiling between the Daily and 4H charts on $NQ. Do not trade the noise; wait for the engine to fire. ⚡
The Structural Density Ribbon: 🎗️ On the 4H chart, $NQ has pulled back deep into the Defense Cloud. The fast velocity lines have fused into a massive squeeze. The algorithm is using the Weekly 5 and Weekly 8 (28,804.57) EMAs as the ultimate structural floor. If that floor breaks, the bottom falls out. 🕳️
Histogram Divergence (Daily vs. 4H): 📊 The Daily Engine is in a bearish posture, tracking a deep B-wave defense and applying heavy macro gravity to $NQ. 🪐 Meanwhile, the 4H panels are explicitly printing "LONG SLINGSHOT COILING (FRONT-RUN ACTIVE)". The Fast C-Wave is actively feeding green momentum straight into the teeth of that overhead 4H Bearish Fade Zone. 🟩
The Double True C (God Mode) Catalyst: 👑 The 4H wants to slingshot up, but the Daily is applying heavy downward pressure to $NQ. When Powell speaks, one of these will break. If the 4H successfully drags the Daily momentum with it, the engine will flash a "Double True C" (God Mode). That is your signal the chop is over and the true structural trend is locked in. 🌌 (4/5)
🌊 THE EXECUTION MANDATE ⚔️
Let the 99% gamble on what the Fed is going to say. We do not predict the news; we trade the mathematical reaction on $NQ. 🔢
Expect violent ATR/Keltner band expansions on Wednesday. If $NQ spikes into our Monthly L1 (29,319.75) or snaps up into the Bearish True C Fade Zone on Ghost Volume, look for the exhaustion snap-back. 🔄
$NDX $QQQ #stockmarket #futurestrading #optionstrading #tradingview
tradingview.com/chart/NQ1!/g…
1
1
2
377
Jun 10
The Deep B Interrogation: Where Retail Hopes Go to Die and Algos Load the Cannon. 🪤🩸⏳
We just watched the $NQ shallow defense get absolutely eviscerated. The daily mean was obliterated, and the shallow wave failed exactly like the math predicted. Now, the entire timeline is panicking, screaming about a market crash.
Retail is aggressively shorting the bottom of the flush, thinking it’s a one-way elevator to zero.
They are stepping right into the ultimate institutional processing plant: The Deep B Phase. ⚙️🥩
In the DRW framework, a Deep B isn't just a standard pullback—it is a high-stakes algorithmic waiting room. It is specifically engineered to test the absolute limits of retail psychology. The algorithms deliberately drop their bids and take their feet off the gas, letting the price bleed deeply into heavy macro support levels.
They do this for one specific reason: To read the volume footprint.
During a Deep B, the institutions are interrogating the market to see who is left holding the bag. If retail gets hyper-emotional and starts aggressively selling the bottom, the smart money algorithms use that forced panic-selling as the exact liquidity injection they need to absorb and fill massive buy block orders at a steep discount.
🛑 The Deep B Rules of Engagement:
The Sucker Short Trap: Do not chase the aggressive downward extension bars in the middle of a Deep B. The deeper it flushes into macro support, the more the algorithmic rubber band stretches.
The Silence Footprint: We are looking for the absolute exhaustion of selling volume. We want to see the price drift into the key level on tiny, dead "ghost volume" bars, proving that institutional liquidating has completely dried up.
The Liquidity Sweep Warning: Expect a violent, dual-sided stop hunt. The algos will frequently spike the price below the major floor just to trigger early buyer stops, clean the board, and instantly reverse.
We do not play guessing games in the mud during a Deep B. We let the algorithms run their interrogation, we watch the volume footprint dry out, and we wait for the V8.3 Sniper HUD to lock onto the precise moment the selling stops and the True C-Wave Ignition hooks cleanly out of the trap zone.
Stop panicking with the crowd. The deeper the B, the bigger the potential slingshot on the snap-back.
Let the timeline lose its mind over the red candles. We map the tension, track the alignment, and wait to ride the wave. 📡🌊🏄♂️🐾
#SmartMoneyConcepts #MarketStructure #DeepBWave #DayTrading #OrderFlow #PriceAction #TradingPsychology #FuturesTrading #NQ #TechnicalAnalysis
1
95
Jun 7
The NQ Shallow Defense Just Shattered. Welcome to the Deep 'B' Battleground. 🚨🪤📉
If you've been blindly buying the dips on Tech, wake up. The $NQ Daily chart just underwent a massive structural shift. The daily mean was completely obliterated, and the shallow wave didn't just fail—it was shattered by a textbook algorithmic Slingshot A.
Retail is panicking on the timeline, but structurally, the smart money is simply moving the market toward the ultimate line in the sand: The Deep 'B' Defense. 🎯
How this level reacts will determine the entire macro trend for the rest of the summer. We are either going to mount a massive, violent defense, or we are looking at a macro rollover.
But before the real move happens, expect the algorithms to hunt. There is a high-probability liquidity sweep setting up to flush out early buyers before the true trend ignites.
I just mapped out the exact institutional roadmap, the downside magnets, and the heavy artillery levels (including the massive Weekly 8 / Monthly L2 stack) on #TradingView.
If you want to stop guessing and start surfing the math, do not click 'Buy' until you see these zones. 🧱🌊🏄♂️
Full Chart Breakdown & Master Level Map Below: 👇
tradingview.com/chart/NQ1!/c…
#Nasdaq100 $NDX $QQQ $MNQ #MarketStructure #DayTrading #TradingPsychology #FuturesTrading #optionstrading
1
73
Jun 6
Deconstructing the Weekly Mean Reversion Matrix - $NQ #TradingView
#nasdaq #futurestrading #stockmarket
tradingview.com/chart/NQ1!/5…
2
88
Jun 3
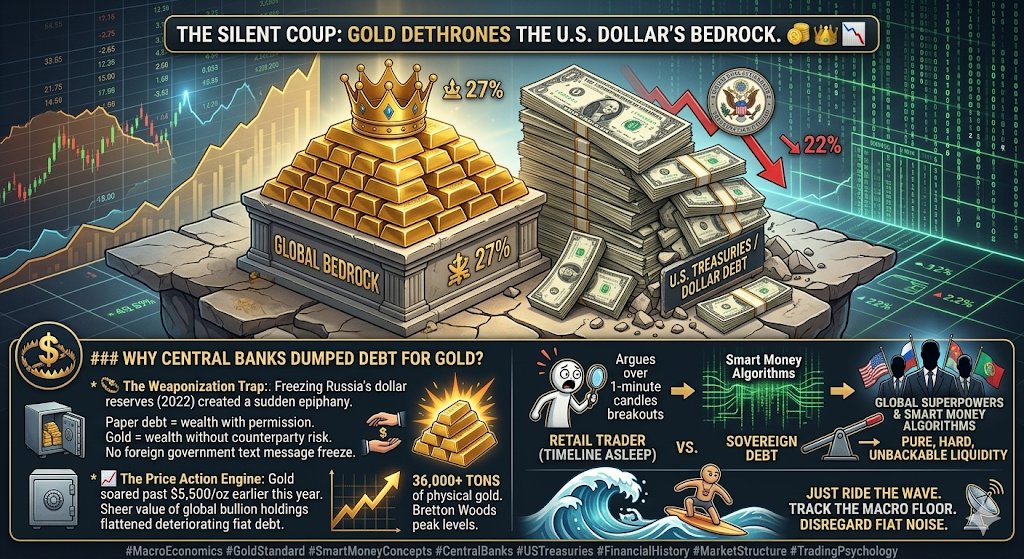
The Silent Coup: Gold Just Dethroned the U.S. Dollar’s Bedrock. 🪙👑📉
The ultimate macroeconomic flip just became official, and the retail trading timeline is completely asleep to what it actually means.
According to a major report just released by the European Central Bank, gold has officially overtaken U.S. Treasuries as the world's leading central bank reserve asset.
Let that sink in. For decades, U.S. government bonds were universally considered the safest, most liquid, and most valuable foundational asset on earth. They were the literal bedrock of global finance.
Not anymore. The Matrix is shifting in front of your eyes.
By the end of 2025, bullion surged to account for 27% of all global central bank reserve assets, while U.S. Treasuries collapsed down to 22%. Central banks are now hoarding over 36,000 tons of physical gold—a massive level of accumulation we haven't seen since the peak of the Bretton Woods era.
Why did the global algorithms dump debt for gold?
🪤 The Weaponization Trap: When Washington weaponized the financial system in 2022 by freezing Russia's dollar reserves, every sovereign nation on Earth had a sudden epiphany. They realized that holding another country's paper debt means your wealth is entirely dependent on their permission. Gold carries no counterparty risk and cannot be frozen by a foreign government text message.
📈 The Price Action Engine: This wasn't just central banks buying more; it was an explosive structural breakout. With gold soaring past $5,500 an ounce earlier this year, the sheer value of global bullion holdings completely flattened the value of deteriorating fiat paper debt.
Retail traders spend all day arguing over 1-minute candle breakouts, completely blind to where the massive, institutional tectonic plates are moving. The smart money algorithms and global superpowers are aggressively rotating out of sovereign debt and sprinting into pure, hard, unbackable liquidity.
The world's central banks are literally telling you they no longer trust the paper system to hold their core value.
Stop trading the fiat noise. Understand the macro floor, track where the true institutional liquidity is hiding, and just ride the wave. 📡🌊🏄♂️🐾
#MacroEconomics $GC $dxy $QQQ $SPY #USTreasuries #FinancialHistory #MarketStructure
75
Jun 1
The Summer Doldrums Secret: If You Don't Know Your Risk Upon Entry, You Are the Liquidity. 🏖️📊📉
Look at the chart from today's session on $QQQ. As we kick off June trading, retail is already panicking about the summer doldrums and fighting the choppy market noise. They see a fast move, chase the green bars blindly, and get absolutely crushed because they have no structural plan.
But look beneath the noise. The institutions aren't guessing—they are mapping precise levels, and the DRW Wave Engine tracks their exact footprint.
The most beautiful thing about trading with mathematical alignment? Knowing your exact risk parameters before you ever click the execution button. 🛡️⚡
Let’s break down the surgical precision of today’s $QQQ setup:
🗺️ The Structural Trap Zone: Notice the clear, defined color-blocked zones on the chart. The green box represents institutional support, while the deep red zone marks the line in the sand—our invalidation level.
🧠 The 21 EMA Alignment: The tape shows the perfect confluence between the micro and macro trend. The 5-minute mean (21 EMA) acts as the immediate structural trampoline, while the 21 EMA from the 30-minute chart anchors the heavy macro floor right beneath it.
🛡️ Surgical Risk Pricing: We don't guess where our stop-loss goes. Today's blueprint offered an exact $.83 cent risk parameter sitting safely beneath the key EMAs and the structural support zone. When your downside is strictly defined to less than a dollar on an index asset, you can size up with pure confidence and zero emotion.
🥩 The Harvest Expansion: Once the algorithmic spring loaded out of that support floor, the price launched straight into Phase 3 expansion—slicing right through the 1 extension level and up to the 1.5 extension ceiling.
Stop overspending on trades with massive, sloppy stop-losses that keep you awake at night. The DRW scanner filters out the mid-year summer chop and hands you clear parameters on a silver platter.
Turn your laptop into a beach command center. Know your risk, wait for the true alignment, and let the market's mechanical blueprint pay you. 📡🌊🏄♂️🐾
#QQQ #MarketStructure #DayTrading #OrderFlow #TradingPsychology #optionstrading #futurestrading $SPY $NVDA
38
May 31
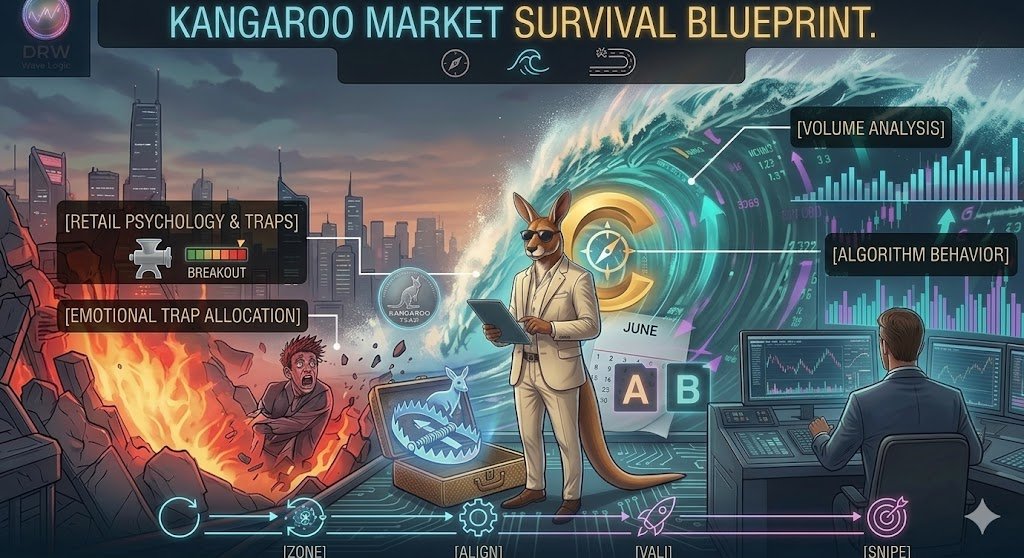
The June Swoon Illusion: Surviving the Mid-Year Kangaroo Trap. 📉🪤🦘
Here we are. It’s Sunday night, we are officially staring down the barrel of June trading, and the financial timeline is already screaming about the historic "June Swoon".
The retail crowd is looking at the mid-year macro shift, completely terrified of summer doldrums and choppy, unpredictable volume. They see a "Kangaroo Market" bouncing violently up and down in a massive range, and their immediate instinct is to start over-trading, trying to force setups in a vacuum.
They are jumping directly into the meat grinder. 🥩❌
During the mid-year rebalance, the institutional algorithms don't just stop trading because it's summer. They alter their parameters. They thrive on the light summer volume because it makes it even easier to engineer dual-sided liquidity sweeps—spiking prices up to trap breakout buyers, then violently slamming them down to hunt retail stops.
If you try to trade a Kangaroo market with static retail indicators, you are going to get your face ripped off on the bounces.
This is the exact card I keep up my sleeve for a mid-year market shift: We stop fighting the chop, and we let the wave map the blueprint. 📡🌊
The June Playbook:
🛑 Embrace the Silence: When volume thins out, standard breakouts fail 80% of the time. Do not chase the initial multi-point spikes (Wave A). Let the algorithms run their fakeouts.
🧹 Isolate the True B-Wave Compression: A wild Kangaroo market creates massive, volatile B-Wave pullback boxes. We don't guess the floor. We wait for the volume footprint to completely dry up, proving that the institutional selling pressure has evaporated.
⚡ Snipe the True C-Wave Ignition: The moment the mid-year rotation finishes, the algorithm steps back on the gas. We wait for the DRW Fast C-Wave Sniper to register a clean structural momentum hook. If it triggers as a Golden C-Wave—backed by a localized volume surge exploding 50% above the average—we ride the expansion.
Let the rest of the timeline panic over seasonal weakness and get chopped to death trying to navigate the kangaroo bounces.
We don't gamble on the summer direction. We map the tension, track the alignment, and just ride the wave. 🌊🏄♂️🐾
#JuneSwoon #MarketStructure #DayTrading #TradingPsychology #FuturesTrading #optionstrading $CRWV $PLTR $QQQ $NQ
1
26
May 27
🚨 THE LAB: THE MONETIZATION WALL & THE AI CAPEX TRAP 🚨
Retail is on the timeline debating if the AI bubble is about to burst like 2000.
They are looking at the wrong data.
This isn't a dot-com crash; it’s a CapEx Cannibalism Regime. While retail buys the hype, institutions are mapping the monetization wall. Here is the blueprint. 🧵👇
🧱 1/ THE MONETIZATION WALL
For the last few years, the market rewarded any mega-cap tech company that screamed "AI" on their earnings calls. But we are deep into 2026, and the bill has come due. Wall Street is no longer asking "How much are you spending on AI infrastructure?" They are asking "Where are the revenues?" The gap between infrastructure spending and actual enterprise software monetization is a massive structural fault line.
💸 2/ CAPEX CANNIBALISM
Look at the mega-caps (NQ). They are trapped in a prisoner's dilemma. If Nvidia prints the chips, Microsoft, Google, and Meta must buy them to avoid falling behind. They are pouring tens of billions every quarter into data centers and compute power. This isn't organic growth; it's defensive capital expenditure. They are cannibalizing their own free cash flow just to maintain their moat.
🎰 3/ THE RETAIL LIQUIDITY TRAP
Retail looks at a 5% drop in tech and screams "The bubble is popping, time to short!" They get aggressively short, and then an algorithmic sweep steps in and squeezes them out. Why? Because institutions aren't panic-selling. They know these mega-caps are trillion-dollar inflation life rafts with massive balance sheets. The market isn't going to crash to zero; it’s going to consolidate violently as capital rotates from infrastructure (hardware) to execution (software/applied AI).
🧬 4/ THE DRW REGIME PROTOCOL
In The Lab, we don't guess if the "bubble" is popping today or tomorrow. We don't trade macro opinions.
We trade the mathematical reality of the High-Timeframe Mean.
When CapEx anxiety hits the news, it creates massive, erratic intraday expansions. That volatility isn't a threat; it’s our premium. We let the news-driven retail traders chase the intraday momentum, while we sit at the HTF standard deviation floors and collect the mean reversion.
🛡️ 5/ THE BOTTOM LINE
Stop trying to time the "top" of a structural shift. The money isn't made in predicting the crash; it’s made in trading the volatility of the transition.
Leave your emotional bias at the door. Become the architect.
#marketstructure #TradingTips #StockMarketNews #optionstrading #futurestrading $QQQ $NQ $SPY $NVDA
1
24
May 24
The Anatomy of a Momentum Trap: Why Most Breakouts are Engineered to Fail. 🪤🩸❌
We've all done it. You see a sideways consolidation box on your chart, a massive green candle explodes out of the ceiling, your FOMO redlines, and you slam the "Buy Market" button. You think you’re catching a runaway rocket ship.
Then, the volume instantly dies. Price stalls, drifts sideways, and slowly bleeds back down, cutting your account to pieces in a brutal chop zone. 📉💸
The cold, hard truth? Institutional algorithms frequently manipulate prices higher just to trigger your buy-stops. Your forced buying creates the exact liquidity they need to fill their large sell orders. The breakout wasn't real—it was a trap.
You cannot navigate an institutional market using lagging retail indicators. You cannot hide from the wave.
If you want to survive the chop, you have to master the market's natural breathing cycle: The True C-Wave Ignition. 🏆🌊
Here is the exact algorithmic blueprint:
💨 Wave A (The Impulse): The initial, aggressive institutional surge that breaks out of the range. This dictates the macro trend. Rule #1: We never trade Wave A. We don't chase the initial FOMO push.
🔍 Wave B (The Interrogation): The low-volume pullback. This is where we watch the footprint. If the market pullbacks on tiny, pale "ghost volume" bars, the big money is ignoring the drop—the rubber band is simply coiling.
⚡ Wave C (The Ignition): The holy grail. The pullback exhausts itself, the smart money steps back on the gas, and momentum hooks cleanly back in the direction of the macro tide.
When the system triggers a Golden C-Wave, it means a localized volume spike has exploded 50% above the moving average the exact millisecond the momentum hooks. The algorithm isn't guessing—the institutional tide is moving. 📡🏄♂️🐾
Stop trying to guess the bottom of a pullback or chase the tip of a topping box. Watch the full breakdown below to see exactly how to spot the silence, time the hook, and ride the expansion. 🧵👇
#MarketStructure #abcwavelogic #stockmarkettrader #futurestrading #daytrading $NQ $QQQ $NVDA #trading
1
27
May 21
The Market is a Breathing Organism. Stop Trading the Noise, Track the Cycle. 🌊📡❌
Most retail traders look at a 5-minute candlestick chart and see a casino. They chase every aggressive green bar, draw 40 conflicting trendlines, and get chopped to pieces trying to guess the next move.
The cold truth? The institutions moving the tape don’t care about your chart patterns. Their algorithms are strictly programmed to trade two metrics: Momentum and Time. ⚙️⏱️
If you want to survive the chop, you have to understand the market's breathing cycle: The DRW ABC Wave Logic.
Here is the breakdown of the cycle:
Wave A (The Impulse Trap): Momentum violently crosses the zero line, pushing price past obvious resistance. Retail FOMOs in, thinking they caught the trend. In reality, it’s a setup. Market makers use this brief surge to collect your buy orders, reverse the price, and trap the late buyers. Rule #1: Never trade the A-Wave. 🪤💸
Wave B (The Decay Phase): The algorithms lift their foot off the gas. This is the institutional interrogation room. We watch the volume footprint. If the price pulls back on tiny, "ghost" volume, the big players are ignoring the drop—it’s a safe, structural reset. If they pull back on heavy volume, the trade is dead. 🔍🛑
Wave C (The Ignition Point): This is the holy grail. The pullback ends, volume rushes back in, and momentum hooks cleanly back in the direction of the macro tide. This isn't a guess—it's a mathematically confirmed entry aligned directly with institutional order flow. ⚡🏆
Stop fighting market volatility. Stop letting the candle noise dictate your emotions. Map the breathing cycle, wait for the B-Wave interrogation to clear the risk, and ride the institutional wave.
Watch the full breakdown below to see exactly how the footprint is built. 🧵👇
#MarketStructure #DayTrading #AlgoTrading #TradingPsychology #FuturesTrading #optionstrading #stockmaket $NVDA $QQQ $NQ $ES_f
60
May 20
⚠️ The Market Split Illusion: They Chased the Highs, They Got Swallowed by the Rebalance. 🪤🩸❌
Let’s talk truth. The major indexes just printed historic records—S&P 7,500 and the Dow clearing 50,000. Retail went absolutely wild. The FOMO crowd saw the green marubozu breakout candles, slammed the "Buy Market" button on tech, and declared themselves geniuses.
Then came the cold, hard pivot. 📉
Over the last few days, the tech and semiconductor giants started dripping blood. A heavy, multi-day profit-taking rebalance completely flattened the over-extended bulls. While retail was busy aggressively buying the top of a lagging breakout, the institutional algorithms were quietly rotating capital, leaving standard indicators totally confused.
You can’t navigate an institutional rebalance with a lagging MACD or a basic retail EMA. You cannot hide from the wave.
This is where we pull the ultimate card up our sleeve: The Golden C-Wave Ignition. 🏆🌊
We don't buy the blind, over-extended highs. We map the structural tension and wait for the precise moment of institutional entry.
The Golden Blueprint for the Current Split:
Identify the Rebalance Trap: Let the market print its fakeouts. Let retail panic as tech bleeds out and sectors split. We isolate the structural floor. 🏢
Track the Hidden Footprint: A standard C-Wave tracks the micro-structural momentum hook. But in a high-stakes market split, we demand the GOLDEN filter.
The Golden C-Wave Strike: The system explicitly requires an extreme, localized volume spike—exploding 50% above the moving average—the exact millisecond the wave structure hooks out of the correction zone. ⚡🏆
When the volume footprint matches the structural hook, the algorithm isn't guessing. It means the smart money has finished its rotation, stepped on the gas, and activated Phase 3 structural expansion.
Stop getting chopped trying to pick a bottom or chase a topping breakout. Let the market rebalance, let the algorithms filter the noise, and snipe the Golden alignment. 📡🌊🏄♂️🐾
#MarketStructure #GoldenCWave #abcwavelogic #DayTrading #optionstrading #futurestrading #TradingPsychology #stockmarkettrading $NQ $QQQ $NDX #tradingview
25
May 18
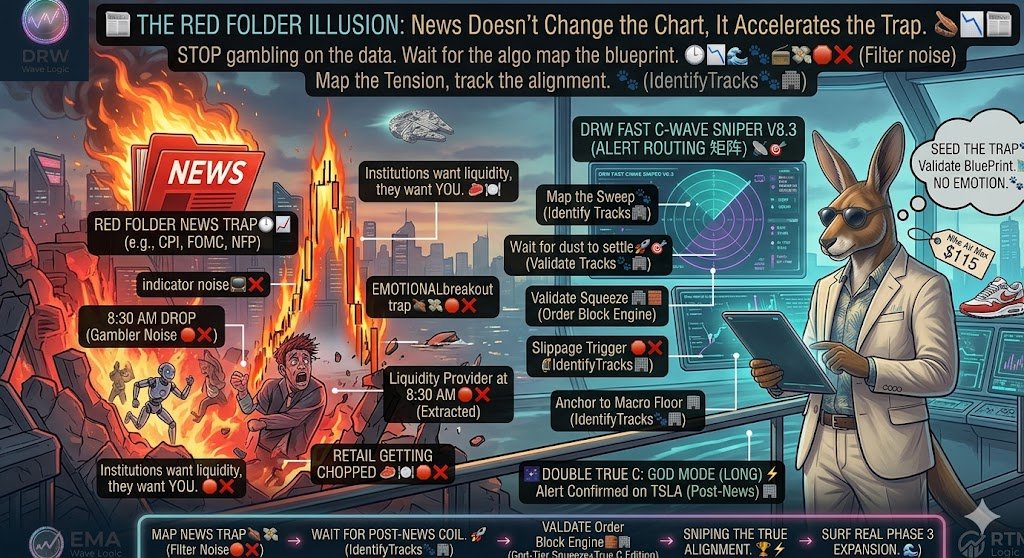
The Red Folder Illusion: News Doesn't Change the Chart, It Accelerates the Trap. 📰🪤📉
Retail traders treat high-impact news days (CPI, FOMC, NFP) like a trip to Vegas. At 8:29 AM, their adrenaline is peaking. They bracket their orders, hoping to catch the massive 1-minute breakout.
10 seconds after the release, the chart prints a massive "Darth Maul" candle. It violently spikes up, sweeps their buy stops, violently crashes down, sweeps their sell stops, and triggers massive slippage. They blow their accounts in 15 seconds, staring at the screen wondering how the data was "bullish" but the market tanked. 🎰💸❌
Here is the trick I keep up my sleeve: The institutions don't care about the actual number. They care about the liquidity. 🥩🍽️
The smart money algorithms have already mapped the structural destination days in advance. They use the panic and FOMO of the retail crowd during a "Red Folder" event as the forced liquidity injection required to execute their massive block orders. The news is just the fuel for the trap.
The DRW Post-News Playbook:
🛑 Step Away from the Casino: We do not trade the 8:30 AM drop. We let the algorithms run the dual-sided liquidity sweep.
🧹 Map the Sweep: We watch the initial volatility deliberately take out the weak highs and weak lows. We let the dust settle.
⚡ Snipe the True Alignment: Once the emotional retail volume is completely extracted, the true trend resumes. We wait for the V8.3 Sniper HUD to lock onto the post-news True C-Wave Ignition.
You can either be the liquidity provider at 8:30 AM, or you can be the sniper who steps in at 8:45 AM to surf the real structural expansion.
Stop gambling on the data. Wait for the algorithms to anchor the structure, then snipe the escape. 📡🌊🏄♂️🐾
#daytrading #futurestrading #optionstrading #marketstructure #stockmaket $NQ $QQQ $SPY
39
May 16
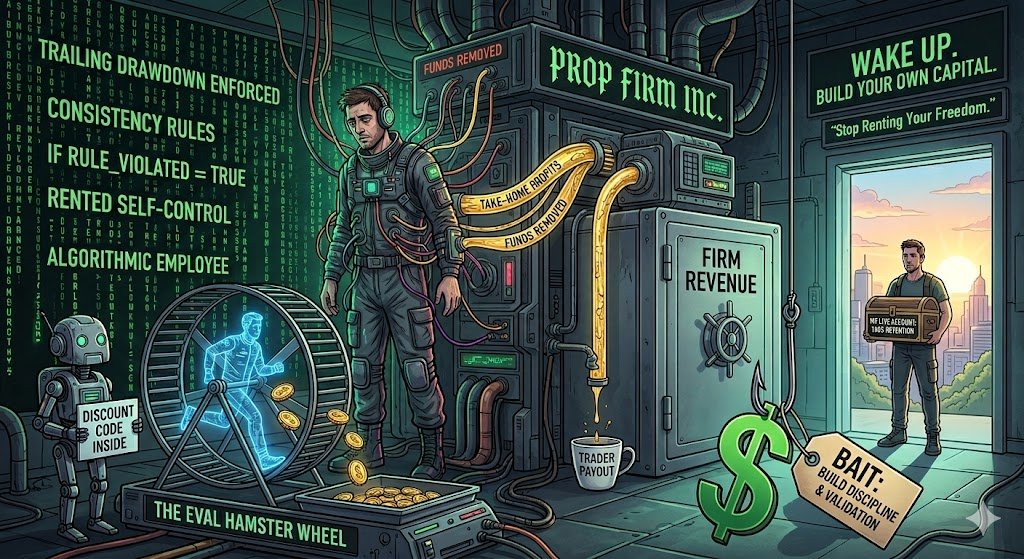
The Prop Firm Matrix: You aren't milking them. They are milking you. 🪤💊
Everyone starts with the exact same logical idea: "I’ll use a prop firm to build discipline and validate my strategy without risking my own capital." That is a perfectly valid entry point. That is the bait.
But somewhere down the line, you got sucked into the Prop Firm Matrix. You brag on the timeline about "milking" the firm, completely blind to the cold, hard truth: The prop firm is your daddy. 🏢🥩
Let’s break down the reality of your "financial freedom":
💸 The Payout Illusion: If you are a consistently profitable trader, why are you sharing 10% to 20% of your hard-earned upside? True wealth is 100% retention. It is about "doing for self."
🔄 The Eval Hamster Wheel: Every time you hit a drawdown limit and buy a new evaluation, the firm prints money. The affiliate pumping their discount code on the timeline gets a percentage. You are the infinite liquidity funding their marketing engine.
🛑 The Risk Management Trap: Prop firms don't enforce trailing drawdowns, consistency rules, and daily loss limits because they want to help you. They enforce them because the average retail trader is too damn lazy to think logically about risk management on their own. You are essentially paying a monthly subscription fee just to rent basic self-control.
You got into this game to be your own boss, escape the 9-to-5, and achieve ultimate freedom. Yet here you are, stressing over arbitrary rules, terrified of hitting a trailing drawdown, and sharing your payouts like an algorithmic employee. You traded one master for another.
Use them to learn the ropes. Use them to build your initial bankroll. But if your endgame isn't transitioning to your OWN live, personal brokerage account where you make the rules and keep 100% of the harvest... you are still asleep in the matrix.
Stop renting your freedom. Wake up. Build your own capital. 🌌🐾
#TradingPsychology #PropFirms #DayTrading #RiskManagement #FinancialFreedom #FuturesTrading #MarketStructure $NQ $ES
1
49
May 13
The Cold Truth: Momentum Without Volume is an Engineered Trap. 🪤💸
Retail traders love to trade ghost moves. They see a lagging MACD cross or a tiny break of a trendline on absolutely zero volume, and they slam the "Buy Market" button. 15 minutes later, the algorithms reverse the price, sweep their stops, and collect the liquidity. 🥩🍽️
If institutional capital isn’t stepping on the gas, you aren't in a trend—you are in the chop.
Enter the Golden C-Wave. 🏆🌊
This isn't just a structural momentum hook; it is the ultimate validation of the institutional footprint. 🐾🏢 Our system tracks the micro-structure, but the Golden filter acts as the absolute gatekeeper. It explicitly demands an extreme localized volume surge—greater than 50% above the moving average—precisely at the millisecond the C-Wave structure ignites.
Here is how we filter the fiat distraction:
Standard C-Wave: The structural alignment hooks. We watch. 👀
Golden C-Wave: The structure aligns AND institutional capital kicks the door down. We execute. ⚡🏆
If there is no massive volume surge confirming the hook, it’s just retail noise. Let the FOMO crowd trade the fakeouts and bleed out their options premium. We sit on our hands, map the structure, and wait for the Golden confirmation.
Stop guessing if the breakout is real. Track the volume footprint. Snipe the Golden Wave. 🌊🏄♂️🐾
#MarketStructure #DayTrading #abcwavelogic
#futurestrading #optionstrading $NQ $QQQ
23
May 9
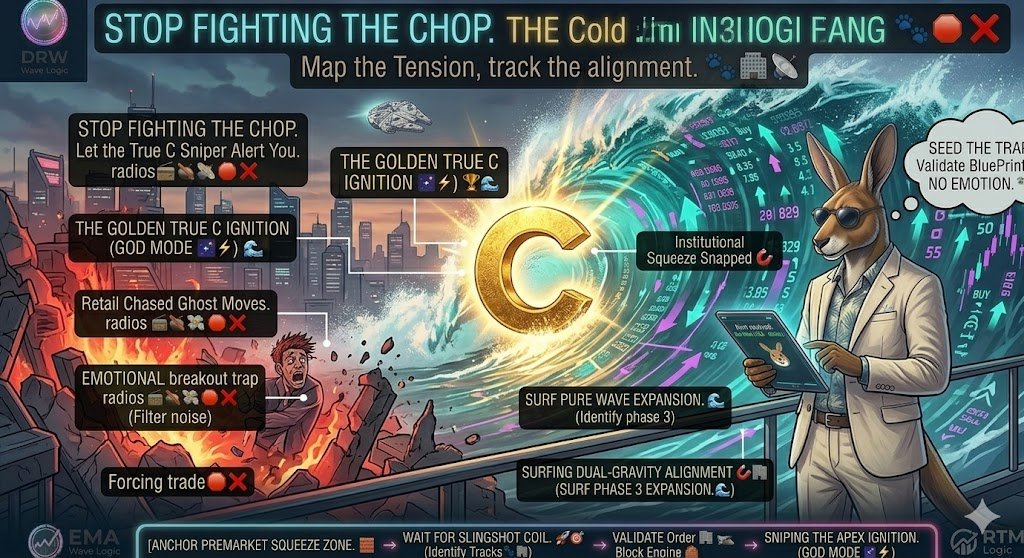
The Opening Bell Illusion: Re-Mapping the institutional Squeeze. 🔔🪤📉
Retail traders love the 9:30 AM market open. They see the initial green candle, their adrenaline spikes, and they slam the "Buy Market" button, terrified they are going to miss the move of the day.
But this isn't opportunity. It’s an ultimate trap, engineered by AI algorithms to convert retail hope into institutional liquidity. The Opening Bell is no longer price discovery; it is an engineered liquidity sweep. Why would you fight that manually? 🧹🛑📡
The Engineered Trick: The institutions deliberately engineer a violent, high-momentum push in the wrong direction [cite image_166.png] right at the opening bell. They are simultaneously triggering stops on correct overnight positions and trapping emotional "breakout" traders who chase repainting morning candles. 🪤💸🛑❌ (Chop-Zone Distraction)
Once retail liquidity is fully extracted, the trap closes. The algorithms anchor their hidden Old School Order Blocks, and the market violently reverses into the true structural trend for the day. If you are trading this manually, you aren't trading—you're volunteering to be opening-bell exit liquidity. 🥩🍽️
Our Automated Playbook: The Beach Command Center. 🌊🏄♂️🐾📊
We don’t watch the opening bell. We let our automated DRW system [cite image_220.png the beach environment command center] do the heavy lifting [cite progress bar at bottom]. While the retail timeline is in chaos, our Algo is already:
Filtering Lagging Noise, repainting heatmaps, and Fiat distractions. 📻🪤💸📺❌
Automatically identifying intrinsic footprints and Validating Tracks🐾🏢 (Validate footprint).
Validating hidden Old School Order Blocks🏢🧱 (Anchor structure).
We sit on our hands. We let the AM illusion play out [cite image_220.png Kangaroo's confident relaxation]. We wait for the automated system to filter the noise and deliver the high-probability Front-Run Squeeze or True C Ignition Alert [cite image_220.png prominent alert text] before engaging. Only then do we strike. ⚡🌟🏢
Only after the automated structural confirmation fires, we execute a final human verification checklist on pre-filtered data:
Signal Confirmed? (Check)
Validate Footprint/Tracks🐾🏢 (Validate tracks)?
Define Optimal Liquidity Zone🧲?
Confirm Dual-Gravity Alignment🧲?
Map the automated blueprint. Seed the trap without emotion. LET THE SYSTEM ALERT YOU. STOP HUNTING EARLY. The true setup is worth the wait. Catch the real wave systematically. 🌌📉🐾📊📡
#MarketStructure #SmartMoneyConcepts #AlgoTrading #DayTrading #swingtrading #tradingview
#stockmarket $NQ $QQQ $TSLA $SPY
1
50
May 6
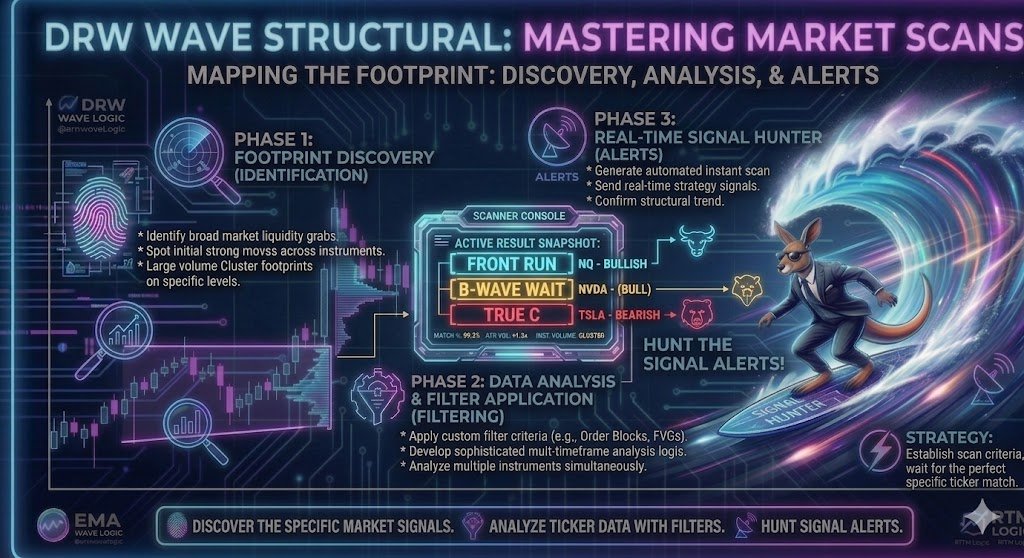
Stop Scrolling. Start Scanning. The 3-Phase Structural Blueprint. 📡🌊
Retail traders burn out staring at 1-minute charts, trying to force setups out of sheer boredom. By the time their lagging indicators flash, the move is over, and they've just become exit liquidity.
The smart money doesn't guess, and they definitely don't stare at the screen all day. They build a system. They map the footprint. 🐾🏢
Here is the exact 3-Phase DRW Wave Structural Blueprint to stop forcing trades and start hunting high-probability signals:
Phase 1: Footprint Discovery (Identification) 🔍
You can't surf a wave you don't see forming. Before we ever look for an entry, we are scanning the broad market for massive volume clusters and institutional liquidity grabs. We spot the initial, structural momentum while retail is still debating the news.
Phase 2: Data Analysis & Filter Application ⚙️
Seeing a move isn't enough; you have to validate it. This is where we filter out the algorithmic noise. We apply strict, custom criteria—validating Order Blocks, mapping Fair Value Gaps (FVGs), and demanding multi-timeframe confluence. If the structure doesn't align, we step aside. Let the FOMO crowd trade the chop. 🛑
Phase 3: Real-Time Signal Hunter (Alerts) 🎯
We define the exact structural criteria, set the trap, and walk away. The scanner does the heavy lifting, delivering automated, real-time alerts only when the true structural trend is confirmed.
Look at the Active Console Snapshot:
🟢 FRONT RUN (NQ - Bullish): Catching the ignition before the breakout.
🟡 B-WAVE WAIT (NVDA - Bull): Recognizing the algorithmic pause. We sit on our hands and let the options premium bleed out until the structure is ready.
🔴 TRUE C (TSLA - Bearish): The God-Tier alignment is locked. The trap is sprung.
You can either spend 8 hours a day fighting the noise, or you can build the scanner, filter the fiat distraction, and just wait to surf the pure Phase 3 expansion. 🏄♂️🌊
Hunt the signal. Master the wave.
#MarketStructure #AlgoTrading #DayTrading #TradingPsychology #stockmarket $TSLA $NQ $NVDA #trading
48
May 2
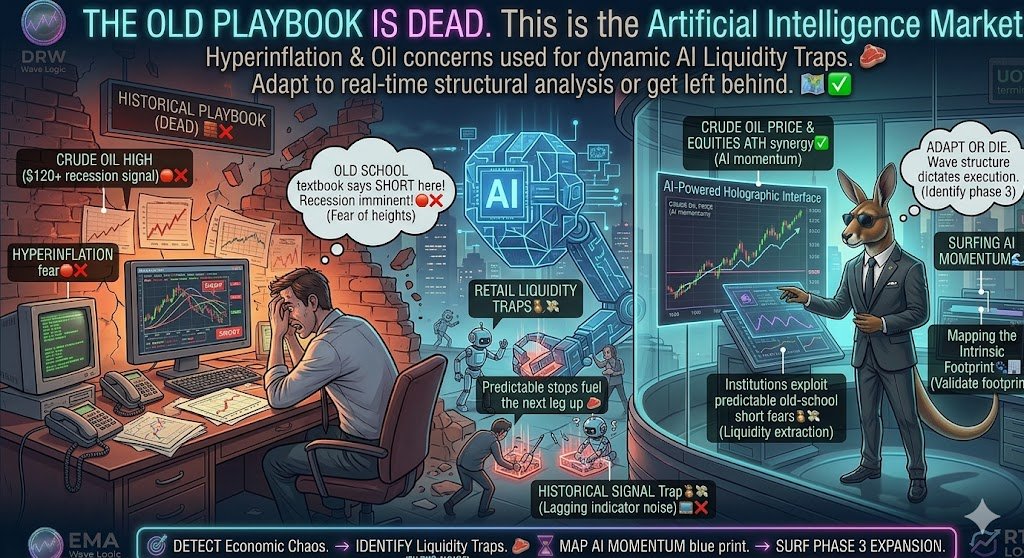
The Old Playbook is Dead. In an AI-Driven Market, Historical Signals Are Now Liquidity Traps. ⚠️📉
Let’s talk about the cold truth staring everyone in the face right now.
We are seeing a convergence of factors that, in any previous era, would have signaled an absolute market meltdown:
Hyperinflation concerns are dominating the macro narrative, eroding purchasing power and consumer sentiment.
Crude Oil prices are soaring, historically a precursor to recession.
Yet, the Equity Markets are hitting All-Time Highs. 📈
If you are an "old school" trader relying on textbooks and historical analogies, your intuition is screaming at you to short this market. You see a bubble ready to burst, a classic decoupling from economic reality.
Here is the cold, hard reality you are ignoring: This is not your grandfather's market.
You are not trading against people anymore. You are trading against algorithms, machine learning, and Artificial Intelligence controlled by major institutions. And guess what? AI doesn't care about "signals" from 1970 or economic theories on inflation.
AI trades on liquidity, real-time data flows, and relentless momentum.
institutions are using AI to exploit the very "fear" that old-school indicators create. They see your textbook short setups as clusters of predictable stop-losses—easy liquidity fuel to push the market even higher.
The AI market doesn't "fear" hyperinflation; it processes volatile data points in nanoseconds and repositions for maximum extraction. While you are trying to rationalize the market's behavior based on outdated rules, the AI is already executing thousands of trades based on the actual flow of money.
Adapt or get left behind. It's that simple.
Trying to fight this AI-driven momentum using intuition from a bygone era is a guaranteed way to become exit liquidity. Your job isn't to predict what the market should do based on history; your job is to understand what the institutional algorithms are actually doing right now.
Rely on structural analysis. Rely on order flow. Rely on the intrinsic blueprint of the market, not historical sentiment.
The game has changed. Make sure you are playing by the new rules.
$NQ $ES $QQQ $SPY $CL #stockmarkettrading #inflation #mindset #AIBoom #macroeconomics
1
34
Apr 30
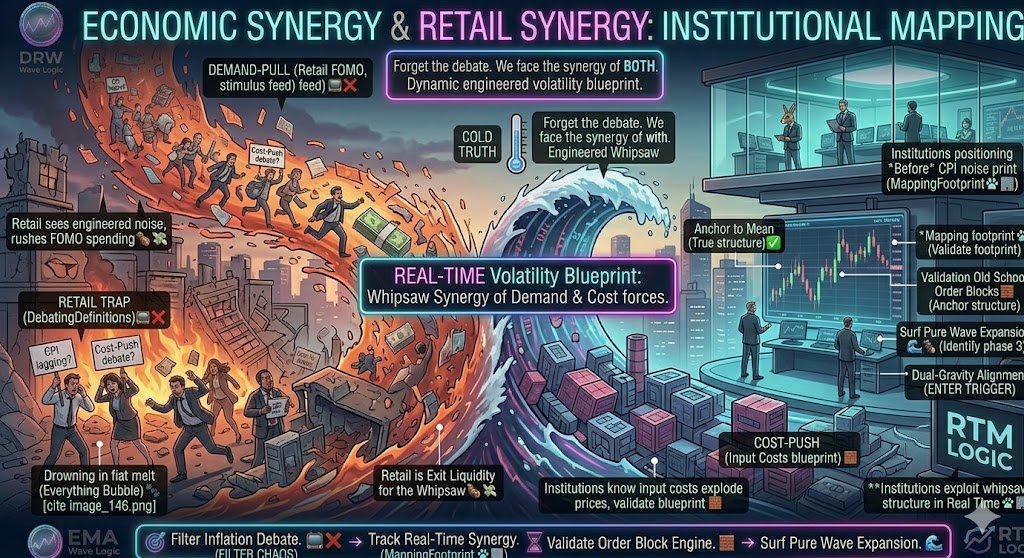
The financial news cycle is making a massive amount of noise debating whether we are facing Demand-Pull Inflation (too much money chasing too few goods) or Cost-Push Inflation (rising input costs like energy and wages driving up prices).
Here is the cold, institutional truth that the talking heads are ignoring: It doesn't matter which one "started it." In real time, we are facing the synergy of both, and the algorithms are leveraging this volatility blueprint.
While retail traders debate economic theory, the smart money is busy mapping how this dynamic shapes the internal market structure.
Here is how the professional side views the "debate":
Demand-Pull: This is the engineered noise. Retail sees higher wages or stimulus and rushes to spend, bidding up prices based on FOMO . The institutions see this as short-term liquidity that fuels the initial waves.
Cost-Push: This is the structural blueprint. Institutions know that when energy, materials, and supply chain costs explode, prices must go up, regardless of consumer demand. They use this data to validate their Old School Order Blocks and anchor their macro projections.
The result isn't a simple choice between two definitions; it is an engineered whipsaw. If you are basing your trades on lagging CPI data or waiting for the media to decide which "type" of inflation we have, you are already exit liquidity for the institutions mapping the footprint in real time.
Stop looking at the definitions and start mapping the structural response to the synergy. Master The Wave logic [cite image_152.png] and track where the big money flow is positioning before the next inflation print creates the noise.
#MacroEconomics #DayTrading #TradingPsychology #Inflation #MarketStructure $NQ $QQQ $ES $SPY
1
1
26
Apr 25
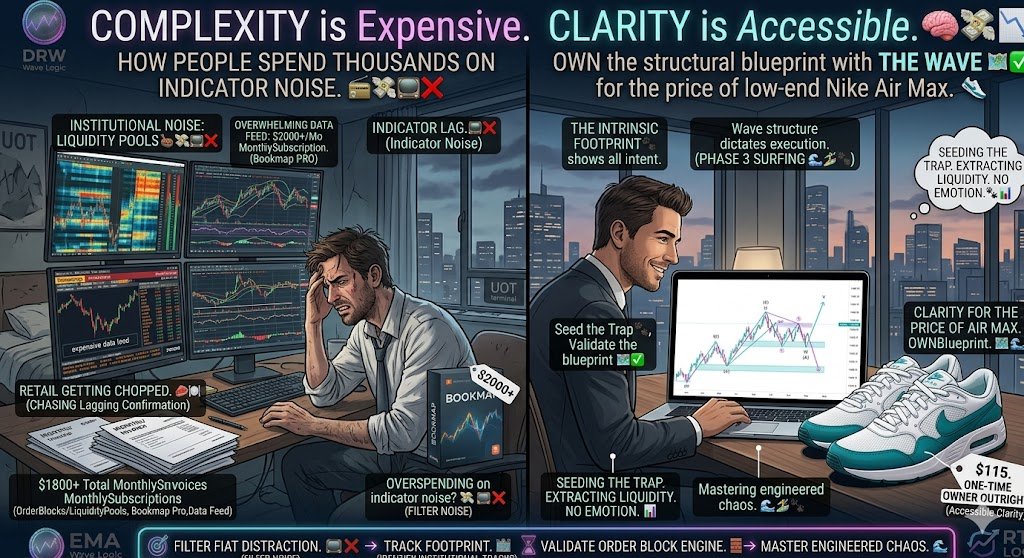
Post Title: Complexity is Expensive. Clarity is Accessible. 🧠💸📉
Here is the inconvenient truth retail traders ignore: You are overspending on data you don’t understand, hoping it will replace the skill you haven’t built.
Thousands of dollars per month are being funneled into expensive, clunky institutional data feeds.
You're buying subscriptions for:
🚫 Pro-level Bookmap diagrams that look like abstract art.
🚫 Hidden Liquidity Pool trackers that only show you where you already got stopped out.
🚫 "Secret" Order Block indicators that repaint.
All this data, just to feel like you’re in control while you’re actually lost in the noise. It's a massive, engineered trap designed to keep you feeling busy instead of feeling profitable.
The Contrast: A simple, powerful truth that institutions and indicator-sellers don't want you to know.
You can cut through 90% of the noise, stop getting chopped, and start seeing the true, predictive market structure…
...for the price of a pair of low-end Nike Air Max. 👟
Think about it. The cost of one monthly indicator subscription could buy you the foundational system you need to own outright.
Stop chasing the "golden indicator" noise. Master The Wave. Simplify your process.
Ready to trade with clarity? The Wave shows the blueprint. The low-cost option might just save your account.
#TradingTips #MarketStructure #SmartMoneyConcepts #DayTrading #abcwavelogic #TradingPsychology #FinancialFreedom #OptionsTrading #futurestrading $NQ $ES
1
23