
Sierra Chart is a professional desktop Trading and Charting platform for the financial markets.
Joined February 2010
- Tweets 849
- Following 95
- Followers 5,434
- Likes 9,222
3 Photos and videos
SierraChart retweeted

May 21
Other than scalping rotations off orderflow activity, it’s been a session to forget.
$ES
24
8
145
9,518


SierraChart retweeted

short time frame momo has it pawprints all over this market. Maybe things loosen up a bit after opex.
4
2
44
2,398
SierraChart retweeted

May 7
If you use Sierra Chart there are two must change settings that radically improve the charting experience.
1) Mouse scroll wheel changes spacing
2) Free hand charts crosshair
I provide steps for both in the posts below. Try these changes out!
8
11
118
10,079
SierraChart retweeted
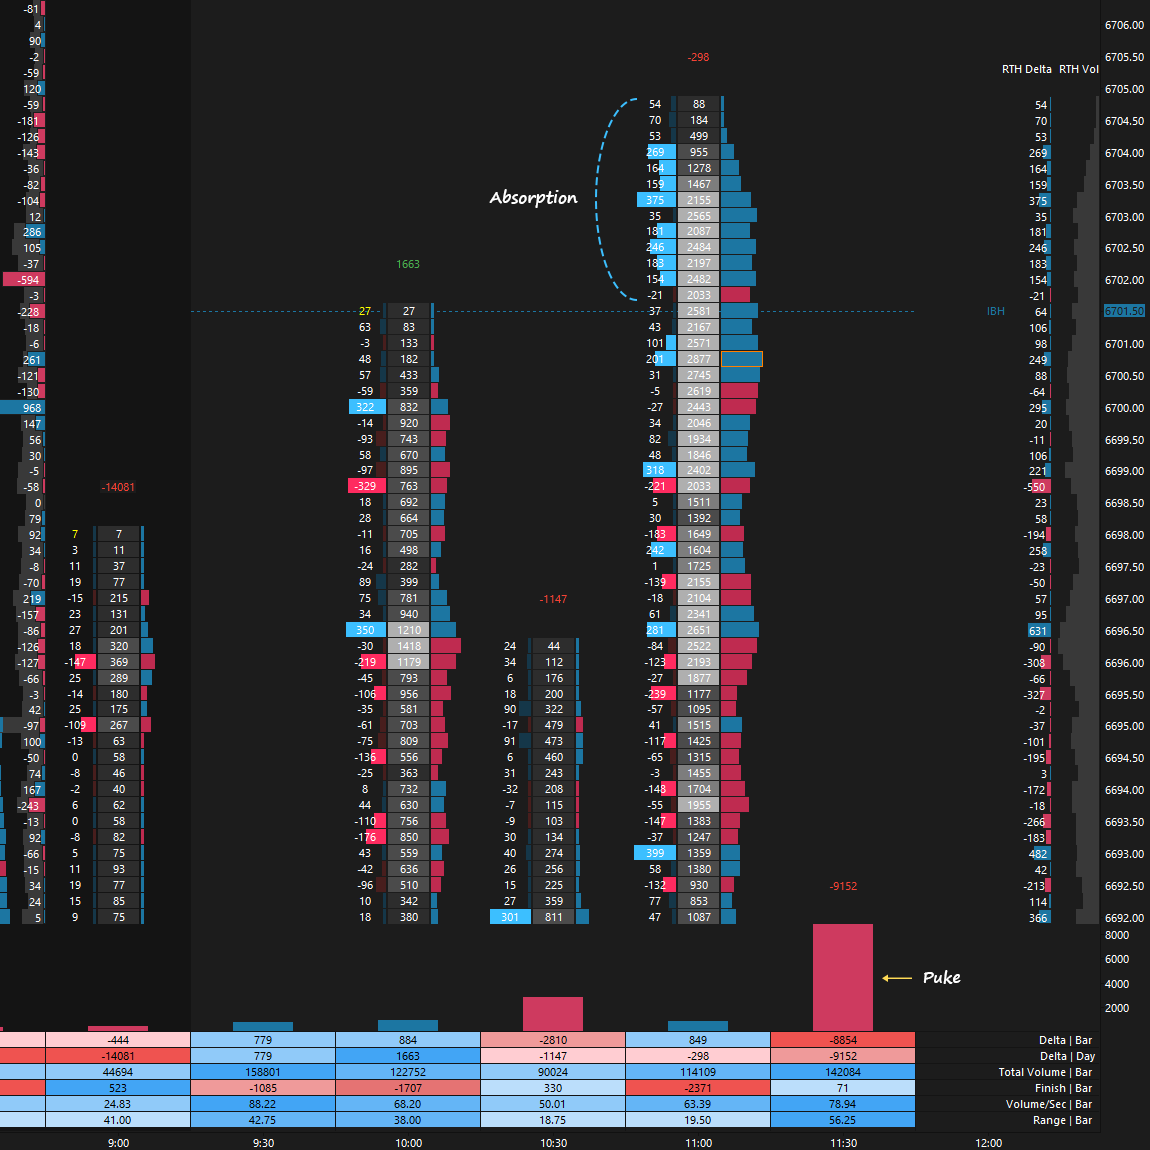
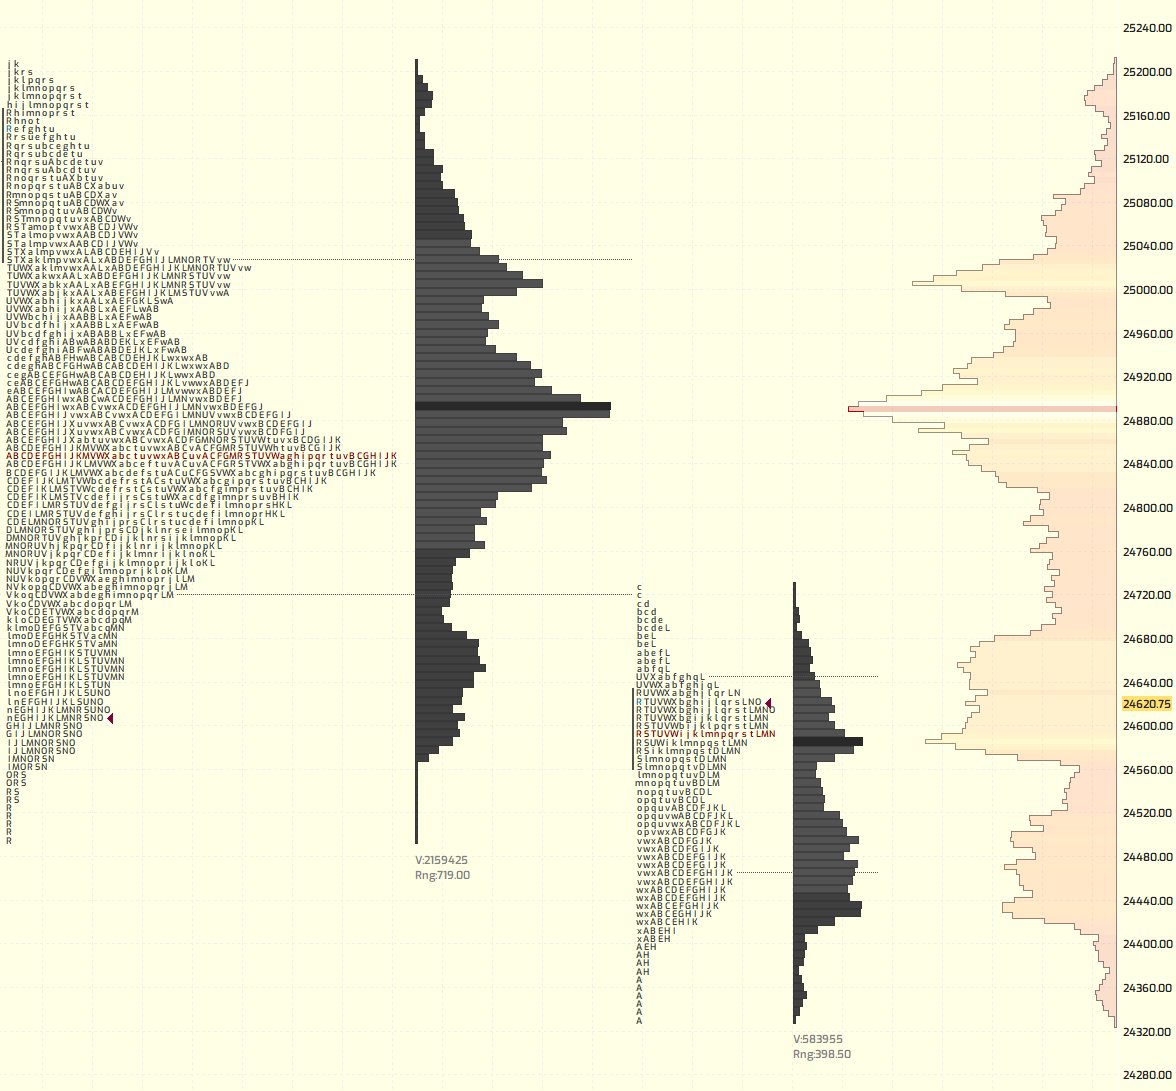
Absorption is when the market moves directionally, then stalls or goes sideways even though there is strong delta behind the move.
In this example, the market may show a lot of positive delta, meaning aggressive buyers are lifting offers, but price is not moving higher. This usually means passive sellers are absorbing that buying pressure by reloading offers on the DOM.
So the question is:
How can we build so much positive delta without price moving higher?
12
18
264
14,642
SierraChart retweeted

Apr 29
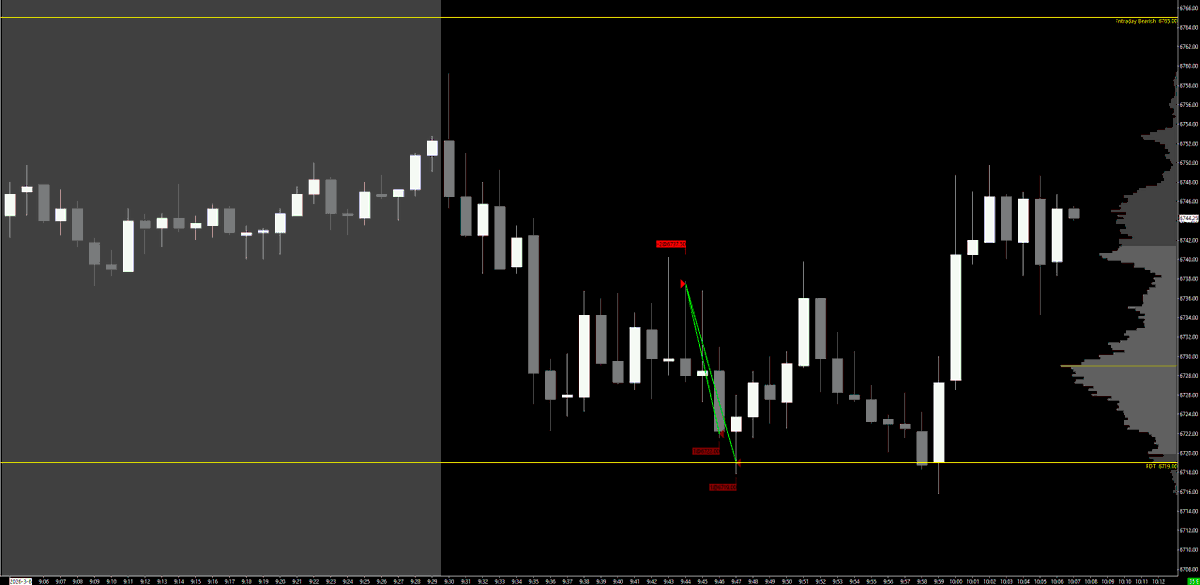
$NQ April 29th Pre-FED
Fitting for the article I posted today
Heavy failure initially at 27,310 with heavy flow to hold the offer, lower highs? Around the 27,290 GEX Major Call Wall.
Looking for selling to hold a few rotations and sustain the move lower, one of the few times news helped.
4
56
4,128

SierraChart retweeted
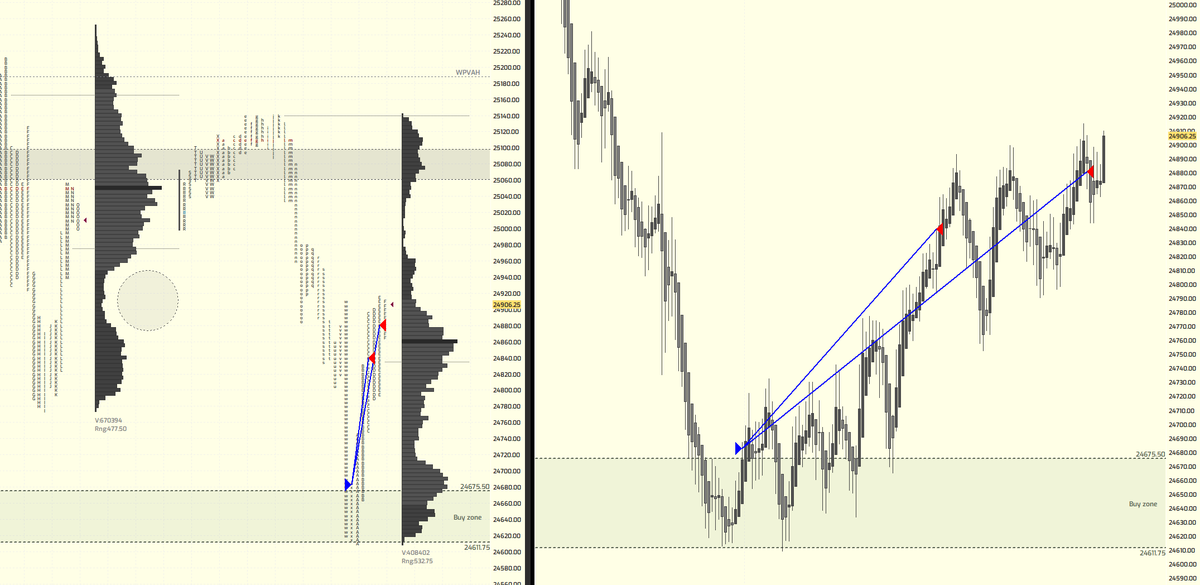
Mar 23
Today's initial balance breakout attempt, after an already stretched 200 handle move from the overnight low
#ES_F
8
11
117
9,762
SierraChart retweeted

Mar 22
All TFs OTFD. Longs are trapped. Watch for the puke.

4
82
5,905
SierraChart retweeted
2/12 $ES
older replay and I have an hour long video explaining sell off days. engrave this kind of tape in your head if you struggle on uptrend/downtrend days.
focus on what actually happens VS numerical order flow data. either aggro/passive
7
17
151
11,849
SierraChart retweeted

Mar 6
Done here for the day gentlemen ✅. It's very important that with this volatility you manage risk and adjust it accordingly.
Took my points from the market and I am done. Week has been tough analysis wise, not execution wise. Just could not get a proper read or feel of the market so missed out on great opportunities in hindsight.
Today's trade definitely that confidence booster I needed to end the week.
Sometimes it's all about taking a step back to take a bigger one forward!
Great weekend to all and to all my Ferrari fans, let's hope its an amazing one.
2
11
1,845

SierraChart retweeted

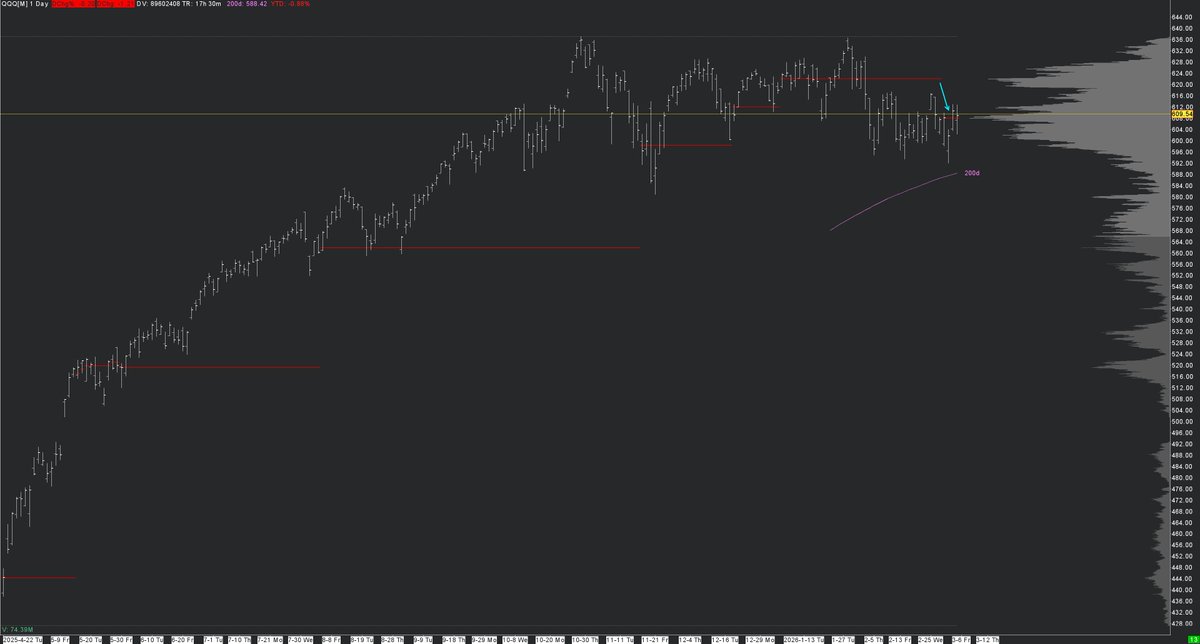
Mar 6
Developing VPOC, QQQ Edition
Unlike $SPY's developing VPOC saga (x.com/XennialTrader/status/2…) , $QQQ has spent 20 days below its dVPOC (formerly 622), and has now shifted down to 608. It's developed enough over the last few days to call it a meaningful shift lower.
We closed above 608 today but closes really don't matter. I have the data to quantify that, but just look at a chart to convince yourself.
If 5 months / 100 trading days of sideways action wasn't obvious enough, this quantifies a bit more that we indeed have a two-way market, and on top of it, that we are accepting lower prices than we were a month ago.
What does this mean going forward? Let me wet blanket my own post and say, it doesn't imply that we will immediately get lower prices.
A retest of the higher former dVPOC at 622 is very much in play. Even trading above that would not be surprising.
An ideal short setup that has a VERY high percentage of working would be a push to new ATHs, call it QQQ 645 / NDX 26500 or so, and then a sell back to and through 608 (NDX 25K). I know it hurts to imagine that drawn out scenario, but if we get that, I will actually swing short this market, as we will almost certainly get a truly meaningful correction (NDX 22K, 20K).
So what is the implication of a shift lower? Well, it indicates that sellers are willing to hold the market lower than before. The fact that the sellers can't seem to push it lower from here is why I'm not going to be surprised if we rally from here. It would break hearts, blow accounts, and explode heads. It would represent another opportunity for sellers to attain higher prices, and puts the onus on buyers at that point to bring in capital and show interest at higher prices. Such a scenario would tell us whether the lows of the year are likely in, and how to approach Q2.
My "be careful what you wish for" post about forming tops is still applicable. A meaningful top does not form in a few weeks. It takes months, and what we've seen here is likely the start of such a process. Be patient with the market. Really listen to it. I honestly think a break lower now will only make a sharp snap back higher even more painful. Let it work, and when the time is right, you'll know. Yes, it is one frustrating SOB. But don't guess, just listen.
#ES_F #NQ_F
Feb 3

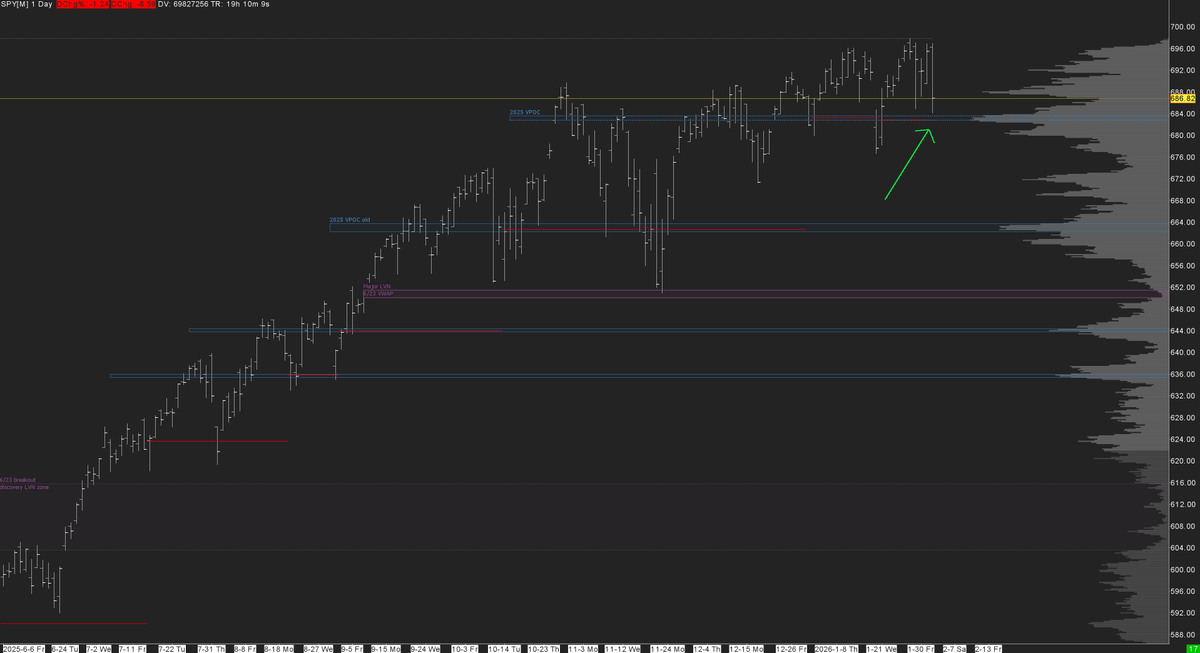
The now-famous $SPY 683 sits just below today's current low ... it's still a 🧲
My sentiment remains: sellers are not "for real" unless they can at least sustain one entire day's trade below the post-tariff-low developing VPOC, currently at 683. That hasn't been done since May 23, 2025.
This market seems to be showing hairline cracks (the death of software stocks, the rise of defensive names, the totally overcooked AI narrative...).
But until they show me a day where we trade completely below 683, the structure for long continuation is firmly intact. Is this market ready for a real correction? (I hope so...) Fine, prove it!
$QQQ #ES_F #NQ_F
1
1
11
2,008
SierraChart retweeted
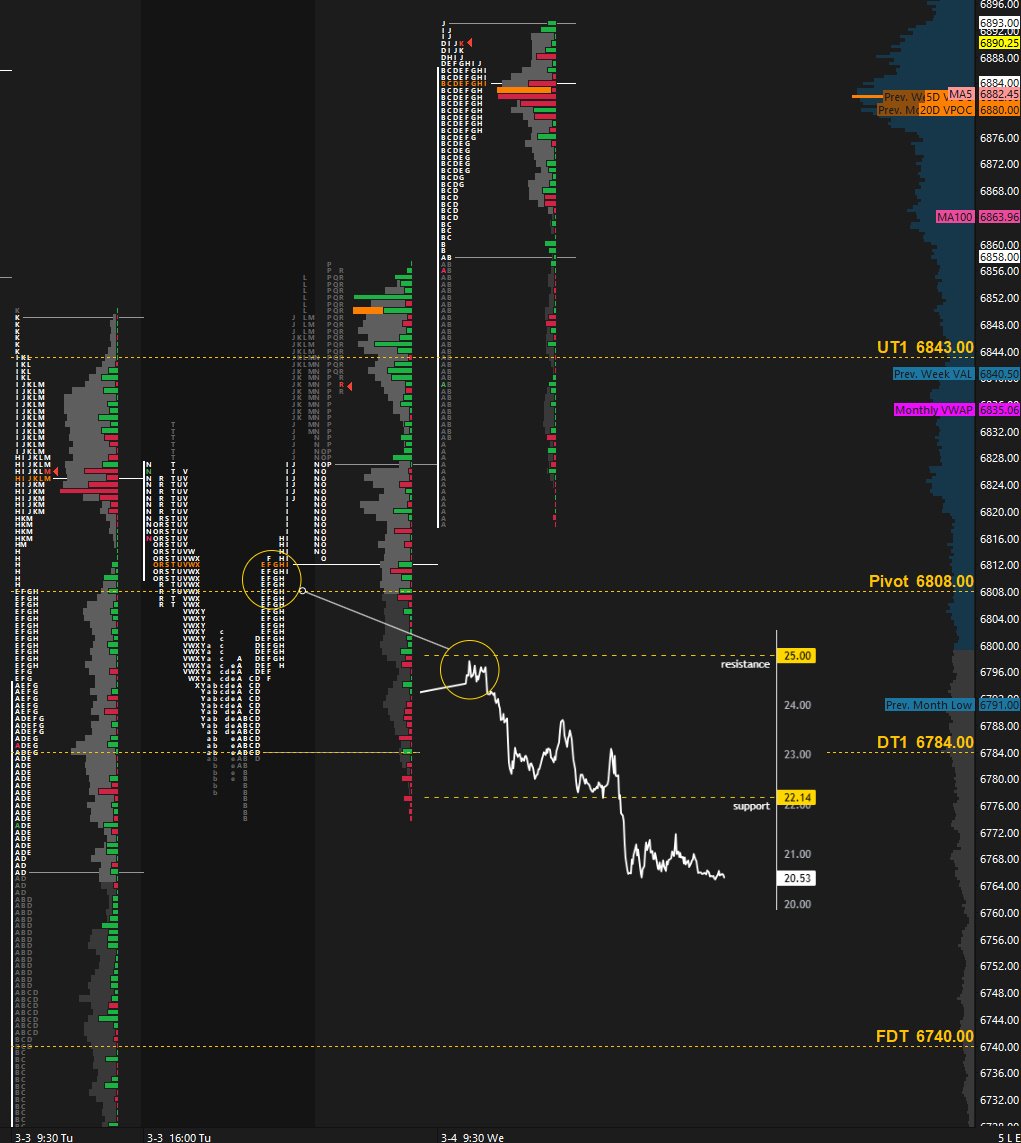
Mar 4
Failed breakdown below 6784 DT1. Reclaimed 6808 pivot. VIX hitting resistance. Bad spot to short the rip. Don't fade.
2
15
1,704
SierraChart retweeted

Feb 19
#ef_f
Todays session was pretty annoying to trade but ending it here 28pts.
The breakeven trade was very irritating and I almost got off after that, but figured if sellers held the balance high again that another short wasn't out of the question.
3
3
43
2,956
SierraChart retweeted
BEST FRIDAY IN MONTHS

7
1
48
3,308
SierraChart retweeted

Feb 13
Have a few things I've been working on coming in the next few weeks:
- MBO Blocks – combined tick increments support, option to Draw on Chart vs DOM
- Trade Bracket Preview – visualize your bracket before placing the order
- DOM Notes – annotate right on your DOM
- DOM Graph – Clone of Sierra's, Use full depth on chart and independently configurable # levels on the study
- DOM Graph Monitor – set thresholds, quickly be aware of when your environment changes
and a few other things. @SierraChart
9
5
94
5,841