
Joined July 2015
- Tweets 28,158
- Following 627
- Followers 1,744
- Likes 73,922
4,843 Photos and videos


Pinned Tweet

2 Oct 2022
**My all pinned Tweets**
1. x.com/Singlejivi/status/1576…
2 Oct 2022

***Thread on Mahatma Gandhi's Blunders***:
1. To get Akhand Bharat (India) separated into India and Pakistan.
2. To get Shaheed Bhagat Singh hanged.
3. Mishandling Khilafat Movement.
4. Removing Netaji Subhash Chandra Bose from Congress.
...
#GandhiJayanti
#2ndOctober
1/
4
11
Aam zindagi vs Mentos jindagi for the recent telegram ban in India to avoid neet paper leaks
2
3
807
Rajat Khandelwal retweeted

दो भारत बन रहा है
1. वंदे भारत वाला
2.सांस ना ले पाने के कारण घुटन से मरने वाला
बाकी पॉजिटिव बातें करते रहिए 😐
776
6,072
14,669
1,641,866
Rajat Khandelwal retweeted

Jun 15
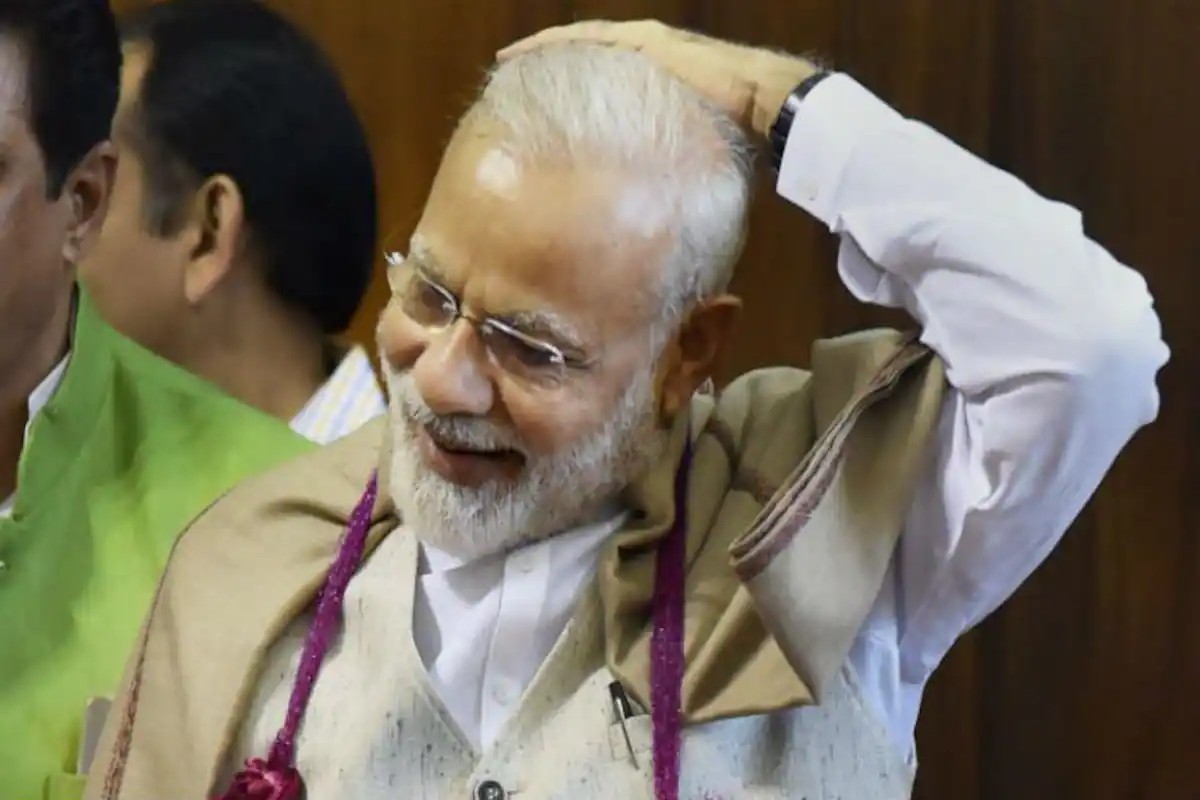
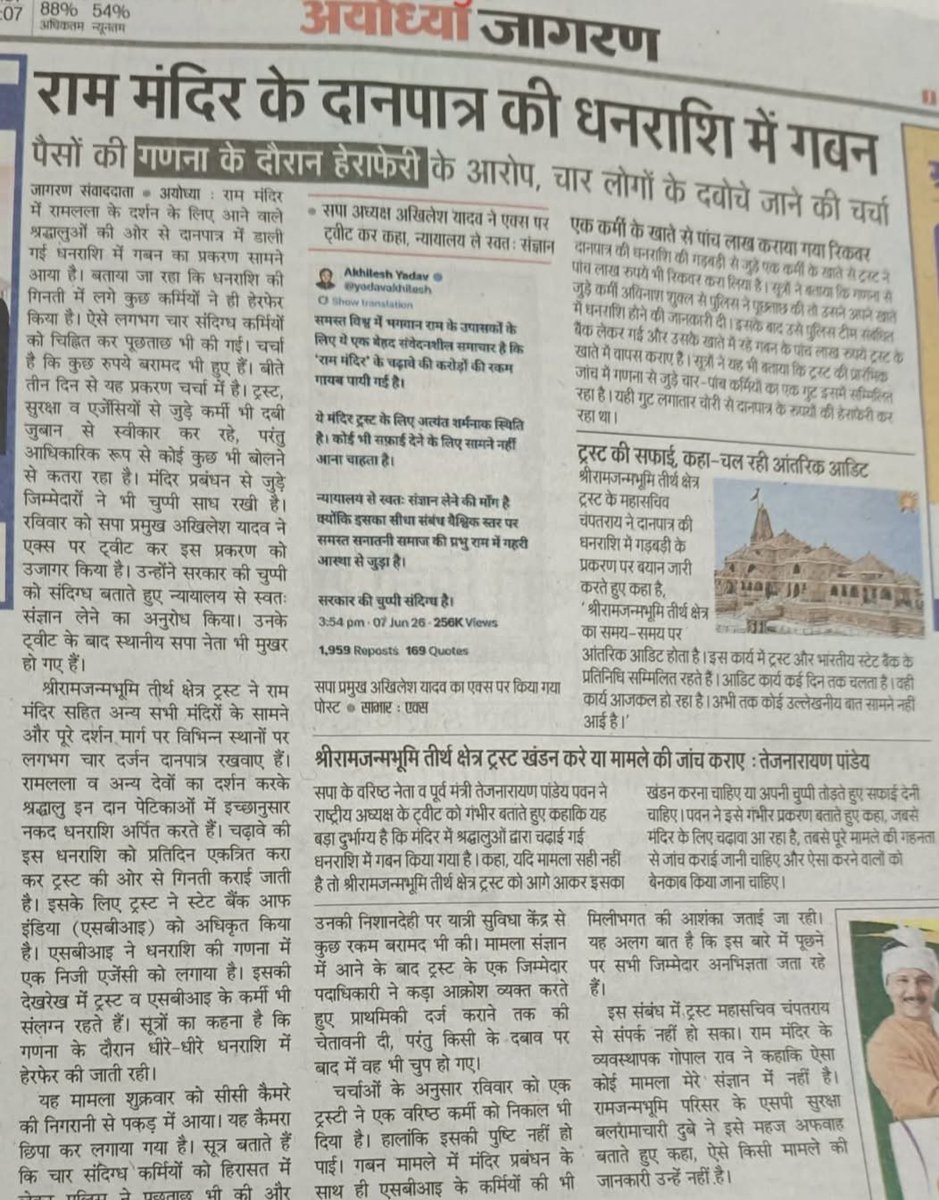
1. Rs 1,400 crore swindling allegation
2. Misappropriation of Ram shilas
3. Fight over local collections before 2019
4. The 2021 inflated land deals
5. The forged temple land purchase
6. The multi-crore prasad scam
m.thewire.in/article/religio…
31
556
1,101
23,674
Rajat Khandelwal retweeted

Jun 15
राम मंदिर से क्या 200 करोड़ का चढ़ावा चोरी हुआ, नोटों की गिनती से जुड़े 50 कर्मचारियों पर संदेह, 5 कर्मचारियों से 2 करोड़ रुपए की नकदी बरामद, पढ़िए एक्सक्लूसिव रिपोर्ट
#Ayodhya #RamMandir #exclusive
dainik.bhaskar.com/y4QNkoA6Y…
15
207
409
11,927
Rajat Khandelwal retweeted

Jun 15
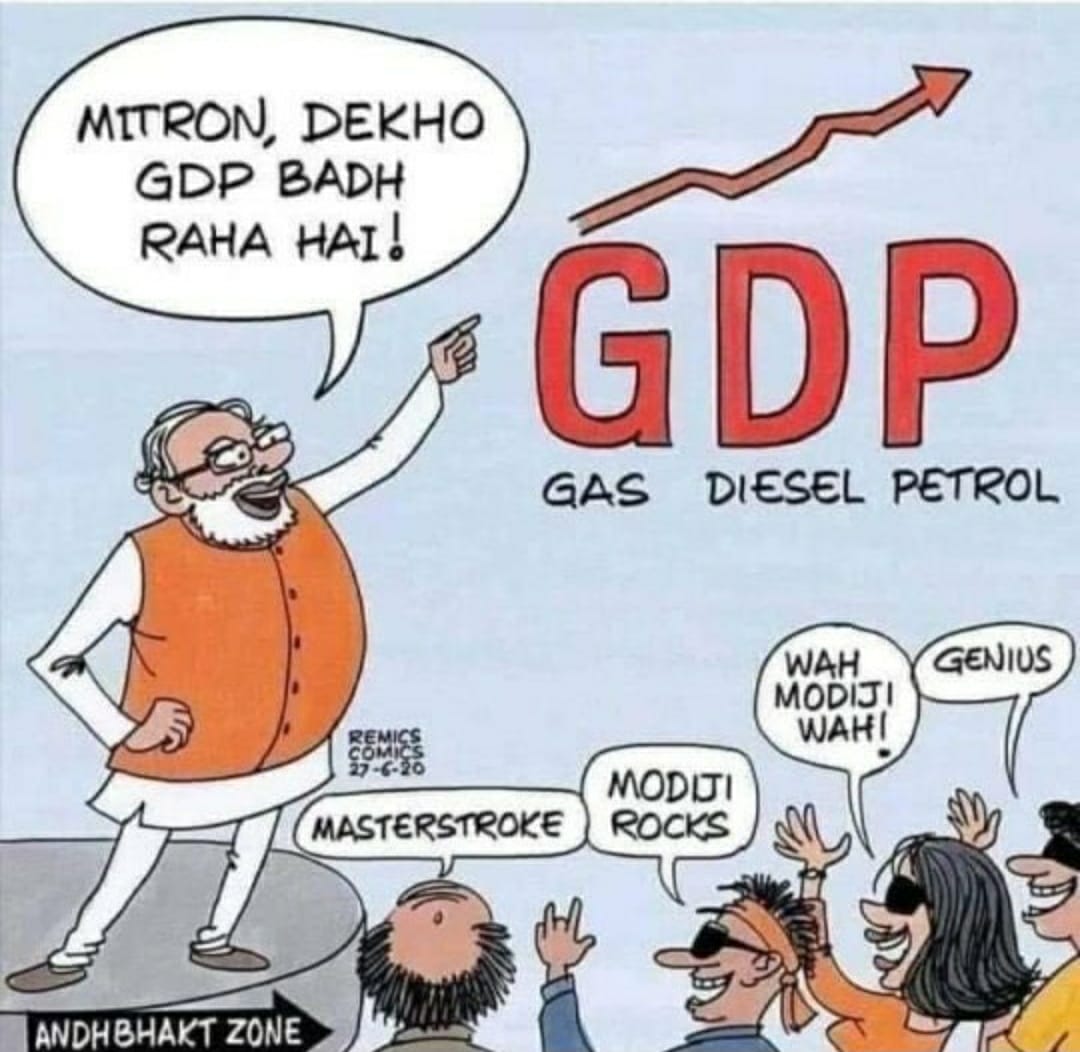
Crude oil is down now from around 120 to 80 dollars and retail petrol price is still up.
Now no one from ministry or TV News media will tell us how much money OMC is earning per quarter and how much tax revenue Govt is making due to this.

68
952
3,404
62,754
Rajat Khandelwal retweeted

Jun 13
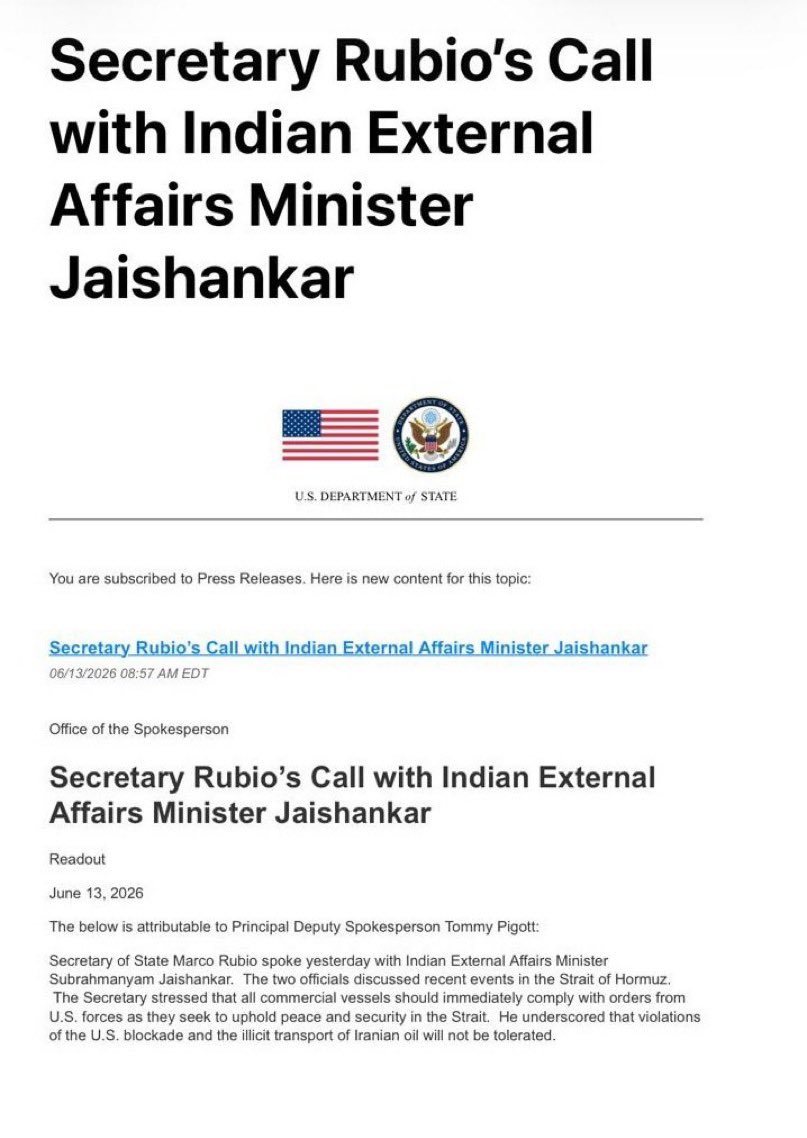
Deeply shocking to read this official US statement, which contains absolutely no expression of regret or condolence for the loss of innocent Indian lives. How can a “friend” and strategic partner be so deeply insensitive?
Why couldn’t a non-compliant commercial vessel have been stopped using other, non-lethal means? Is it not possible to disable a ship's propulsion or steering without firing missiles targeted to kill civilian crew members?
Practically every merchant ship navigating these crucial waters has Indian crew on board. Are they all considered fair game for US missiles now?
This approach is unacceptable and I hope @DrSJaishankar had said so to @marcorubio.
2,447
12,900
45,164
1,840,207

Rajat Khandelwal retweeted

Jun 12
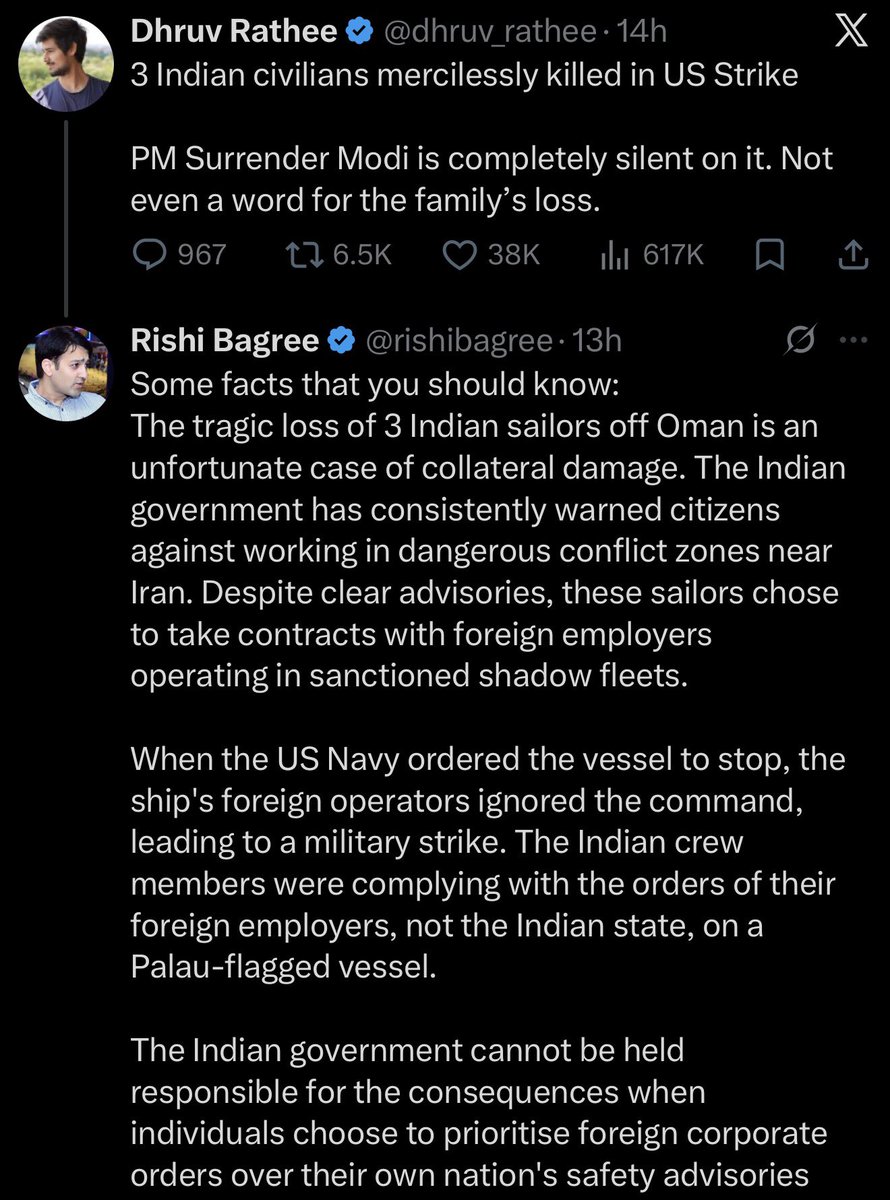
Even USA couldn’t defend killing of 3 Indian nationals like Bagree did for USA.
For him it was a collateral damage & they themselves were responsible for it!!
This is BJP IT Cell. These are the real anti-nationals. Only BJP & Modi’s image matters to them.
235
2,795
13,616
220,542
Rajat Khandelwal retweeted

Why having sovereign AI is more critical than ever ..
Jun 13

The US government, citing national security authorities, has issued an export control directive to suspend all access to Fable 5 and Mythos 5 by any foreign national, whether inside or outside the United States, including foreign national Anthropic employees.
The net effect of this order is that we must abruptly disable Fable 5 and Mythos 5 for all our customers to ensure compliance.
Access to all other Claude models is not affected.
We apologize for this disruption to our customers. We believe this is a misunderstanding and are working to restore access as soon as possible.
Read our full statement: anthropic.com/news/fable-myt…
38
34
273
13,562
Rajat Khandelwal retweeted

Jun 12
ऊर्जी मंत्री के सामने ही कटी बिजली
मोदी की उपलब्धि टॉर्च से गिनाई
रेल मंत्री अश्विनी वैष्णव जयपुर में मोदी सरकार के 12 साल पूरे होने पर उसकी उपलब्धियां गिना रहे थे. कार्यक्रम में ऊर्जा मंत्री भी मौजूद थे. इसी दौरान मंत्री के सामने महज 15 मिनट में तीन बार बिजली चली गई.
बिजली गुल होने के बावजूद कार्यक्रम जारी रहा. मोबाइल की टॉर्च और कैमरे की लाइट की मदद से मोदी सरकार की 12 साल की उपलब्धियां गिनाई गईं. देखिए वीडियो...
113
1,845
5,382
82,395
Rajat Khandelwal retweeted

अभिनय सर,
स्थिति इतनी गंभीर हो गई कि ईरान को लेकर चलाई गई खबर का खंडन करने के लिए खुद ईरानी दूतावास को सामने आना पड़ा।
सोचिए, एक विदेशी दूतावास भारतीय मीडिया को पत्रकारिता का पाठ पढ़ा रहा है!
जब न्यूज़ रूम में तथ्य हार जाएँ और नैरेटिव जीत जाए, तब लोकतंत्र का चौथा स्तंभ मज़बूत नहीं, कमज़ोर होता है।
मीडिया को विशेषाधिकार नहीं, जवाबदेही चाहिए।
जनता अब सवाल पूछेगी।
जिस खबर का जवाब एंकर नहीं, विदेशी दूतावास दे रहा हो... वहाँ जनता को सवाल ज़रूर पूछने चाहिए।
52
1,140
4,526
91,615
Rajat Khandelwal retweeted

Jun 11
Perhaps first time in history that Hellfire missiles were used on Indian civilians. This quad partner is amazing.


46
1,969
7,961
166,960

Rajat Khandelwal retweeted
मीडिया वालों ने बहुत झूठी खबर फैलाई थी कि
खान सर फरार हो गए हैं
सुनिए खान सर खुद को क्या बोल रहे हैं....
104
1,927
9,188
120,883

दवाएं महंगी, फाइलें गायब... दिल्ली के अस्पतालों में 650 करोड़ का घोटाला
दिल्ली के सरकारी अस्पतालों में दवाओं और मेडिकल उपकरणों की खरीद में 650 करोड़ रुपए से ज्यादा के घोटाले का खुलासा हुआ है. सरकारी अस्पतालों के लिए की जाने वाली दवाओं, मेडिकल उपकरणों, मरीजों की चादरों, एक्स-रे मशीनों और एनेस्थीसिया से जुड़े उपकरणों की खरीद में बड़े पैमाने पर गड़बड़ी की गई है. अब एसीबी इस मामले की जांच कर रही है.
पूरी ख़बर- intdy.in/dapa0b
#Delhi #DelhiHospitals #MedicalScam #CorruptionCase #ACBInvestigation #HealthcareScam #ATCard #AajtakSocial | @SushantMehraAT

298
1,218
2,392
97,052
Rajat Khandelwal retweeted

🚨 Fire personnel are working to stop fire at a high-rise apartment in Noida.
93
166
2,756
232,107
Rajat Khandelwal retweeted

Jun 7
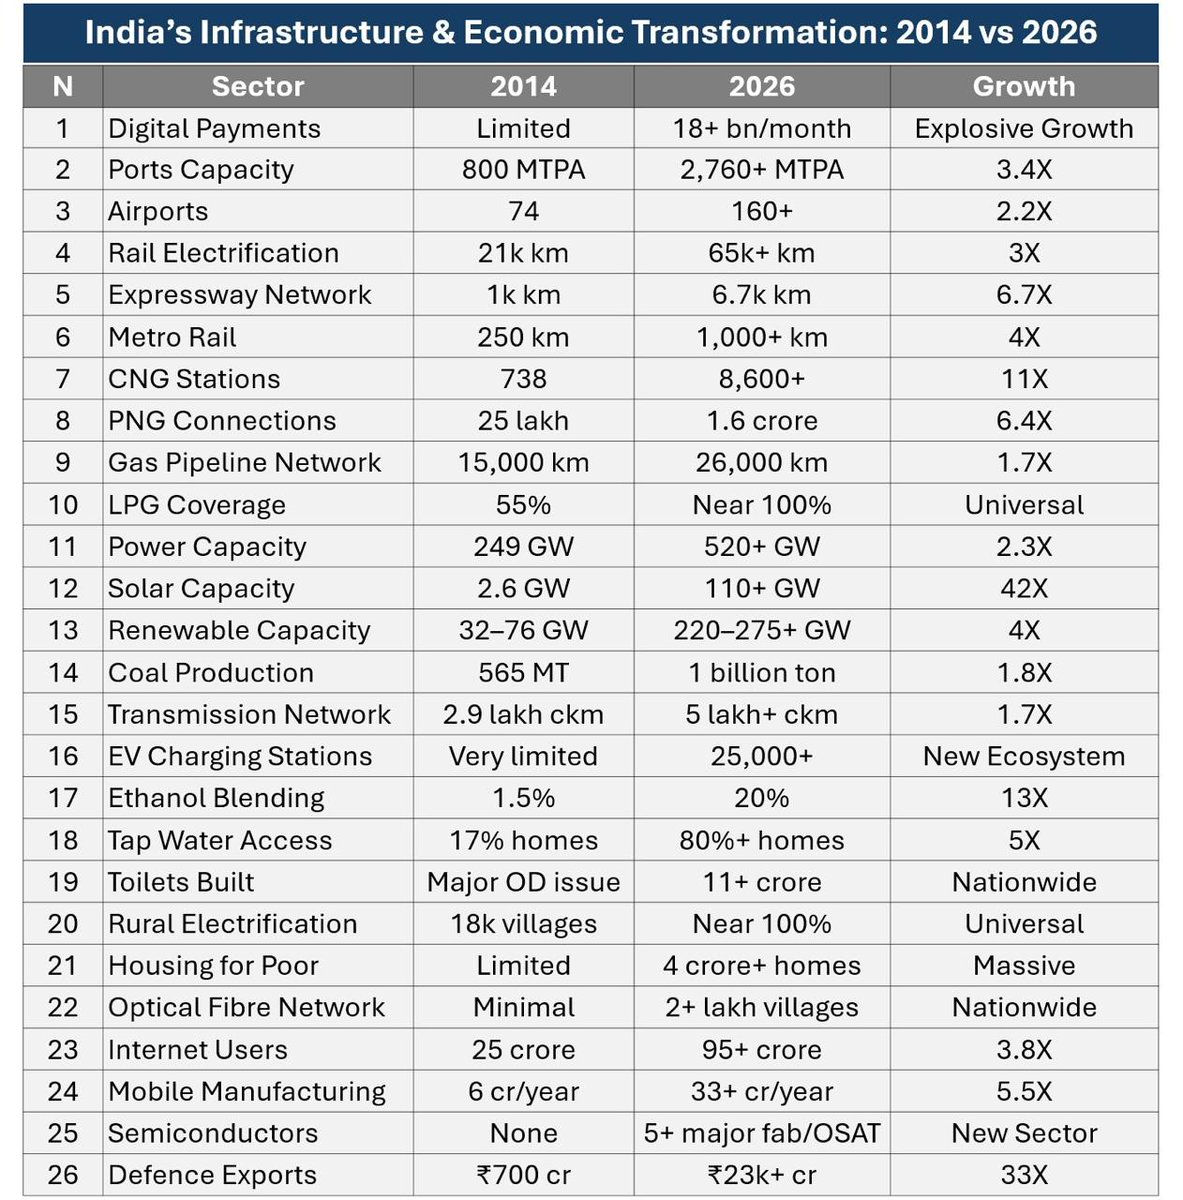
Concrete numbers look great in a BJP infographic.
But here’s what they quietly left out 👇
1️⃣ “80% Tap Water” — CAG tabled in Parliament (Feb 2026) found inflated reporting, non-functional connections & a shortfall of lakhs of FHTCs.
In Karnataka alone, target was 72.14L, delivered 47.62L. Central funding for JJM has since been STOPPED. Indore’s contaminated water crisis killed 32 people.
“Universal” indeed.
2️⃣ “₹23k cr Defence Exports” — This figure is already outdated. Actual FY26 exports hit ₹38,424 crore. So why is this tweet using old data?
Because ₹38,424 crore sounds too good and distracts from the real question: why does India still import 60% of its defence needs while spending ₹6.2L crore on defence?
3️⃣ “Solar 110 GW” — As of March 2026, India’s cumulative solar is 150.26 GW. The tweet uses a lower number. And this solar boom? Begun under UPA with JNNSM (Jawaharlal Nehru National Solar Mission). BJP inherited the runway and flew the plane.
4️⃣ Youth unemployment hit 15.2% in March 2026; 9-month high. Two-thirds of India’s unemployed are now graduates. No row for that in the infographic.
5️⃣ India’s national debt crossed ₹197 lakh crore in March 2026. The tweet celebrates ₹23,000 crore in exports while the debt pile grows ₹20L crore per year. That math doesn’t feel like transformation.
Infrastructure ≠ governance.
Connections ≠ water.
Numbers ≠ livelihoods.
26 rows of infra numbers. Zero rows on jobs, debt, or water quality.
That’s not transformation. That’s a brochure.

5
28
38
2,108
Rajat Khandelwal retweeted

Jun 8
UP पुलिस की परीक्षा देने पहुचे जांबाज़ जवान,
चारबाग में की जवानों के लिए गई शेल्टर की व्यवस्था।
इसके लिए पूरी खुरपेंच टीम सरकार का धन्यवाद देती है❤️
39
630
3,923
67,968