
30 years developing high-performance charting and data visualization tools for statistical analysis. For RAD Studio, .NET, JavaScript - desktop, web & mobile.
- Tweets 2,497
- Following 307
- Followers 864
- Likes 968
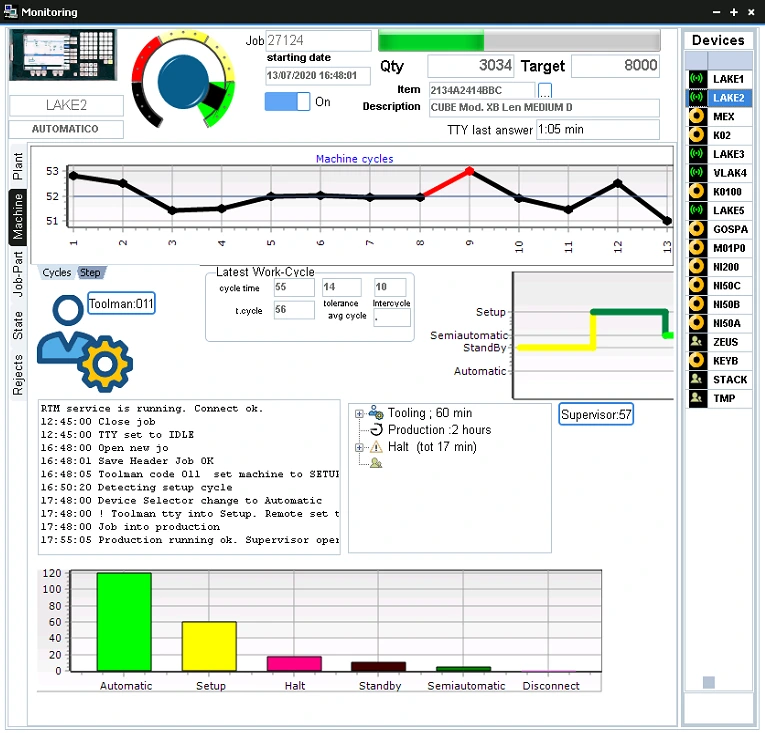


ALT The A7K MES dashboard displays real-time machine monitoring, production metrics, and operational status visualization.
ALT TeeChartJS v4 Released: Migration to TypeScript
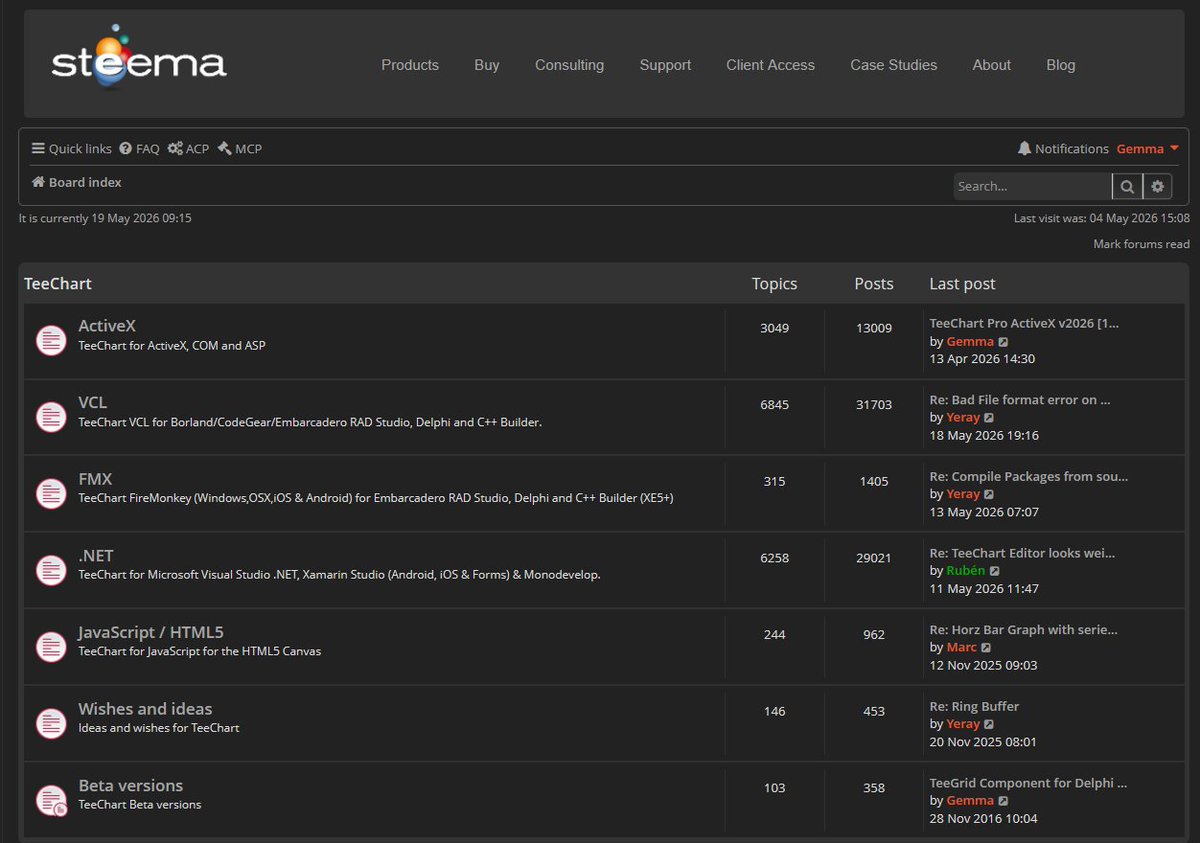
ALT Dark Theme for Steema Support forum
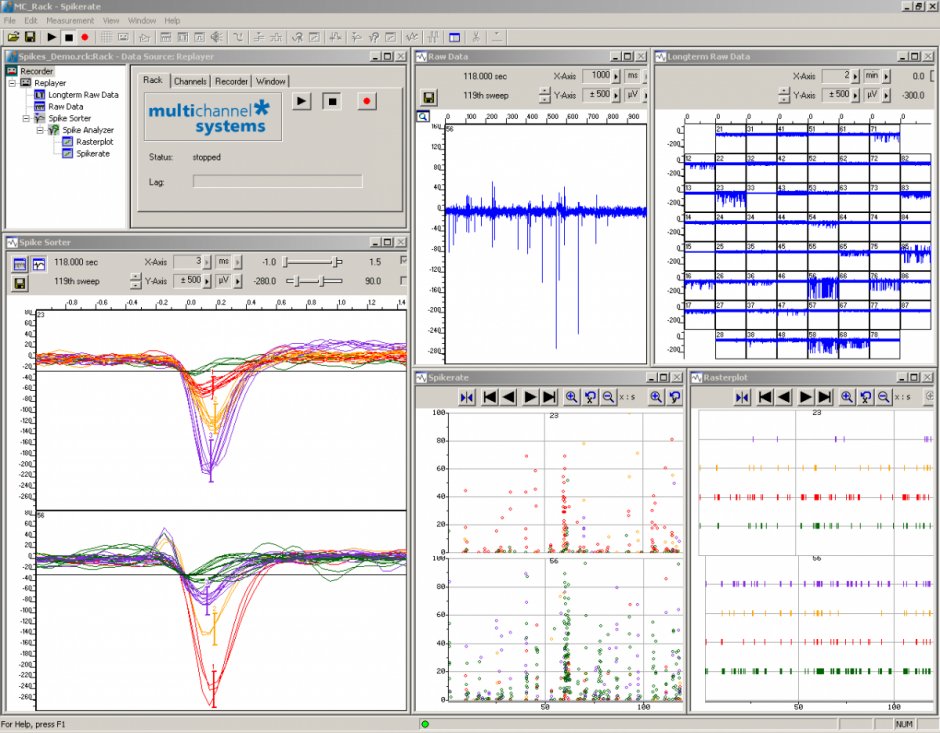
ALT The MC_Rack / Spikerate software from Multi Channel Systems is used for recording and analysing extracellular neural signals from microelectrode arrays.
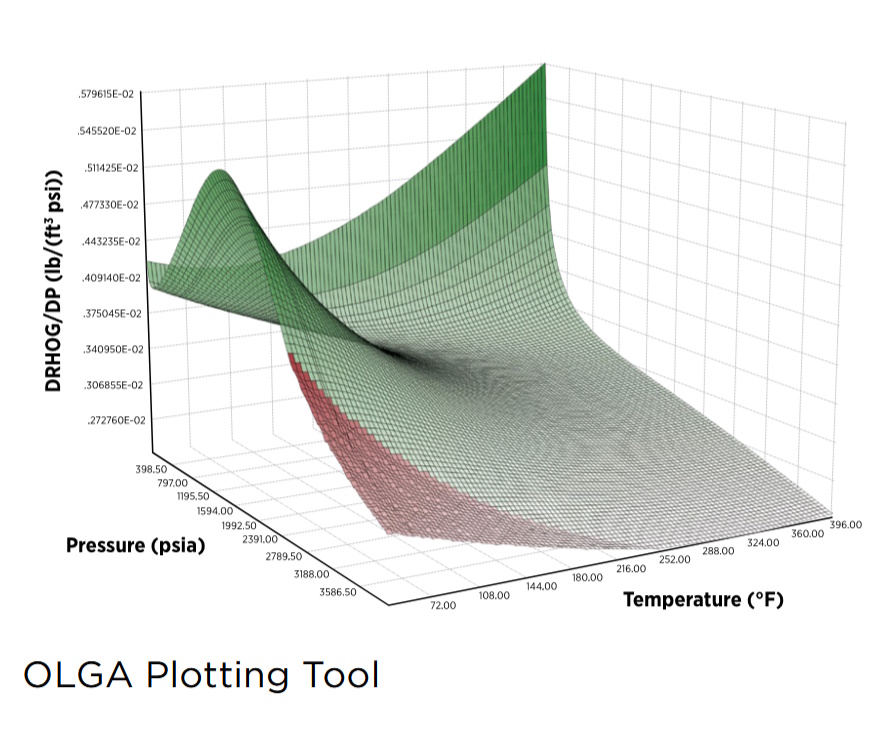
ALT This 3D surface plot generated by the Calsep A/S OLGA Plotting Tool shows the variation of DRHOG/DP (lb/ft³/psi) as a function of Pressure (psia) and Temperature (°F).
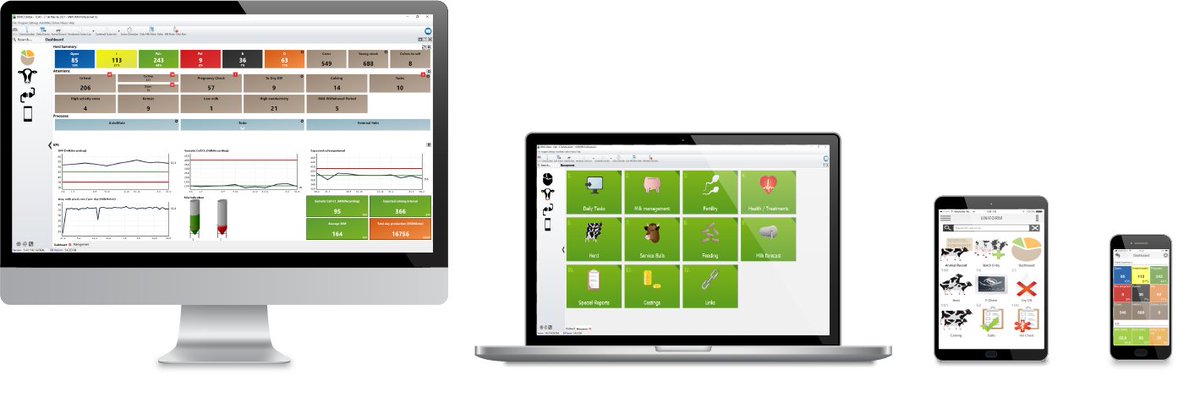
ALT UNIFORM-Agri dashboard
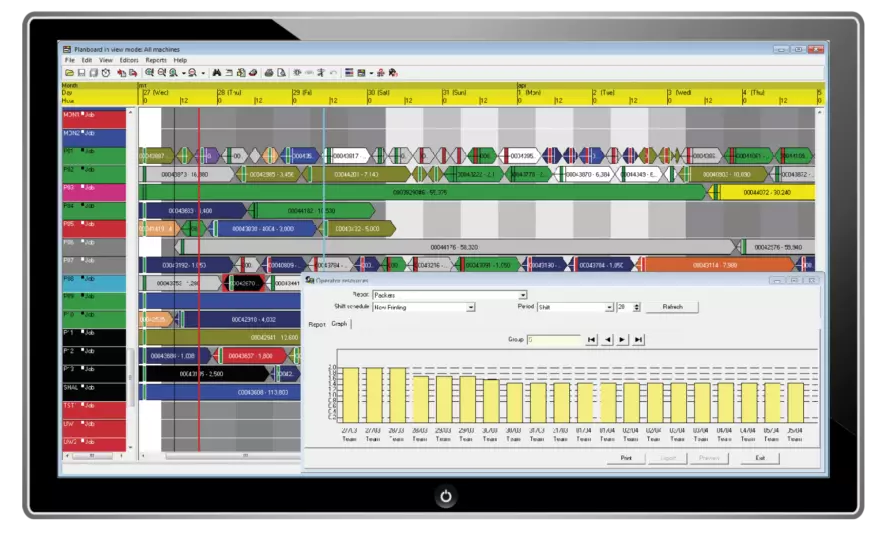
ALT BMSVision PlantMaster Planboard
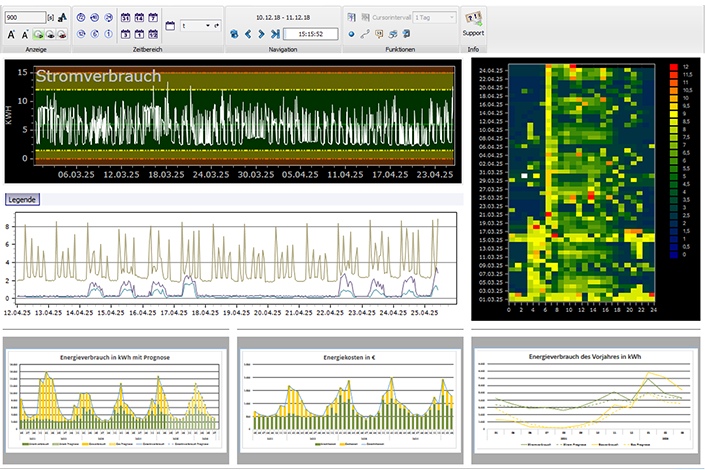
ALT Industrial analytics dashboard from Metalogie’s qrk3 software monitoring energy consumption
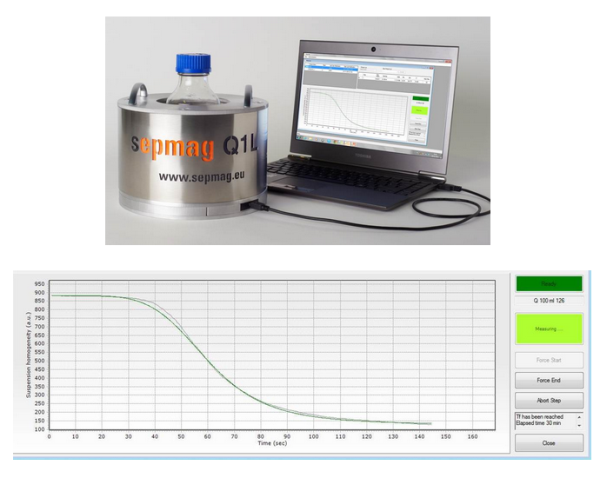
ALT Monitoring Magnetic Bead Separation Processes
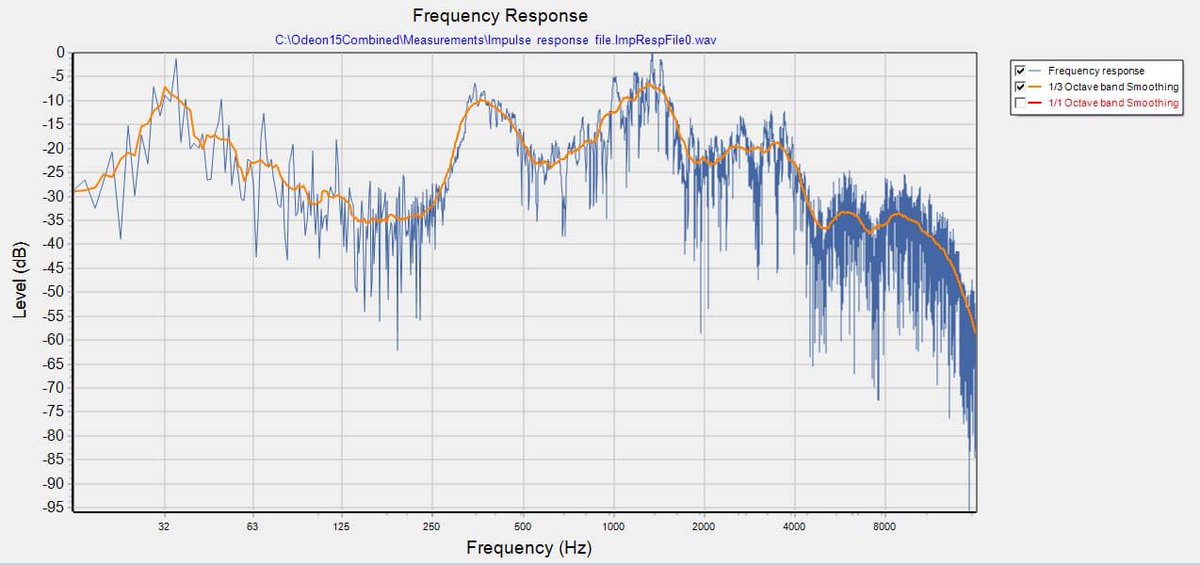
ALT ODEON Frequency Response Graph
