
Joined May 2021
- Tweets 10,955
- Following 656
- Followers 4,355
- Likes 12,078
996 Photos and videos


🇬🇧🤝🇯🇵 Rolls-Royce ($RR / $RYCEY) signs Small Modular Reactor deal with Japan @RollsRoyce
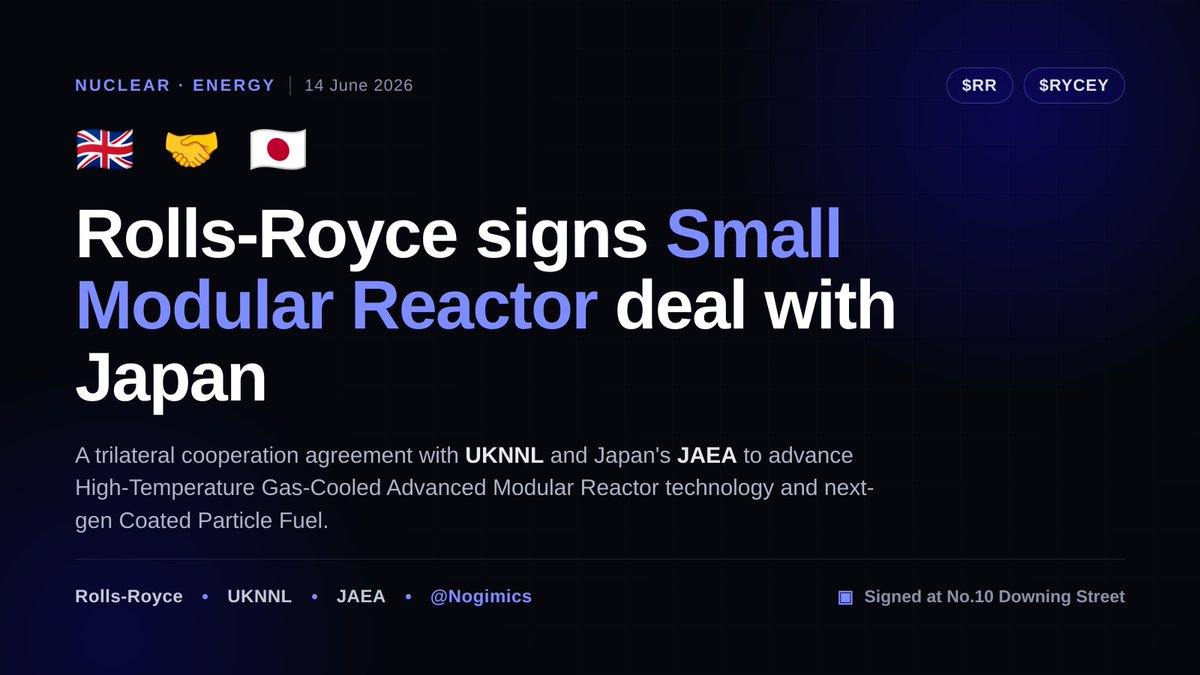
ALT News card: Rolls-Royce signs Small Modular Reactor cooperation deal with UKNNL and Japan’s JAEA, signed at No.10 Downing Street
2
1
14
1,503
StockAnalystPro retweeted

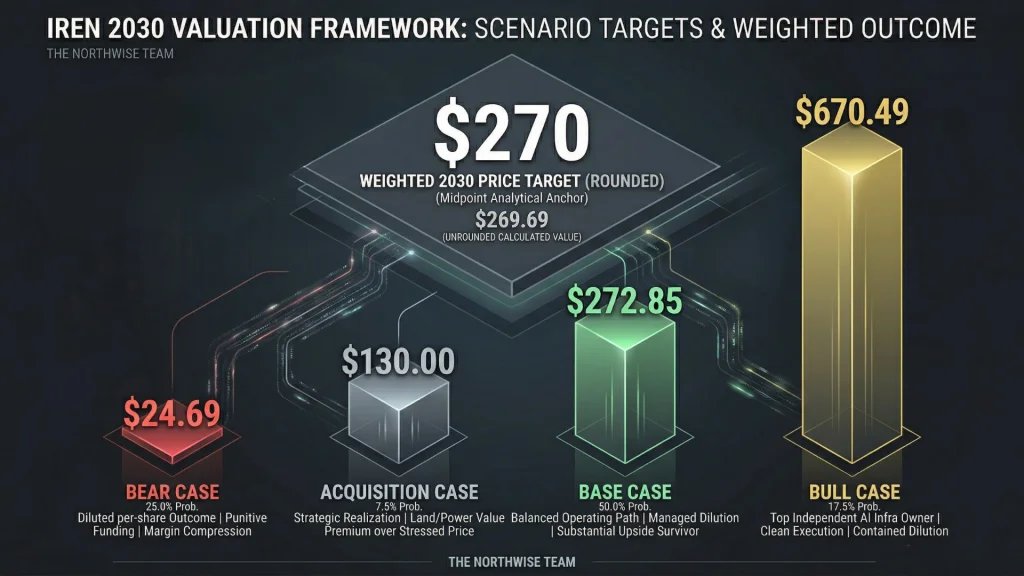
In preparation for our new $IREN model release in the coming weeks, we have decided to open our previously private $IREN price targets and modeling to all users.
Despite, seeing more downside risks than most Iren bulls on X, we still have a massive weighted $270 price target for 2030 (~$150 present fair value depending on required rate of return).
Check out the link for the full report in the first comment. ⤵️
Our new model coming soon will update for massive new GW developments, dilution concerns, the $NVDA partnership and much more.
Let us know what you would like to see covered in our new model, and consider signing up for Northwise premium to access our upcoming full model, price targets, and action zones.
6
7
150
42,933

1
17
1,818
StockAnalystPro retweeted

NEW: Inside the 24-hrs before WH slapped export controls on Anthropic
- Last Thursday, Amazon CEO Andy Jassy raised concerns about Fable jailbreak to Trump admin
- Friday AM, Sean Cairncross, Bessent, Susie etc. held WH call to discuss
- Then White House started reaching out to Anthropic to speak with Dario Amodei, who was at a wellness retreat.
- When Amodei was finally available past 1pm, he had three tense phone calls with a combo of ppl including Cairncross, Bessent, Lutnick, Kessler, Will Scharf, Richard Walters, and Walker Barrett.
-Amodei tried to clear up what he assumed was a misunderstanding. He defended the guardrails and distinguished between universal and non-universal jailbreak
- Cairncross and Bessent were unmoved and asked Amodei to take down Fable and work with the admin to fix the vulnerabilities. (A WH official said Amazon’s findings were run past the NSA and they felt they had “proof.”)
- Amodei asked for more time and info, but he made no commitments to pull the model
- Bessent told Amodei directly at one point that he was making a “bad decision”
- By Friday evening, the Trump admin imposed its export controls.
- “Export controls were a last resort after begging them for hours to work with us,” senior WH official said.
W/ @cheyennehaslett
politico.com/news/2026/06/13…
189
499
3,614
1,957,920
StockAnalystPro retweeted

Jun 13
I’ve had a number of conversations with folks inside and outside government about the current situation with Anthropic, and here is what I believe to be true:
— As we know, Anthropic publicly released its Mythos class models earlier this week under the commercial name Fable.
— Fable is Mythos with guardrails. But if those guardrails fail, then you’ve exposed Mythos and its advanced cyber capabilities to people who shouldn’t have them. (Keep in mind that Anthropic itself widely promoted the idea that Mythos was a cyberweapon and needed to be regulated as such. They asked for government regulation of Mythos and championed the guardrails on Fable. If there is a vulnerability — big or small — it is Anthropic’s responsibility to patch.)
— A highly credible trusted partner of both Anthropic and the USG who was testing Fable came forward with a jailbreak of those guardrails. The Admin asked Dario to fix the jailbreak or de-deploy the model. Dario refused.
— In their blog post, Anthropic defended its decision by saying the jailbreak isn’t serious. That is not what the trusted partner and the USG believe; nor is that kind of minimizing language consistent with Anthropic’s brand as the AI safety company. It’s difficult to fathom how they could claim a jailbreak allowing operability of a cyber weapon could be defined as not “serious.”
— In the past, Anthropic has always said that safety must be top priority and taken super seriously. In this case, Anthropic prioritized the continued offering of the consumer model over safety.
— In reaction, the Admin issued the export control. The Admin did this reluctantly. It’s been very surprised that Anthropic hasn’t wanted to cooperate with a reasonable safety request (ie fixing the jailbreak issue). Anthropic’s reaction is very much at odds with their branding and ethos as a safe AI research community.
— The Admin’s hope now is that Anthropic remediates the safety issue, the export control is lifted, and Fable goes back into general release. The Admin wants all of this to happen as soon as possible. It is frankly bewildered that Anthropic hasn’t wanted to comply with safety requests that it previously said were its highest priority.
— Those trying to misdirect and tie this action to the prior DoW/Anthropic issues are wrong. The Admin values Anthropic’s technical capabilities and feels that this issue, while serious, should be easily resolved. The ball is in Anthropic’s court.
2,123
3,129
24,432
7,167,791

Jun 12
Jun 12

More rockets in the hangar at LC-1 than we’ve ever had before. We’re lining up a busy few weeks of back-to-back-to-back-to-back launches from the world’s first private orbital launch site 🚀🚀🚀🚀


4
1,400
StockAnalystPro retweeted

Jun 12
More rockets in the hangar at LC-1 than we’ve ever had before. We’re lining up a busy few weeks of back-to-back-to-back-to-back launches from the world’s first private orbital launch site 🚀🚀🚀🚀
67
382
4,066
189,549
Jun 12


1,224
StockAnalystPro retweeted

Jun 12
Building the AAIG HBM Dashboard (beta) for members and clients. So much daily noise arround memory that it confuses a lot of people and make it hard to see real signal vs noise. Essentially what actually is important for the thesis.
It’s the practical output of the HBM engine I build to follow the thesis on 6 moving constraints. the research gives you the full baseline like company strategies, supply chain dynamics, competitive positioning, and the structural forces shaping HBM.
The dashboard then helps you track how those variables evolve in real time, monitor different scenarios, and see where the thesis is heading and which constraints ease or tighten.
I wanted to a dedicated, clean, read-only dashboard to trace the market, share trends, and follow the HBM research engine without the risk of anything getting overwriten or broken. Love it.
$MU, $TSM, $005930, $000660
Apr 24

Strategy, strategy, strategy.
So guys, after the SK Hynix Q1 call, I revised the strategic ranking of the three HBM suppliers and rebuilt the scoring framework as we got new information.
A few things to say about strategy first, because I think it’s the most underrated variable in how people read this market and how they navigate it, especially with this everyday news flow in HBM, which does not give you a single clear picture of what actually is going on.
We integrate this in our full HBM research, and this is just a part of it.
So why strategy matters more than most people think.
Most semiconductor investors focus on capacity, technology, and pricing, which are all important, but it does not mean anything without the strategic framework the company executes against. What tells you who wins in the long term is strategic position.
A strategic position is a compound of outputs related to choices that a company makes under pressure over years that also produce the culture and capabilities the company actually has today.
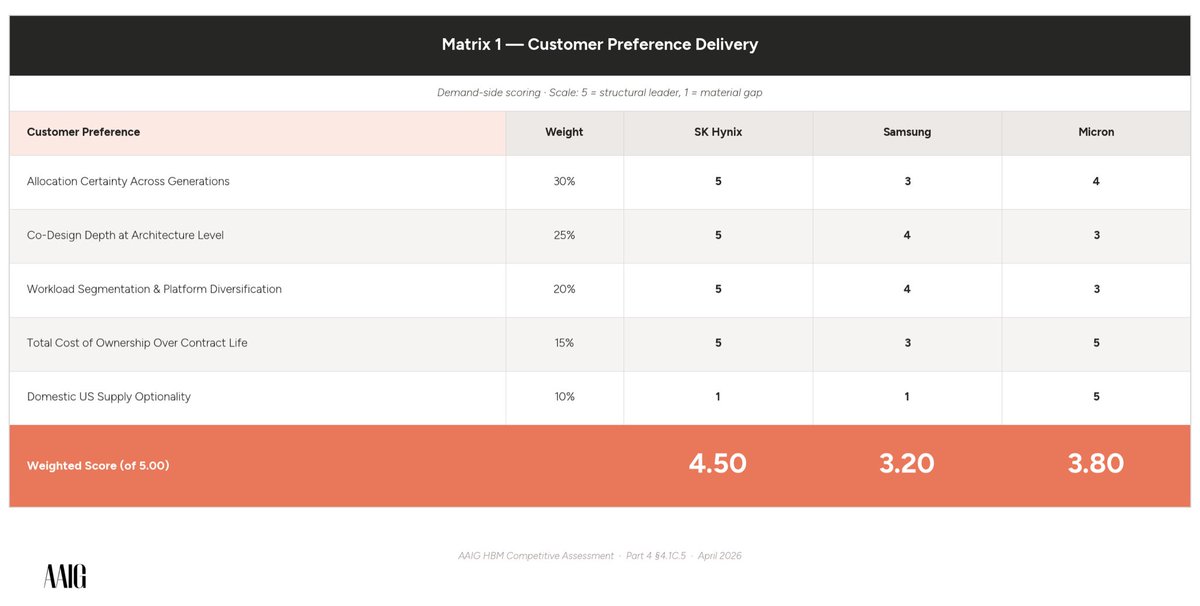
So we frame it through customer preference versus strategic positioning.
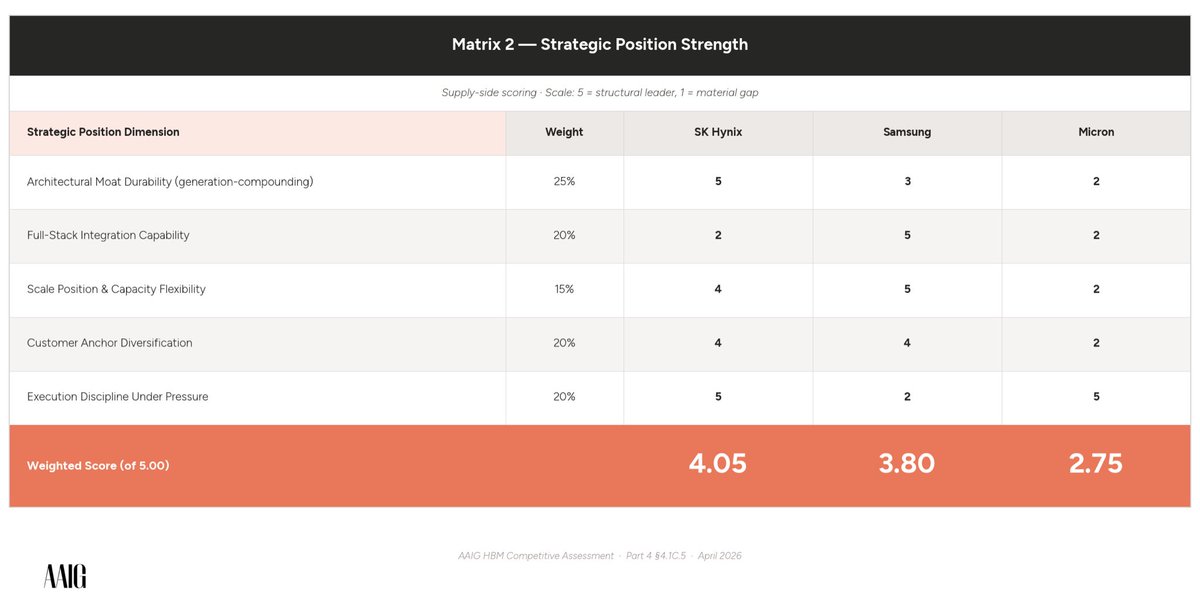
When you look at the supplier, there are really two questions that are related to this. The first one is whether the supplier delivers what customers are asking for today, and the second is whether the supplier holds a structural position that has enough strength through multiple generations.
A supplier can win the first question and lose the second. That is crucial to understand when you analyze a cycle like this.
And customer preference does not tell you whether the supplier still has a defensible position in, let’s say, 2028 or 2029. In these timelines, you get HBM4 mass production and HBM5, which has a custom base die, which makes full-stack integration a deciding variable.
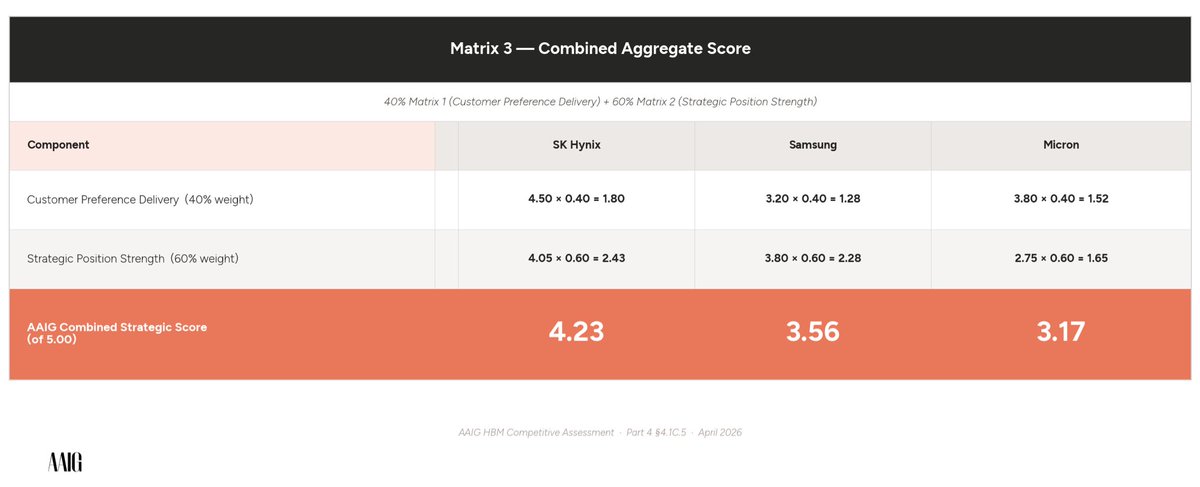
So we build two separate matrices, one for each question.
In Matrix C3, you see the combined aggregate and why we weighted 40–60 in advantage of strategic positioning. The 40–60 split is a judgment call, and I want to be transparent about it. You could argue 50–50 or even 70–30 depending on your time horizon.
Our reasoning is that the 2026 to 2030 window that we are analyzing is defined by structural scarcity and contracted multi-year architecture. This is backed by the HBM engine I built to track certain constraints.
I have to put a side note on this, though, because cumulative evidence currently weighs a 64% scenario that it will lean into structural scarcity and contracted multi-year architecture, but it is not concluded yet, as we are waiting for multiple T01 signals to acknowledge it.
So we are still monitoring the situation upfront.
I wrote a full article on SS for free with an explanation of how we come to certain weightings and why certain weighted scenarios matter more than the other ones in our eyes. The link is in the comments, and you can fully read it for free.
This is just a snippet of our total HBM research that we are building, so more soon.
$005930.KS $000660.KS $MU $SNDK $NVDA $AMD
6
4
43
12,879
StockAnalystPro retweeted

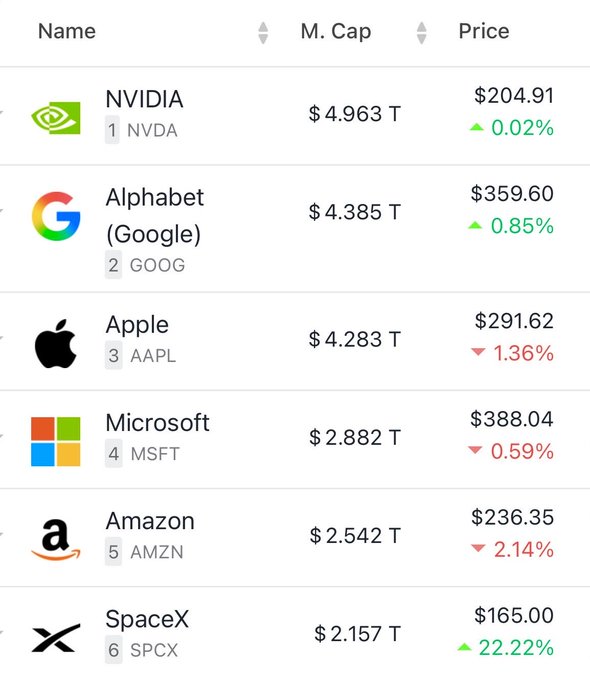
Many are asking why is SpaceX, $SPCX, NOT trading yet?
Here's exactly how the IPO process works and when the shares will be available to trade (Bookmark this):
The IPO was quoted at 9:50 AM ET and was expected to begin trading at 10:00 AM ET, but that does NOT guarantee shares will trade at that time.
Before trading begins, Nasdaq must complete a price-discovery auction where buy and sell orders are collected and matched.
At around 9:50 AM ET, "first indications" came out which are essentially a "gauge" of where the stock will open.
The first indications on $SPCX came in at $175/share, or a ~30% premium to the $135/share IPO price.
During this process:
1. Orders are entered, but no trades occur yet
2. Nasdaq continuously updates the indicative opening price
3. The opening price is adjusted until supply and demand are balanced
4. Only then does the opening auction occur and the first trade print
For major IPOs, delays are common such as Google in 2004 and Meta in 2012 which saw their first trades over 2 hours after the US market opened.
We expect the SpaceX IPO to open for trading within the next 60 minutes.
Buckle up for a historic day.
214
580
5,772
1,006,806
StockAnalystPro retweeted

Jun 12
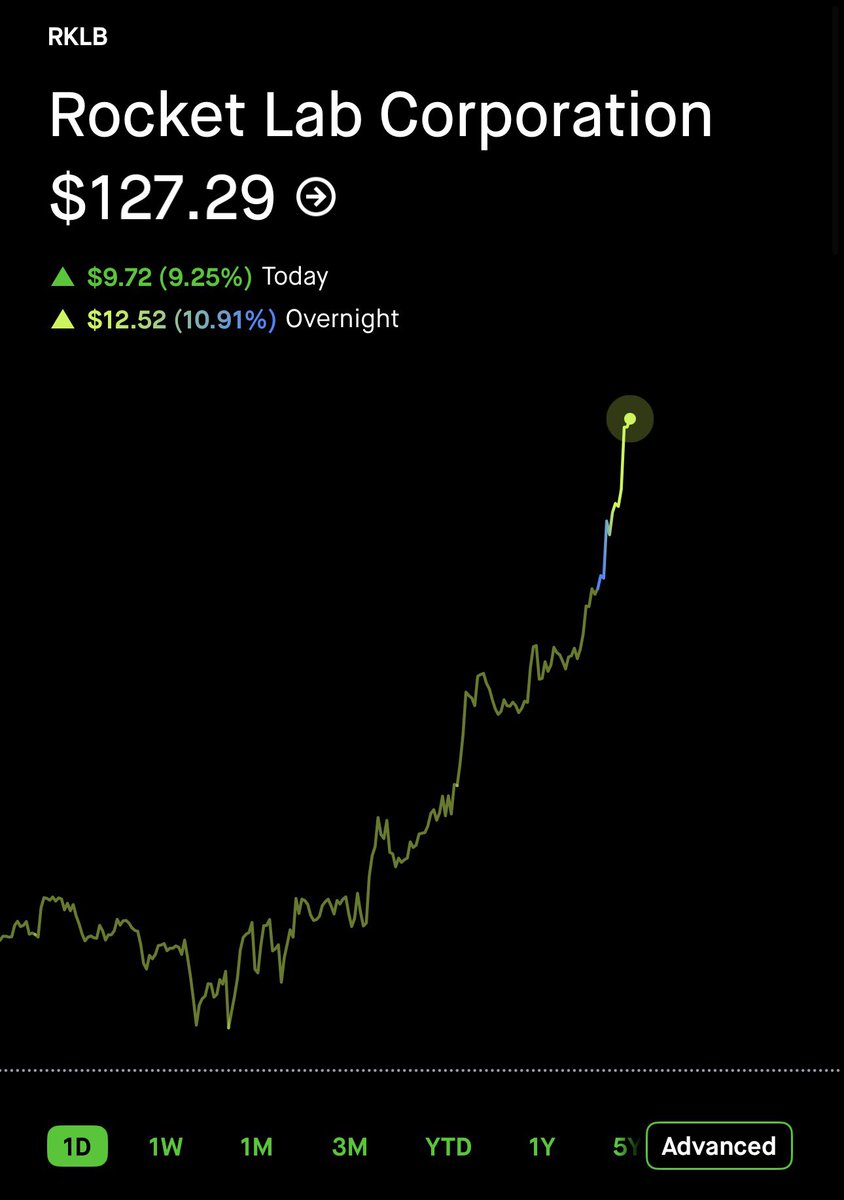
$RKLB up over 10% in overnight trading after joining the Nasdaq-100.
63
148
1,927
236,274

Jun 11
No Wonder why LEO gets all the Info to Invest in right stocks at right time.
Jun 11

Anthropic’s Dario Amodei has only 1 direct report, his chief of staff.
The rest of Anthropic’s executive system flows through Dario’s sister, Anthropic President Daniela Amodei, who handles daily operations and reports to the board.
For some comparison, OpenAI CEO Sam Altman has around half a dozen direct reports, while Nvidia Corp. CEO Jensen Huang has 60 people reporting to him.
---
From "Bloomberg Originals" YouTube channel, (link in comment)
1
476
Jun 11
🩷🔥🍿. TRUE LEADERSHIP.
Jun 11

JUST IN: 🇺🇸🇸🇦 United States officially becomes the world's largest oil exporter, surpassing Saudi Arabia.


2
473
Jun 11
$IREN is the actual Builder, so they have advantage in this cost scenario where they build and also they are the NEOCloud.

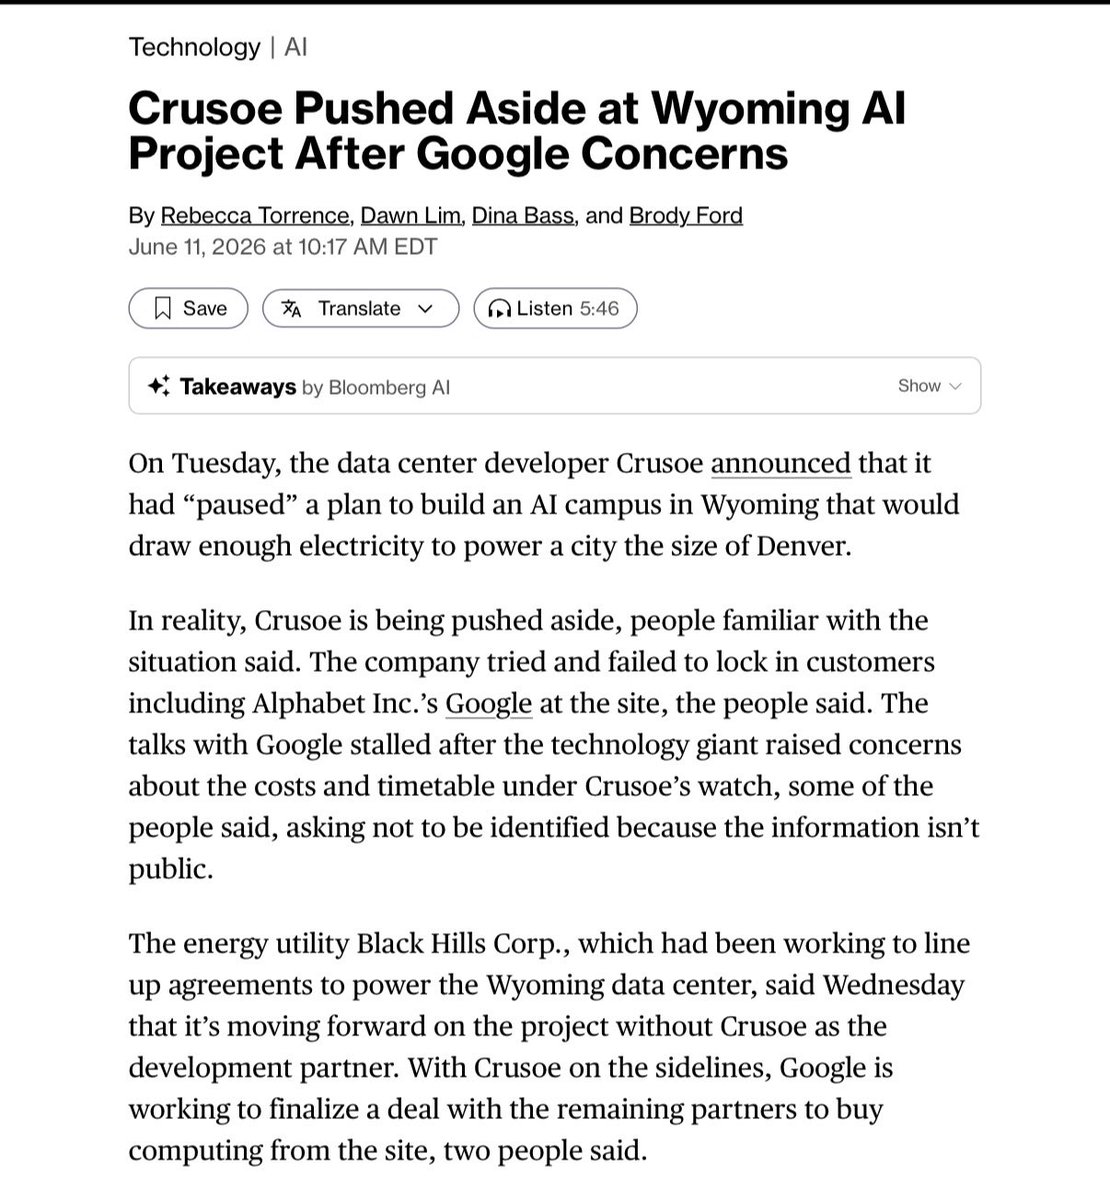
🚨BREAKING: Crusoe announced it “paused” its ~1.8 GW Wyoming project
Bloomberg says that’s not what happened.
Reality: Google kicked them out
>Google was the main customer, walked away over costs and timeline
>utility moving forward WITHOUT Crusoe
>Google negotiating directly with remaining partners
>Oracle and OpenAI also declined to expand with Crusoe in Texas
CRUSOE IS COOKED

1
33
7,851
Jun 11
Jun 11

NEW: Jeff Bezos reveals his new startup Prometheus is building an “artificial general engineer” as it hits a $41,000,000,000.00 valuation.
9
1,447

Jun 10
Jun 10

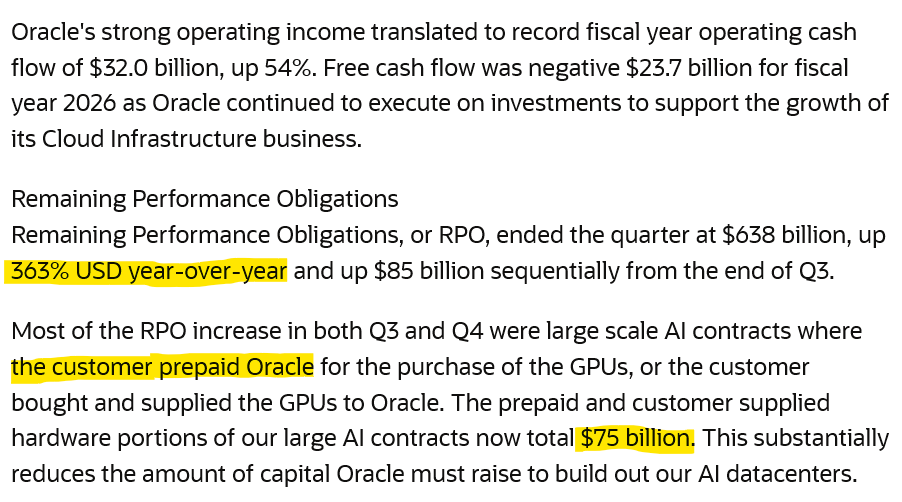
Oracle $ORCL added $85B in booked future revenue in 90 days. Customers are prepaying for GPUs before the datacenters are even built.
Prepaid and customer-supplied hardware now totals $75B
Demand is so far ahead of supply that buyers are funding the seller.
2
49
8,423
Jun 10
Hoping this is final climax. Let’s end soon.
Jun 10

U.S. Central Command forces began launching additional self-defense strikes today at 5:15 p.m. ET against multiple targets in Iran at the Commander in Chief’s direction. The strikes are in response to Iran’s unwarranted and continued aggression.
2
433
Jun 10
Jun 10
Oracle $ORCL added $85B in booked future revenue in 90 days. Customers are prepaying for GPUs before the datacenters are even built.
Prepaid and customer-supplied hardware now totals $75B
Demand is so far ahead of supply that buyers are funding the seller.
10
1,709