
Joined February 2022
- Tweets 9,468
- Following 1,065
- Followers 5,760
- Likes 31,971
1,745 Photos and videos


Pinned Tweet

Markets enter the week with the $VIX at 15.3, near the lower end of its 52-week range.
At the same time:
• U.S.–Iran headline risk remains elevated
• Breadth remains narrow
• AI leadership remains crowded
• Volatility is pricing a relatively calm week ahead
The trend remains constructive. Although some of the strong leaders like $AXTI and $LITE have seen consolidation this week.
The question is whether stability is being priced too confidently.
Asymmetric Opportunities - Week Ahead is now live.
We break down: → expected moves across $SPY, bitcoin:native , $GLD , and $USO (Oil) → volatility structure $VIX→ positioning & flows → narrative vs pricing disconnects → the key catalysts that could force repricing
Link below.

1
1
3
2,292
We are in the golden age guys.


272
Asymmetric Opportunities retweeted
$SPCE is getting pretty ridiculous benefiting from the $SPCX IPO tmr.
Current setup:
• Stock: $6.12
• DTE: 6 days
• ATM IV: 344%
• ATM straddle: $2.26
• Market-implied move: ±37%
The call skew is nuts.
25Δ put IV: ~320% (between $4 and $4.5 strike)
25Δ call IV: ~405% (around the $11 strike)
The stock rallied another ~30% today, yet traders are still paying a massive premium for upside exposure ahead of the SpaceX IPO.
My model caps at 400% IV, so I may need to raise that limit after this one.
Whether the market is right or wrong isn’t the point. Traders are willing to pay extraordinary prices for upside here.
One of the most extreme examples of upside call demand I’ve seen in a while.
1
1
445
While we have seen quite some serious selling, overall vol sellers selling weekly straddles are still profitable this week.
On $SPY the straddle went for $15.70, which represents a 2.14% move. So far we have moved -1.64% this week.
What do you think, will vol sellers have a profitable week?
241
One setup that I like right now is $GOOGL.
The stock is pulling back toward key support rather than completely breaking down, while the long-term AI investment story remains fully intact.
Instead of chasing shares outright, I looked at a structure that uses short-dated premium to help finance long-dated bullish exposure.
Strong trend. Controlled pullback. Interesting options pricing.
Full breakdown of the setup, risk/reward, and trade structure in the link in bio.
1
1
2,014
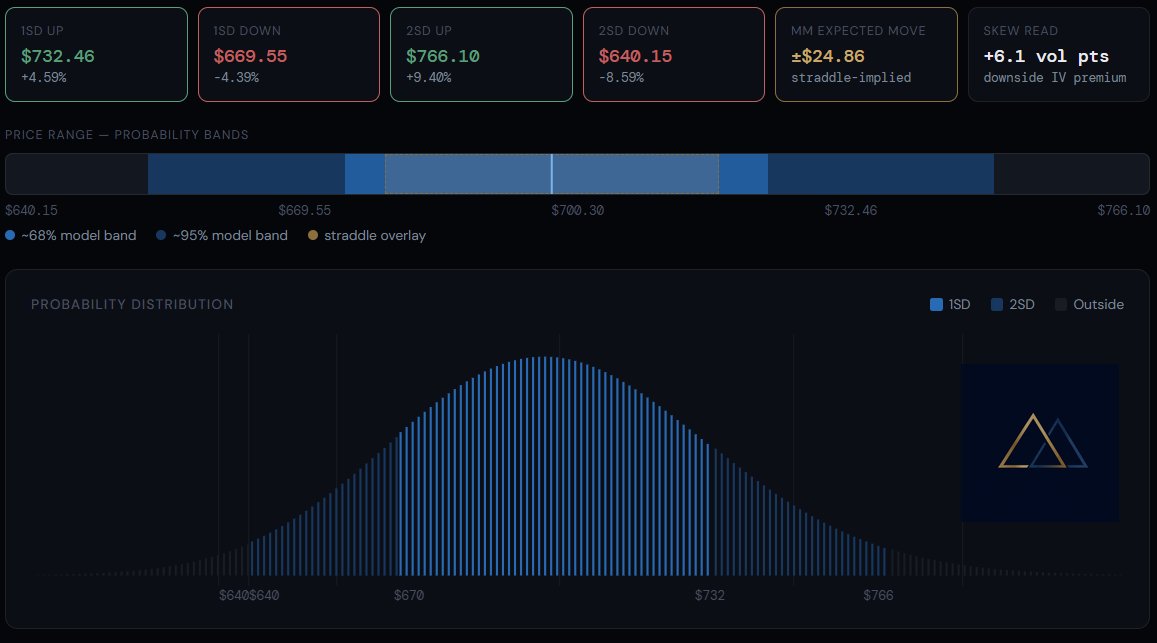
One thing that caught my attention going into next week is how much $QQQ skew has changed in a week.
Just a week ago, calls were still trading richer than puts. Even after the rally, traders were paying a premium for additional upside exposure.
That's no longer the case.
For next week's expiration, 25Δ puts are trading roughly 6 volatility points richer than comparable calls. Downside protection is now more expensive than upside participation. I don't see that as outright bearish.
QQQ remains the cleanest expression of the AI trade, mega-cap concentration, and long-duration equity exposure. The trend is still firmly up.
What changed is the willingness to pay for protection.
The options market is pricing roughly a ±$24.86 move next week (~3.6%), implying a 1SD range of approximately $670-$732.
After months of strength and a $VIX near the lows, it only took one rates-driven selloff for demand to shift from chasing upside to owning downside insurance.
1
1
208
Asymmetric Opportunities retweeted

Jun 8
$UBER: New post out this morning on “What the Options Market is Pricing for $UBER.”
Partnered up with @Stock_Inf0 for this one. Some great insight into the options market and some unique options to play your Uber position.
Highly recommend checking it out. Link in bio.

1
1
9
1,072
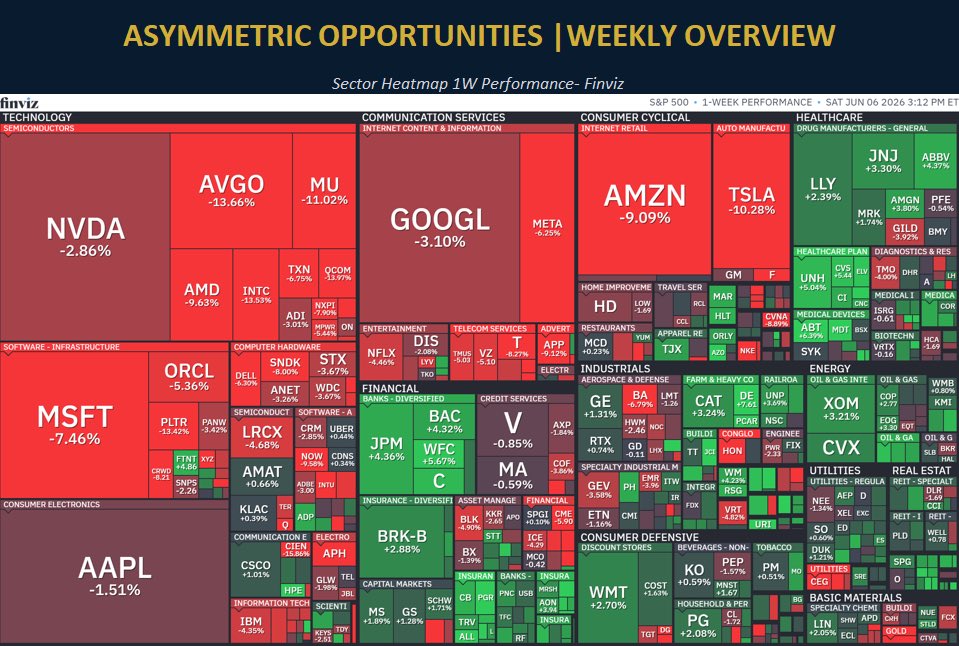
Performance heatmap of this week.
Notable are of course all the mega caps being red. $NVDA $GOOGL $AMZN $MSFT $AAPL $NFLX
As well as the biggest momentum leaders like $MU and $SNDK
Green week for healthcare $LLY and a lot of energy stocks, like $XOM $CVX.
It will be a super interesting week once again with high volatility expected, $SPCX IPO is just one of the catalysts to watch out for.
248
Just released an article called
“Theta is No Edge”, diving deeper into premium collection and why high win rates ≠ profitable strategies.
You know where to find the link ⬆️
1
178
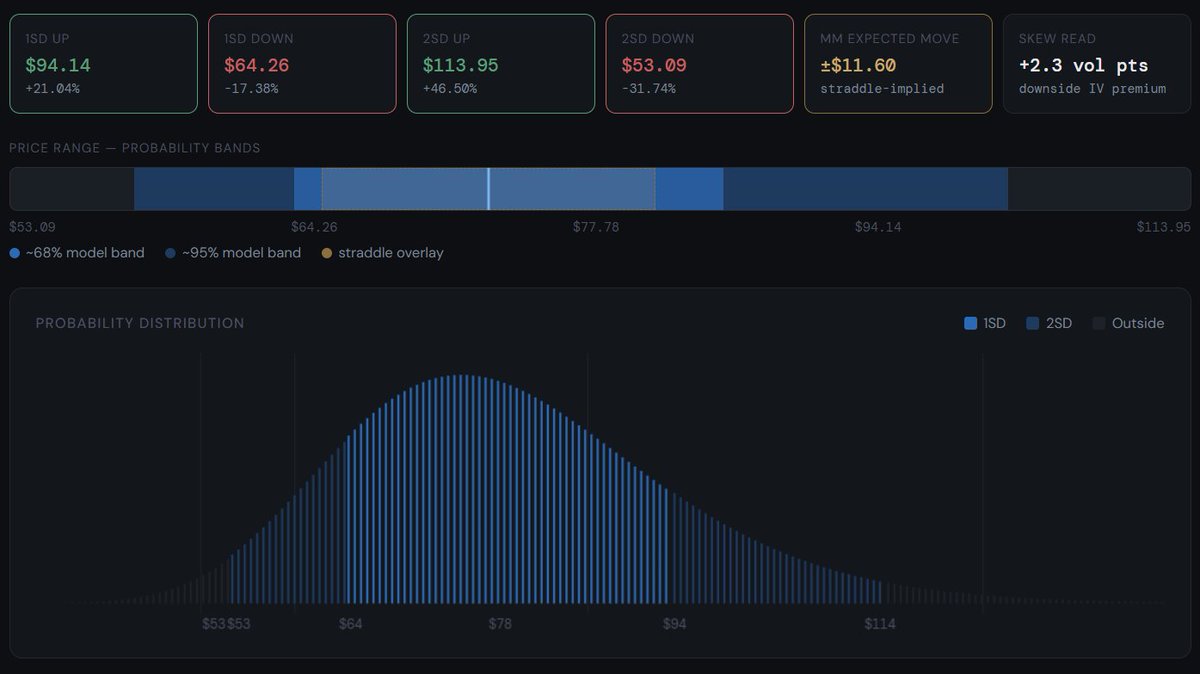
$RBRK reports earnings after the close today.
The options market is pricing a ±15% move, with ATM IV sitting above 300%.
- Spot: $77.78
- Expected move: ±$11.60
- Breakevens: $66.18 / $89.38
Put and call IV are almost identical, so there is very little directional signal in the skew. This is primarily a volatility trade.
I opened a small short straddle position to take advantage of the expected post-earnings IV crush.
Will realized volatility exceed what the options market is currently charging?
1
527
Asymmetric Opportunities retweeted
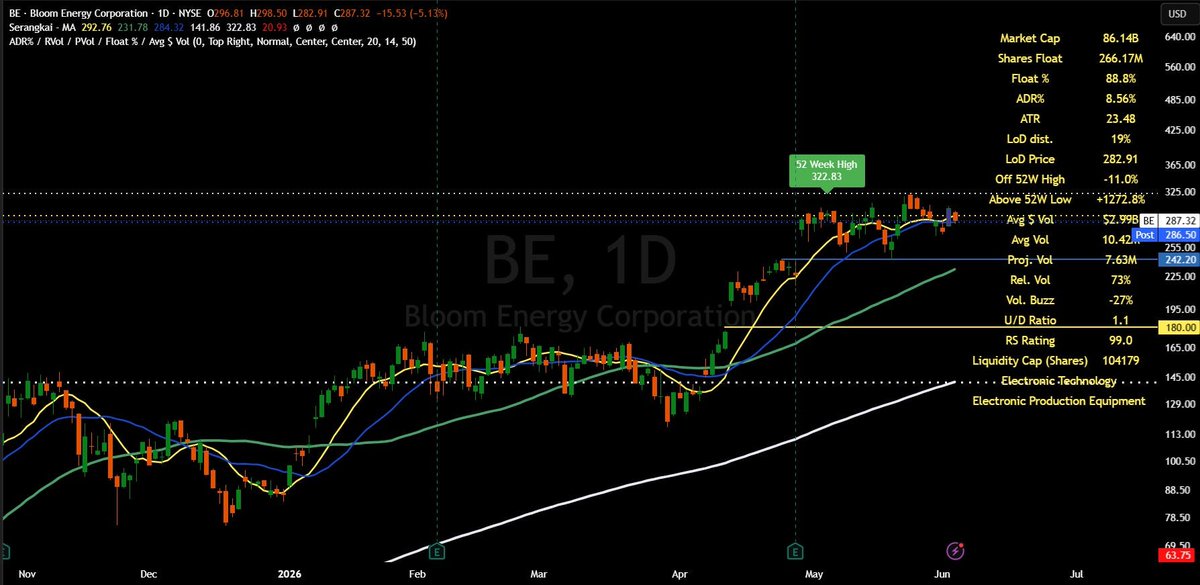
Opened a position before the close in $BE: Short BE Aug $180 puts (79 DTE).
- Spot: $287
- Strike: $180
- Premium received: $16
- Breakeven: $164
BE currently carries 122% ATM IV and an options-implied move of roughly ±$131 over the next 79 days.
1SD downside band sits at $163. The breakeven on this trade is almost identical.
The market is effectively paying me to underwrite a scenario where BE declines more than 43% from current levels over the next 79 days.
A 0.137 delta strike, strong premium, and a breakeven near the modeled 1SD downside range made the setup attractive enough to take.
The chart looks quite good as well, high momentum name. Consolidating around the 10 and 20 daily MAs. Rising 50D EMA.
Could definitely break down and drop fast, but we have the cushion and the time to manage if necesary.
Position size remains small, but willing to add if the stock breaks out above the ATH again.
Always do your own DD.
1
423
Trouble in $MSTR paradise?
Let’s see how strong their conviction is.

It's official.
MicroStrategy, $MSTR, is now facing its biggest unrealized loss in history, at -$10.8 billion.
In other words, after 6 years of buying Bitcoin, the company is now down -17% on its position.
By comparison, the S&P 500 is up 116% over this same timeframe.
Since MicroStrategy sold 32 Bitcoin at $77,135 per coin, their positions has lost -$11.8 billion in value.
This puts MicroStrategy's stock, $MSTR, down -77% since its record high.
Bear market is an understatement.

1
1
378
$AVGO earnings after the close.
The options market is pricing a move of ±$44.10 (±9.1%) over the next 2 days.
Current setup:
• Spot: $485.05
• ATM IV: 140.2%
• 25Δ Call IV: 163.8%
• 25Δ Put IV: 142.0%
• Upside skew: 21.8 vol points
What's interesting isn't the size of the move.
It's the skew.
Even into earnings, traders are paying a substantial premium for upside exposure.
The options surface remains tilted toward a positive surprise despite the stock already being one of the biggest AI winners of this cycle.
Model range:
📈 1SD upside: $549.58 ( 13.3%)
📉 1SD downside: $428.10 (-11.7%)
The market is still willing to pay more for upside convexity than downside protection.
Tomorrow we'll find out whether that optimism is justified.
1
8,122
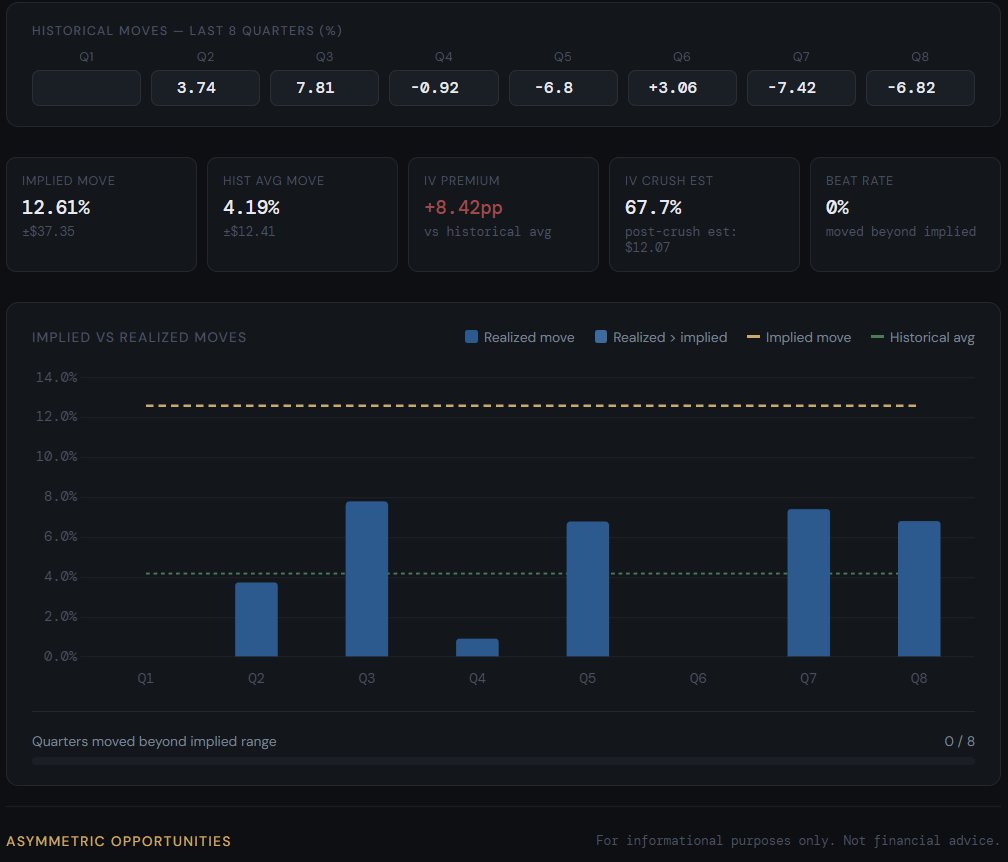
Closed my $PANW short straddle for a solid ~40% gain.

$PANW earnings after the close.
The options market is pricing a ±12.6% move.
Historical average move over the last 7 quarters:
~4.2%
More notable: 0 of the last 7 quarters exceeded the currently implied move.
Current setup:
• IV premium: 8.4 percentage points
• Estimated IV crush: ~68%
• Implied move is roughly 3x historical realized
The market is paying a substantial premium for uncertainty. Historically, that premium has not been justified by realized post-earnings volatility.
Opened a short straddle as part of my IV earnings crush as $PANW fullfills the criteria. Always super small sizing on these. 0.5% of the account as these can move violently.
308
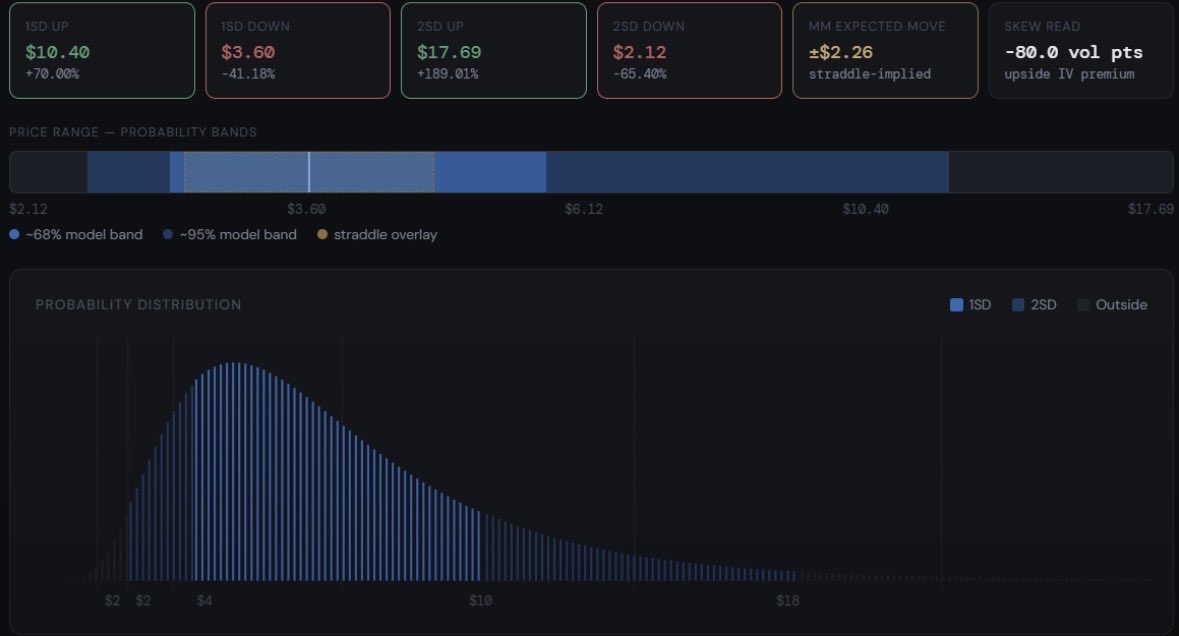
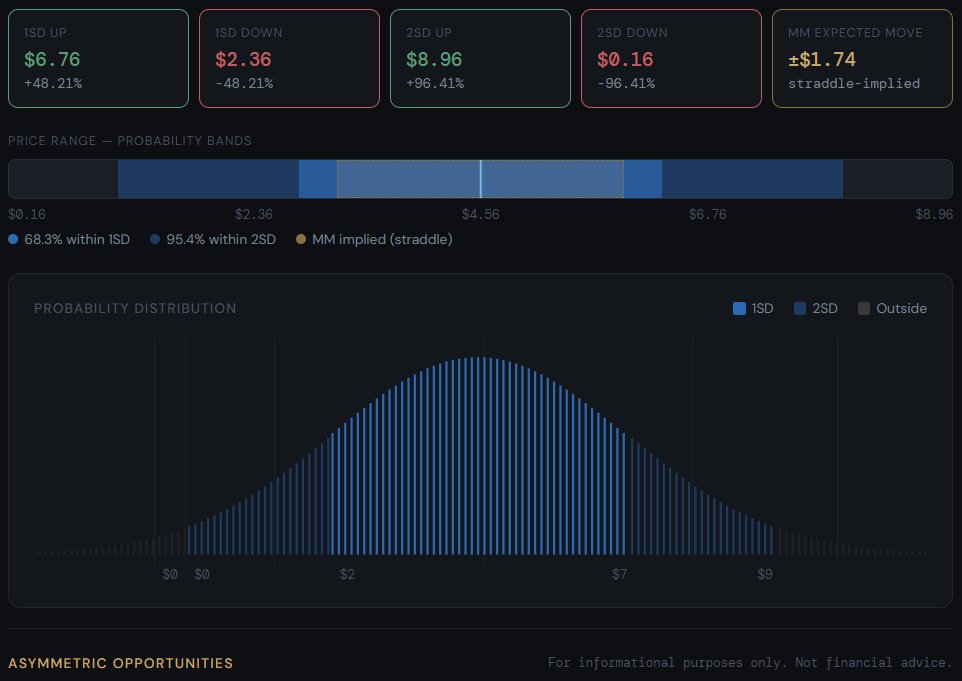
$SPCE There was a lot of focus on the stock losing 40% in a single session. Currently, there is massive speculation going on on the stock.
I think the more interesting story is what's happening in the options market.
Current setup:
- Stock price: ~$4.46
- DTE: 15 days
- ATM straddle: ~$1.80
- Implied move: ±40% (in 15 days!)
At first glance, that's already a huge amount of uncertainty. But what makes it even more interesting is the skew.
- 25 Delta Call IV: 382.7% - 11C
- 25 Delta Put IV: 218.7% - 4P
In other words, traders are willing to pay dramatically more for upside exposure than downside protection.
Normally, after a move like this, you'd expect investors to scramble for downside protection. Instead, the market is still aggressively bidding for upside calls.
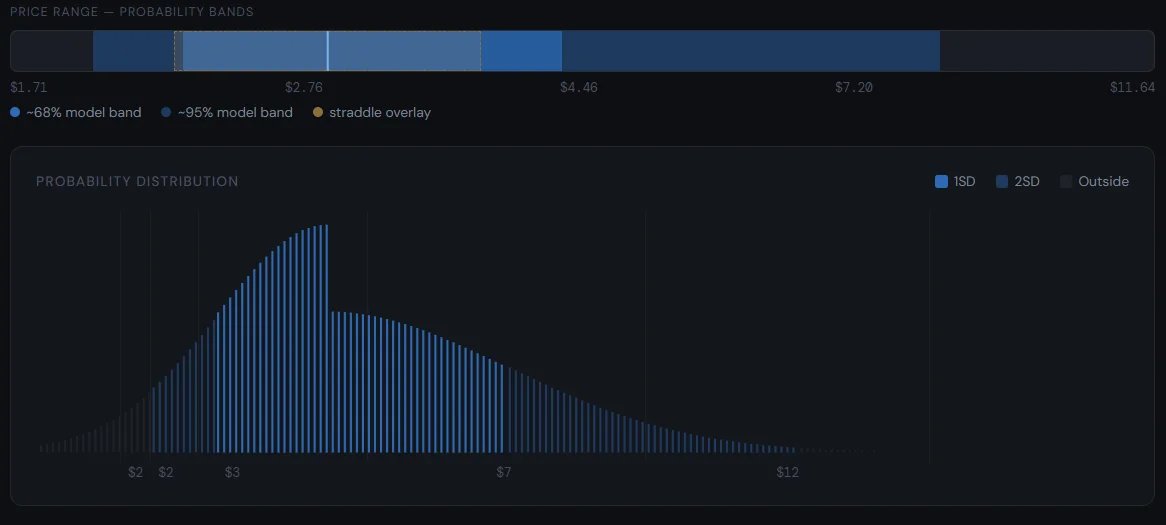
What the distributions show:
This first chart uses a standard lognormal framework. Keep in mind, this is a simplified model, we are not taking every single strike and its respective IV into account.
However, wou can still clearly see the market is pricing an extremely wide range of outcomes over the next 15 days.
The second chart incorporates the actual options skew (only the 25 delta IVs, so again a simplified model).
This is where things get interesting. Because call IV is significantly higher than put IV, the distribution shifts noticeably to the upside.
This clearly isn't a balanced set of outcomes. The market remains obsessed with upside convexity.
Why?
We all know this one already. SpaceX.
There has been increasing speculation around a future SpaceX IPO, and many retail traders appear to be treating SPCE as a proxy vehicle for anything related to commercial space and apparantly a core part of the thesis is that $SPCE will be the most common error for people actually looking to buy $SPCX
Whether that logic is correct is a completely different discussion. The options market doesn't care if the narrative is rational, it only cares that people are willing to pay for it.
$SPCE is an interesting case study. I will probably stay on the side for this one, but curious to hear if anyone is trading this currently.
2
413
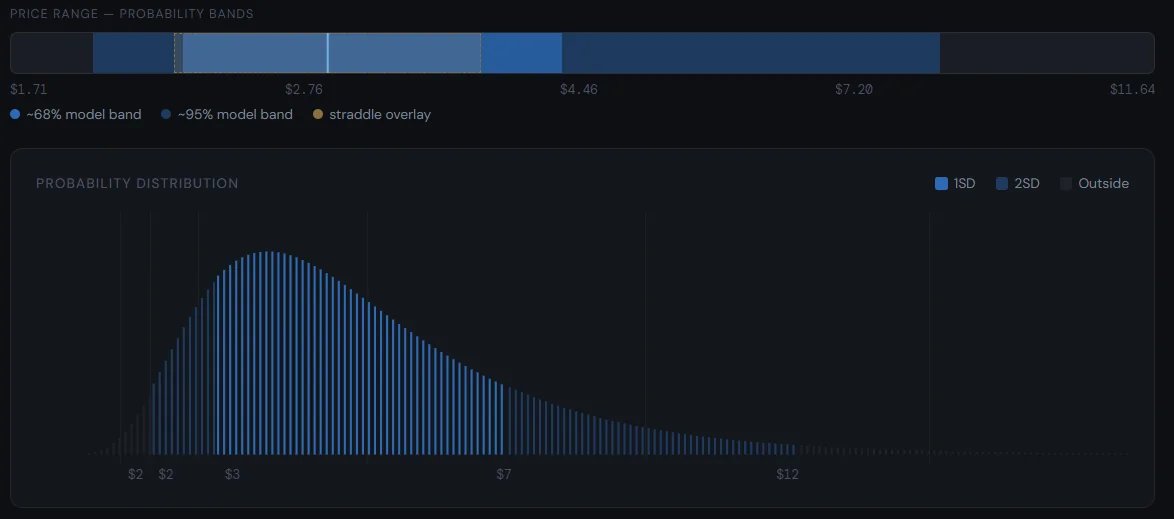
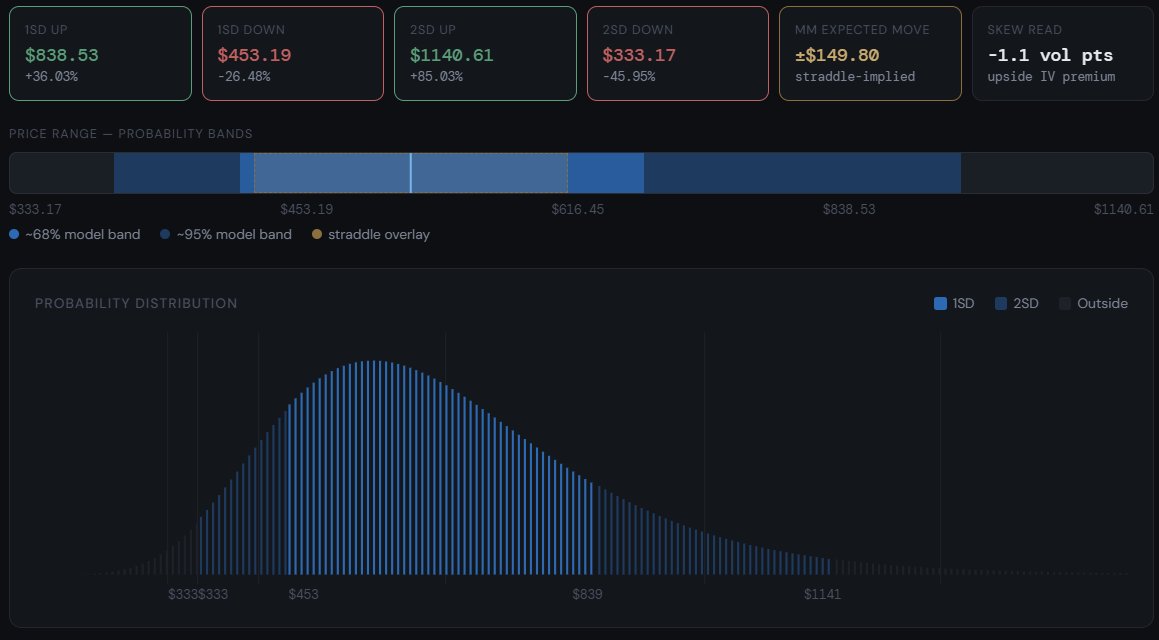
$META | January 2027
- Spot: $616
- Expected move: ±$150
- 1SD range: $453 - $839
- 2SD range: $333 - $1,141
Despite a $1.5T market cap, the options market still assigns a meaningful probability to $META appreciating another ~36% from here over the next 226 days.
This would put the stock comfortably above ATH again.
Upside calls continue to trade at a slight premium to downside puts.
Positioning matters and the options market continues to lean optimistic.
3
301
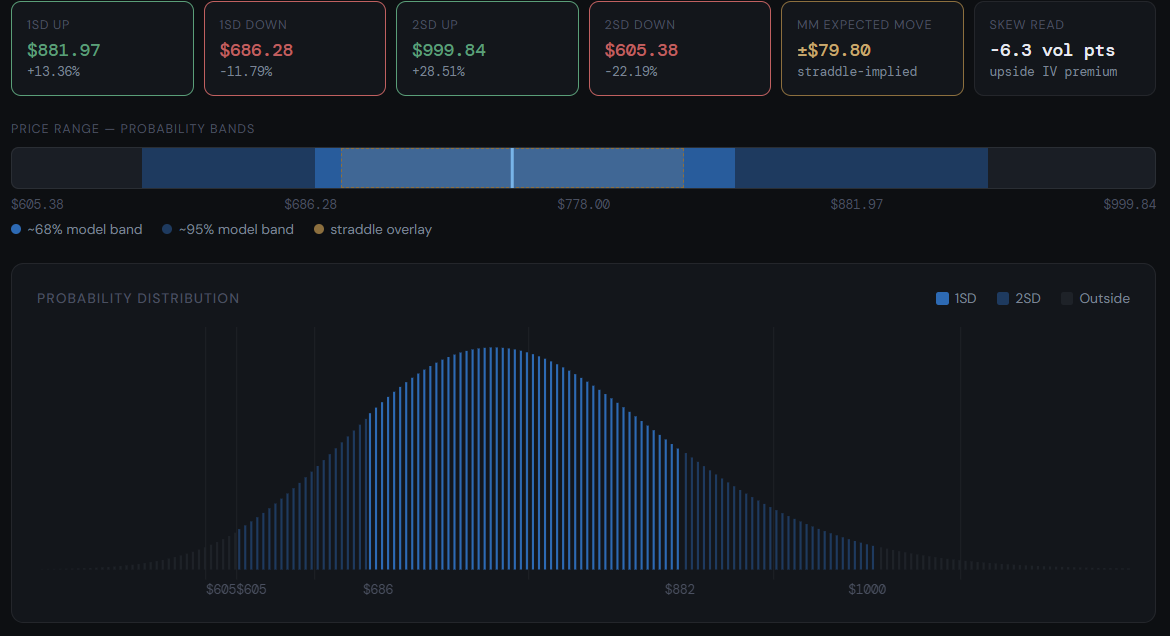
$CRWD earnings after the close.
Current setup:
• Expected move: ±10.3%
• Skew spread: -6.3 vol points
• Upside calls trading at a premium
Clear story:
Investors appear more worried about missing an upside surprise than protecting against a downside miss.
Downside 1SD move $91.72 / -11.79%
Upside 1SD move $103.97 / 13.36%
Let's see if the earnings will justify this pricing.
1
2
1,551