
Growth Stock Investor. Focused on finding & trading True Market Leaders. Lead PM tickermonkey.com/tml TML Model Portfolio.
Joined August 2014
- Tweets 14,560
- Following 96
- Followers 92,304
- Likes 6,389
7,812 Photos and videos


Pinned Tweet

8 Jan 2020
I'm excited to be working with @TCMLLC & tickermonkey.com to bring the TML Model Portfolio to fruition! This is a service of my passion for finding #TrueMarketLeaders, studying their big moves, capturing the move while applying a set of rules, (1/3)
93
24
243
21h
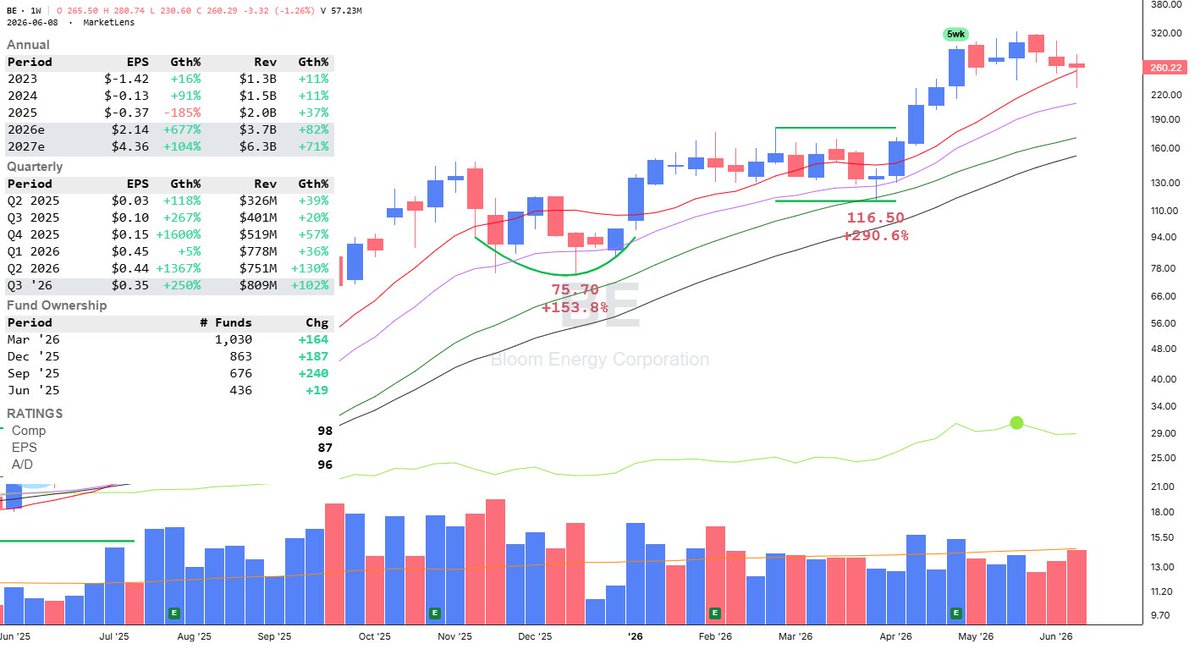
$BE undercut the 50-day SMA on Wednesday, then reclaimed this moving average on Thursday with an inside day. It bounced off the 50-day/10-week lines on Friday. See if it continues to rebound next week and if it forms the right side of a new base.

2
41
4,168
21h
$VIAV undercut and reclaimed the 50-day SMA. It has been consolidating in a new base for 6 weeks (60.43 standard pivot) around the range of its recent earnings gap. Prior uptrend showed strong accumulation with 8 straight up weeks with blue skyscrapers on all 8 weeks.

1
37
4,079
21h
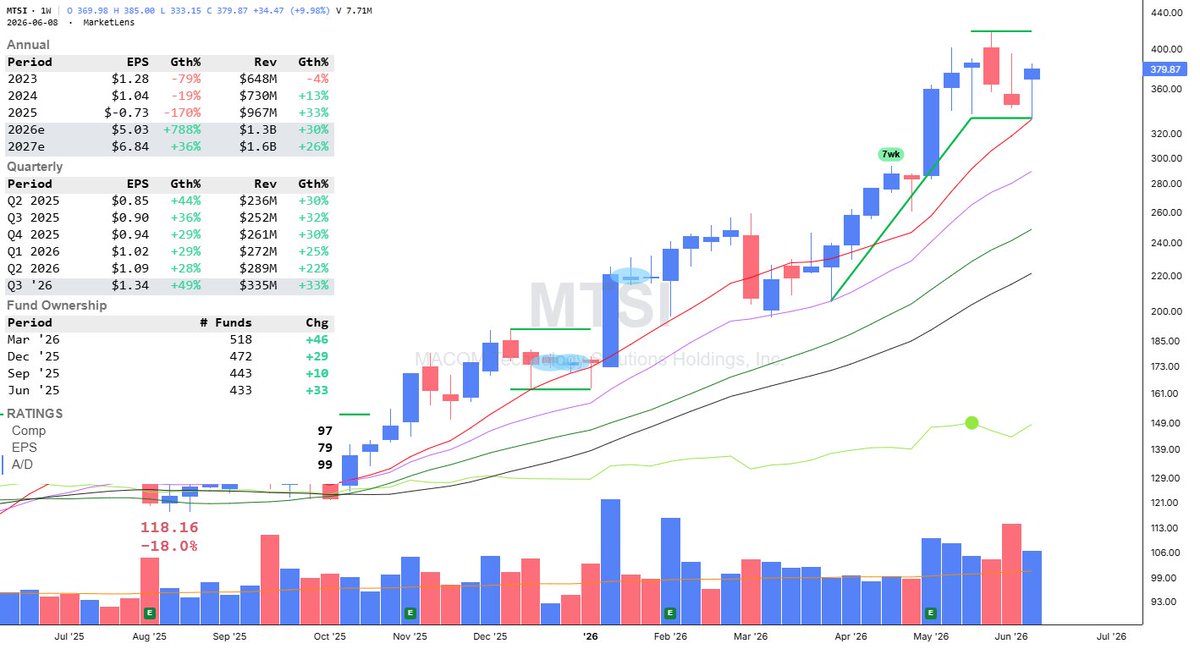
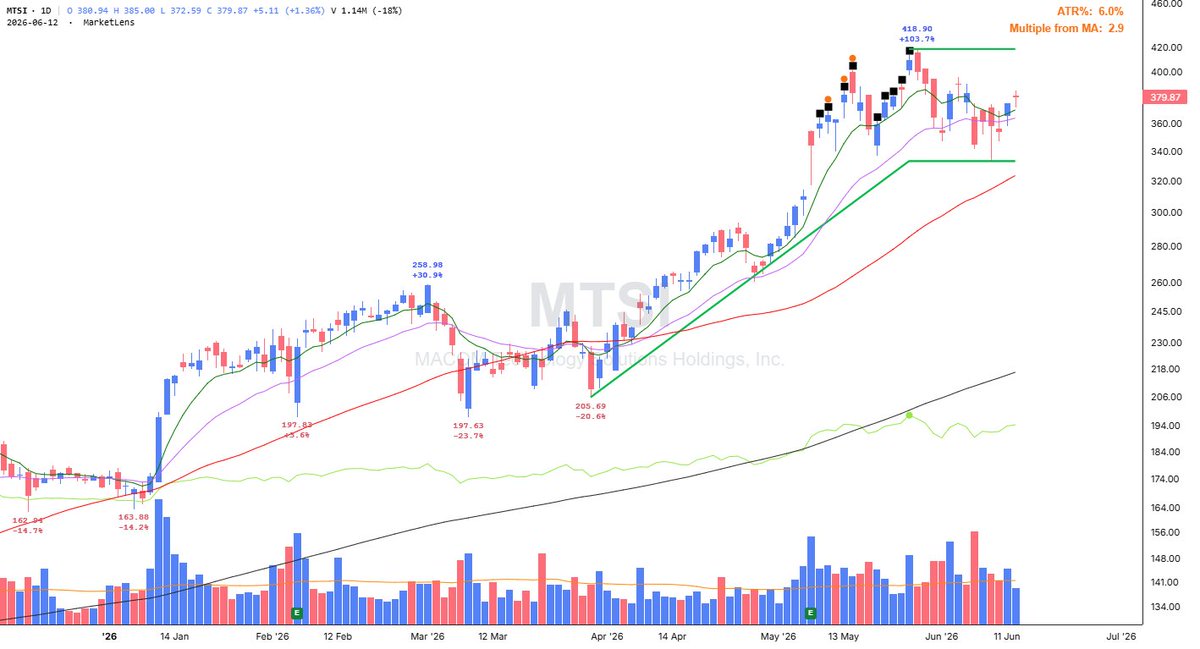
$MTSI found support at the 10-week line after shaking out at the 21-day EMA. It reclaimed the 21-day EMA on Thursday, then closed the week with a 9.98% gain. It formed a high, tight flag (418.90 standard pivot, pole length: 82.1% in 8 weeks, flag depth: -20.5%).
20
2,953
21h
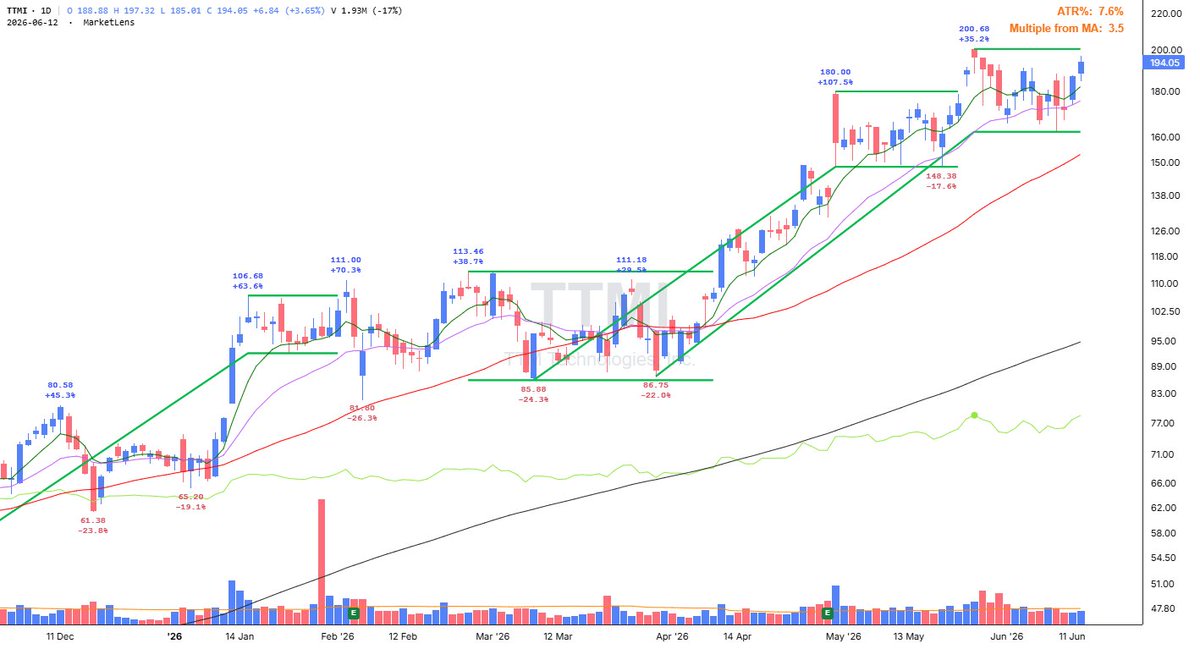
$TTMI has been consolidating around the 21-day EMA for about two weeks. It regained the 21-day EMA on Thursday, then followed up on Friday as it finished at a weekly closing high after clearing the prior week's high. Its weekly RS line is at a new high. It formed a new high, tight flag (200.68 standard pivot, pole length: 112.7% in 8 weeks, flag depth: -19.1%).
2
28
3,175
21h
$SMTC undercut and reclaimed the 21-day EMA on Tuesday, then rallied to close the week with a 10.39% gain and at a weekly closing high. RS line is at a new high. It formed a high, tight flag (172.35 standard pivot, pole length: 114.8% in 8 weeks, flag depth: -16.7%).

1
30
3,110
21h
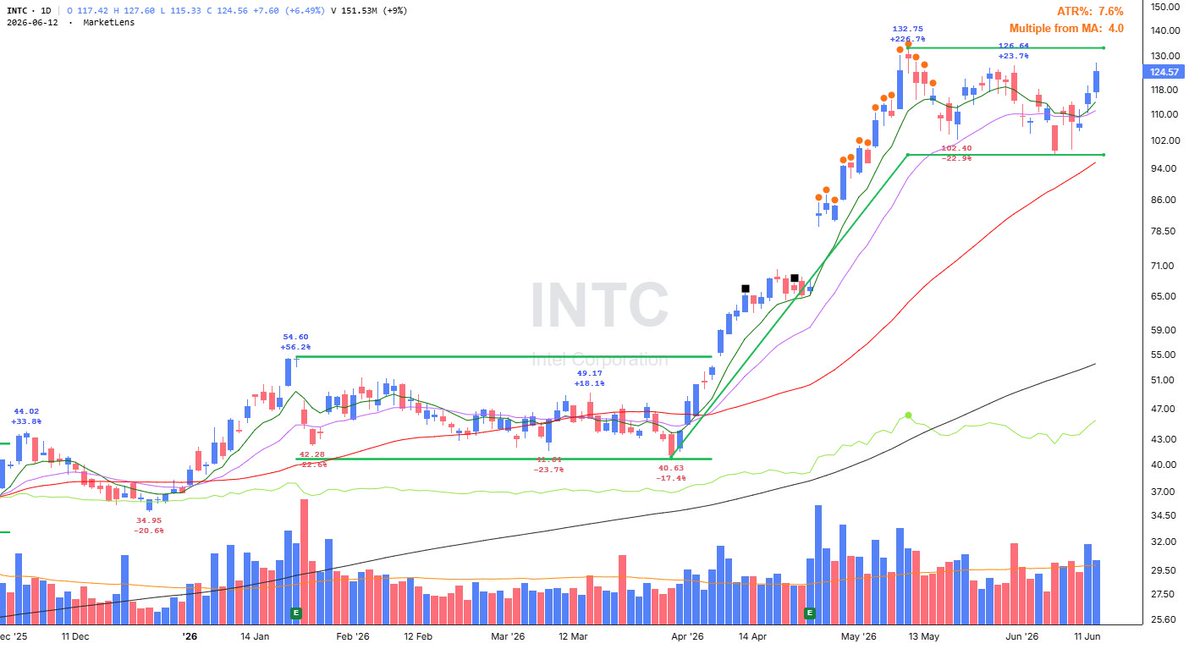
$INTC regained the 21-day EMA, then tested the 126.64 marked high of a developing high, tight flag (132.75 pivot, pole length: 226.7% in 7 weeks, flag depth: -25.9%).
Charts courtesy of @MarketLens_
4
42
4,893
21h
Weekend Review, 6/14: 60% to 80% Exposure
Most indexes reclaimed their 21-day EMA except for the Nasdaq.
Market strength was robust with strong gains from the Nasdaq 100, S&P 400, Russell 2000, and the Equal Weighted Indexes QQQE and RSP.
S&P 400, Russell 2000 and RSP closed at all-time highs.
Distribution Days: Nasdaq - 5, S&P 500 - 4
$QQQ $SPY $IWM $QQQE $RSP
Charts courtesy of @tradingview


23
3,066
Jun 10
Congratulations JT @TCMLLC and TickerMonkey on your incredible 13-year anniversary!
I’m truly happy and grateful to be your friend, partner, and a proud part of the TickerMonkey family. Thank you for creating a space where we all grow together as traders and as people.
Here’s to many more years of life lessons, and continued success!
Keep leading the way! 🙏🐒🦜🍷

With the help of my brother back on June 10th, 2013 at 12:00am we flipped the switch to go live for tickermonkey.com starting this journey of a like minded community with my fellow TickerMonkeys.
We have navigated every market cycle successfully as a team.
I have navigated the human experience with this community as well with so many unique personalities and life changes for many of them along the way.
To see people grow and have an impact on that growth in ways you didn't think about is truly a humbling thing. I am so grateful for, and completely blessed to be leading this TickerMonkey community.
I put my heart and soul into our community every single day. TickerMonkey has made me a better person as well as a better trader. I have definitely learned more about the human condition, myself, and people when it comes to the market and their money.
THANK YOU to ALL of the TickerMonkey family for your support of our community over these years. May we all continue to get better together with many more years of positive returns to come. God Bless You All!
HAPPY BIRTHDAY TICKERMONKEY!!!

1
22
9,709
Jun 7
$OSCR more than doubled from the bottom of its structure in 7 weeks as it reclaimed the 40-week / 200-day SMA. Last week, it finished at an all-time weekly closing high as it cleared an over 2-year resistance through the 23.80 level. Weekly chart showed a positive outside reversal as it formed a high, tight flag (25.58 standard pivot, pole length: 139.3% in 8 weeks, flag depth: -21.5%).

3
34
5,271
Jun 7
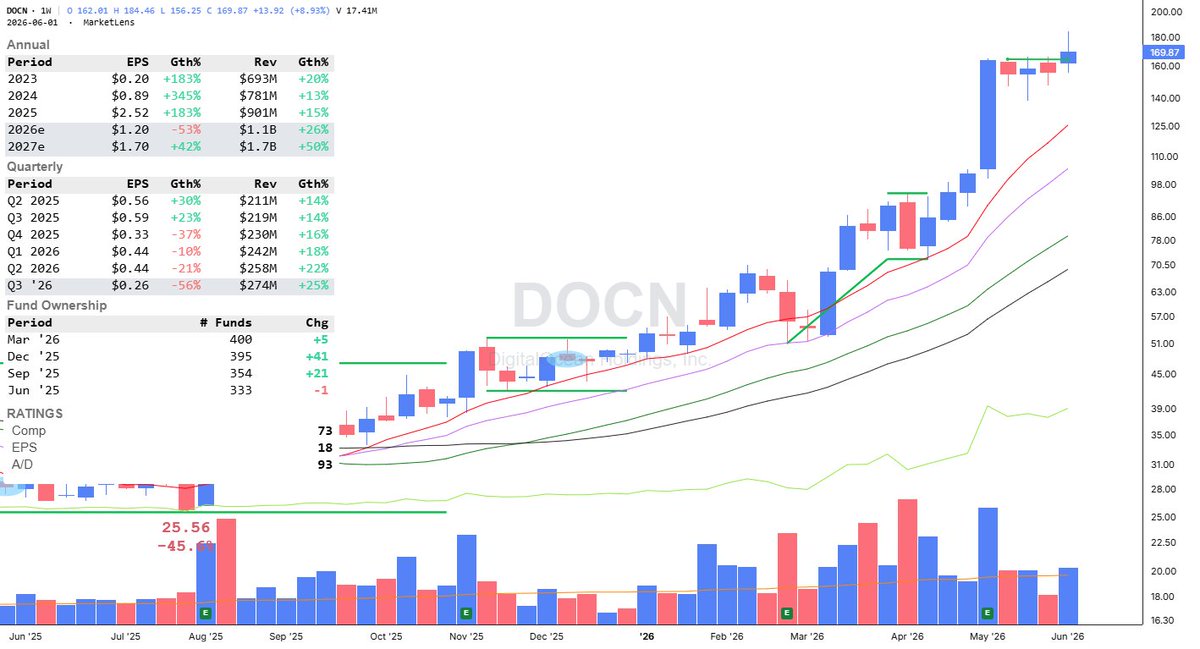
$DOCN cleared a tight 3-week consolidation around the range of its Power Earnings Gap (PEG) Day 2 Higher High on Monday on above average volume. It pulled back on Friday as it found support at the 8-day EMA. It showed RS as it gained 8.93% for the week.

1
3
39
6,200
Jun 7
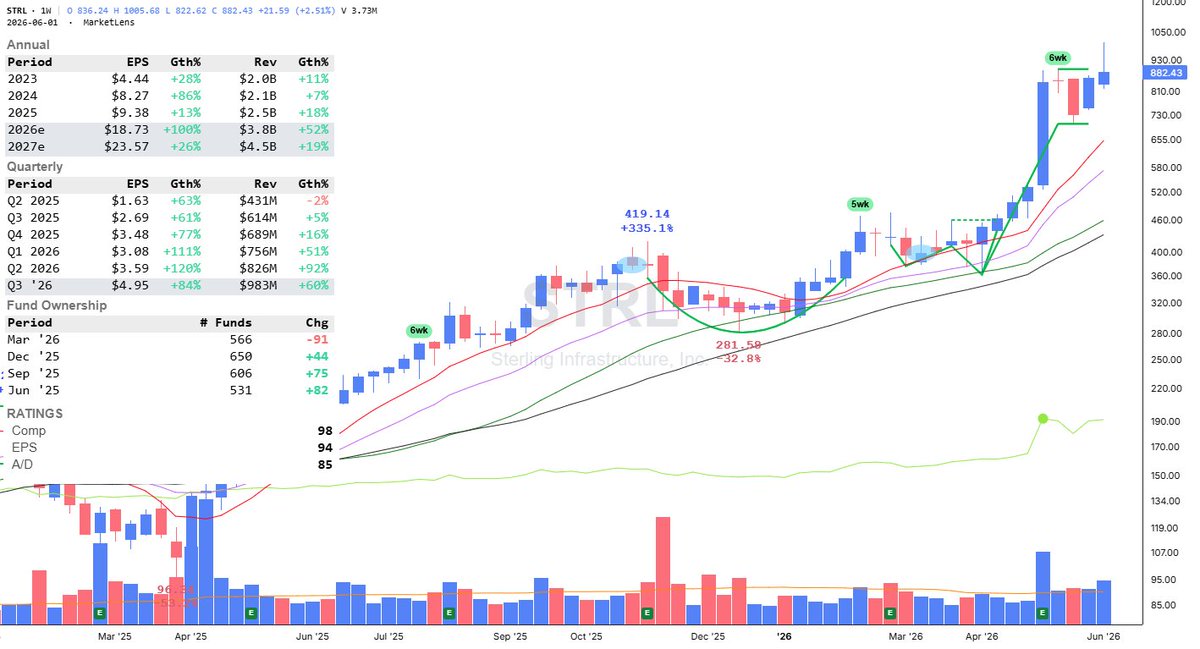
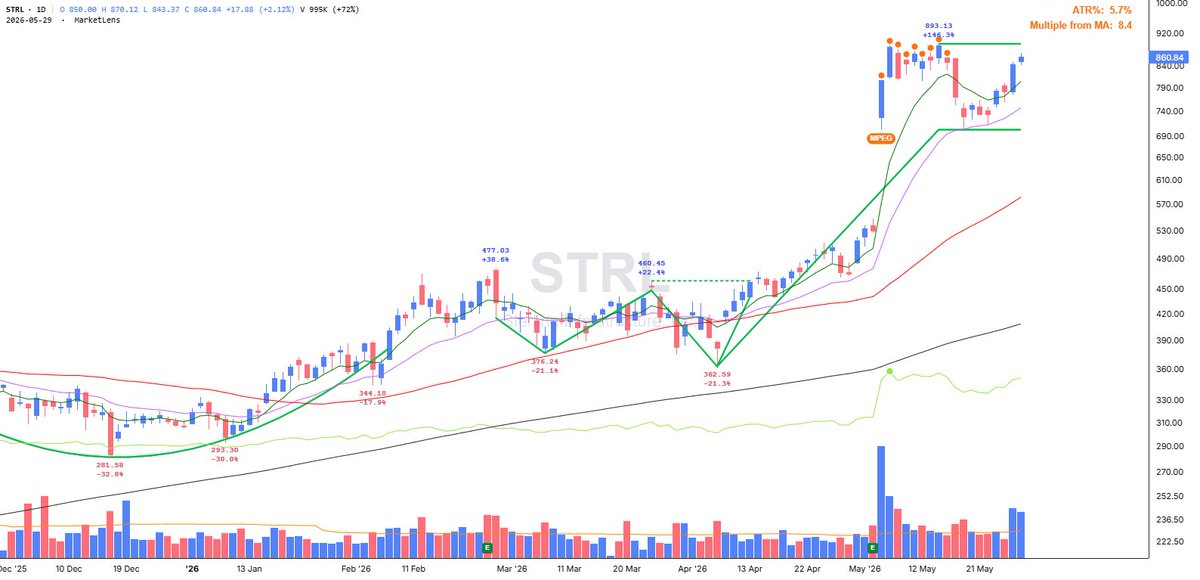
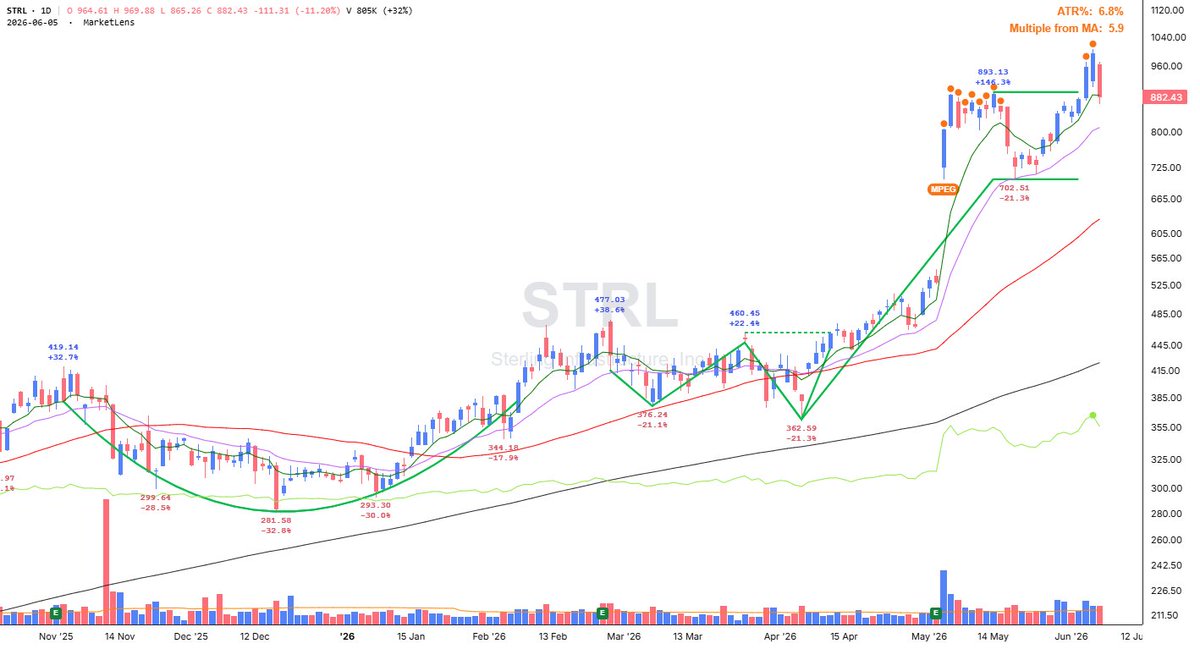
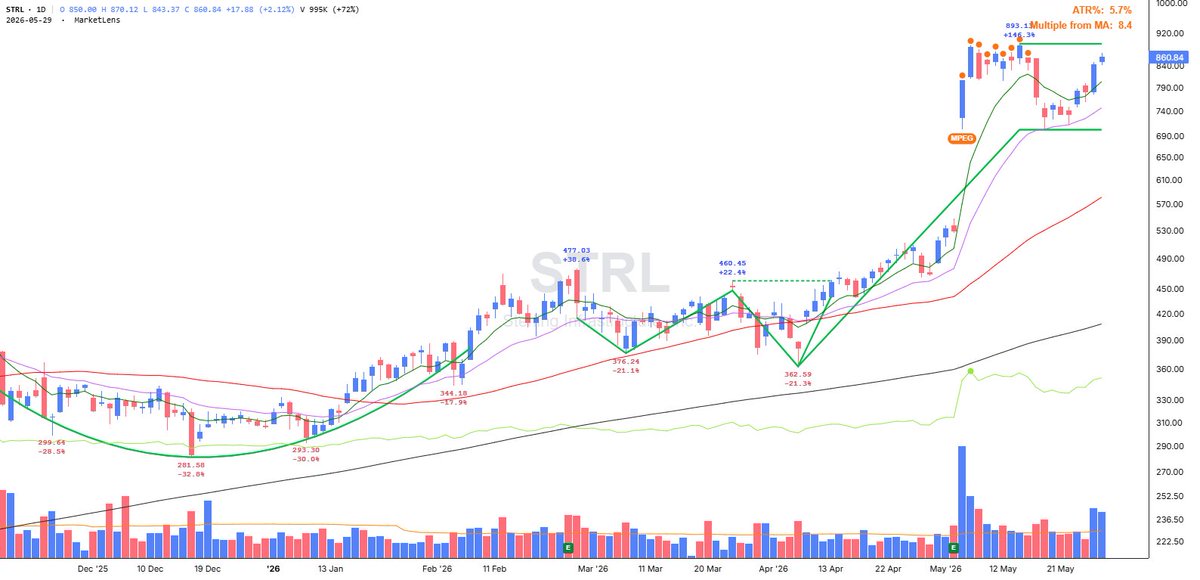
$STRL broke out of a high, tight flag (893.13 standard pivot, pole length: 146.3% in 6 weeks, flag depth: -21.3%) on Wednesday on heavy volume to close at an all-time high. On Friday, it pulled back and closed just below pivot. It showed RS as it gained 2.51% for the week.
35
4,661
Jun 7
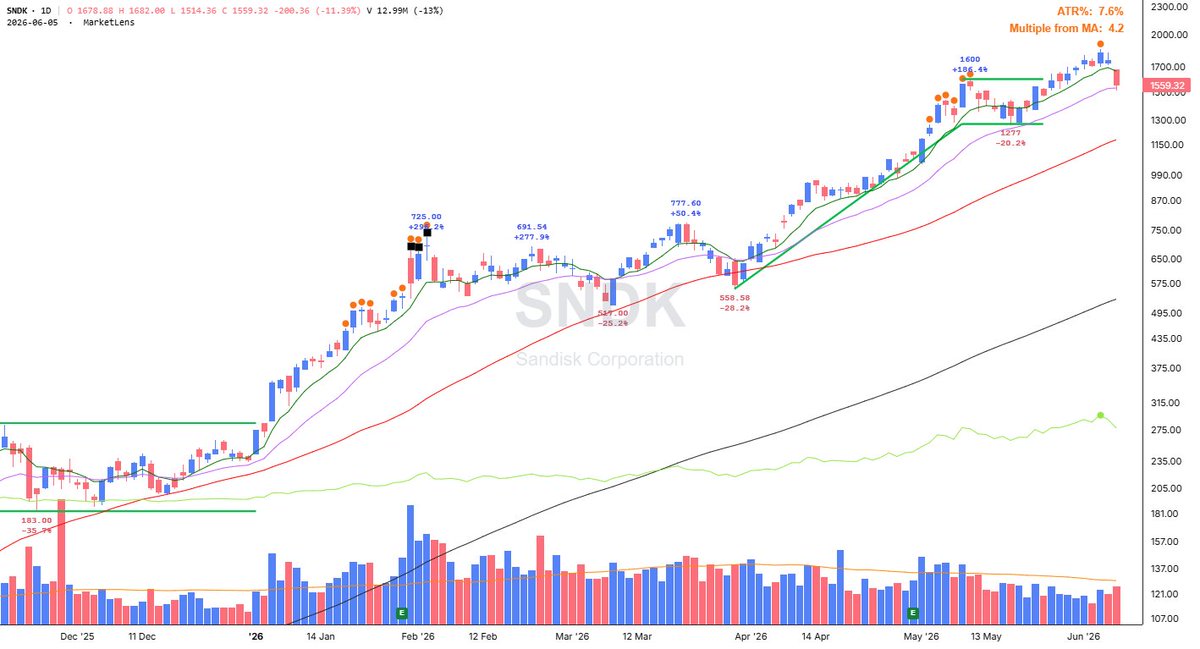
$SNDK gapped down on Friday and broke below the pivot of its high, tight flag (1600 standard pivot, pole length: 186.4% in 6 weeks, flag depth: -20.2%) on below average but a pickup in volume compared with the prior 9 sessions. See if the 21-day EMA will provide support, then watch if it can regain the high, tight flag pivot, preferably on heavy volume.
2
33
4,751
Jun 7
2
37
4,978
Jun 7
Select names that remained above their respective 8-day EMA sorted by @MarketLens_ Relative Strength Rating: $DELL $MRVL $VSH $AGX $OSCR $SNOW
Select names that remained above their respective 21-day EMA: $STX $WDC $SNDK $ARM $MU $STRL $NBIS $COHR $FLEX $ALAB $AMD $SMTC $STM $INOD $CRDO $AMAT $KLAC $BTSG $AVT $CRWD $AAON $HCC
1
8
52
6,618
Jun 7
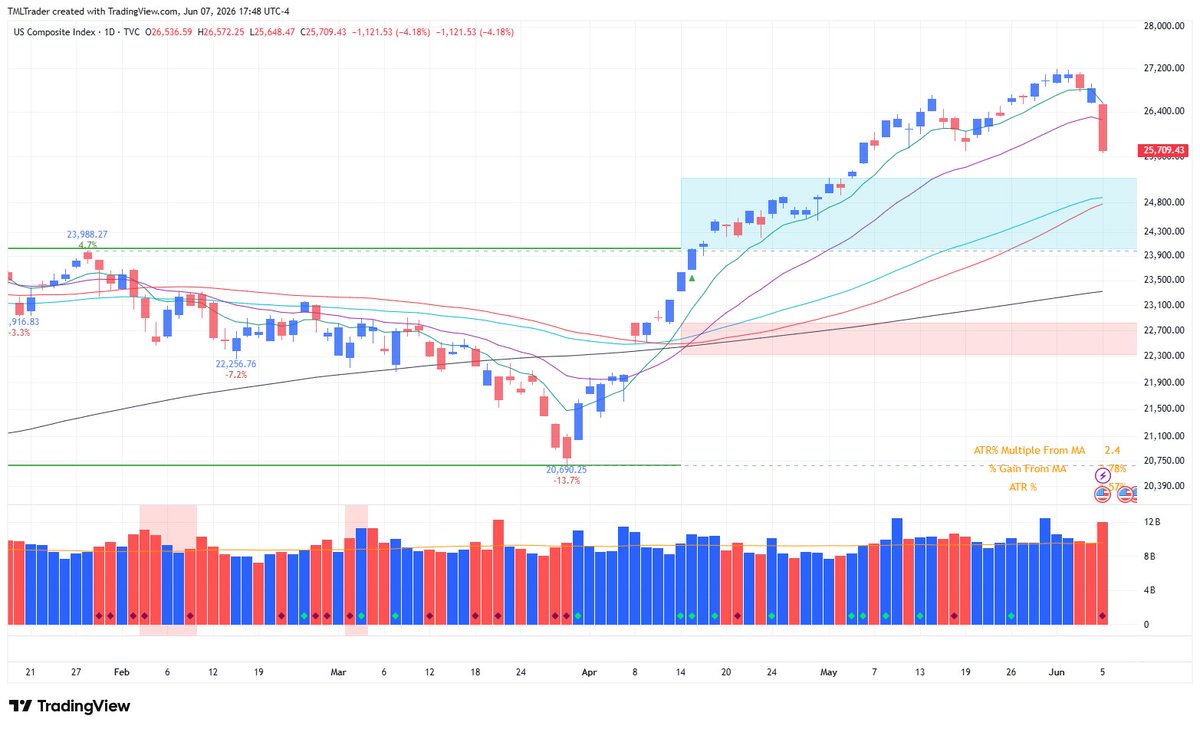
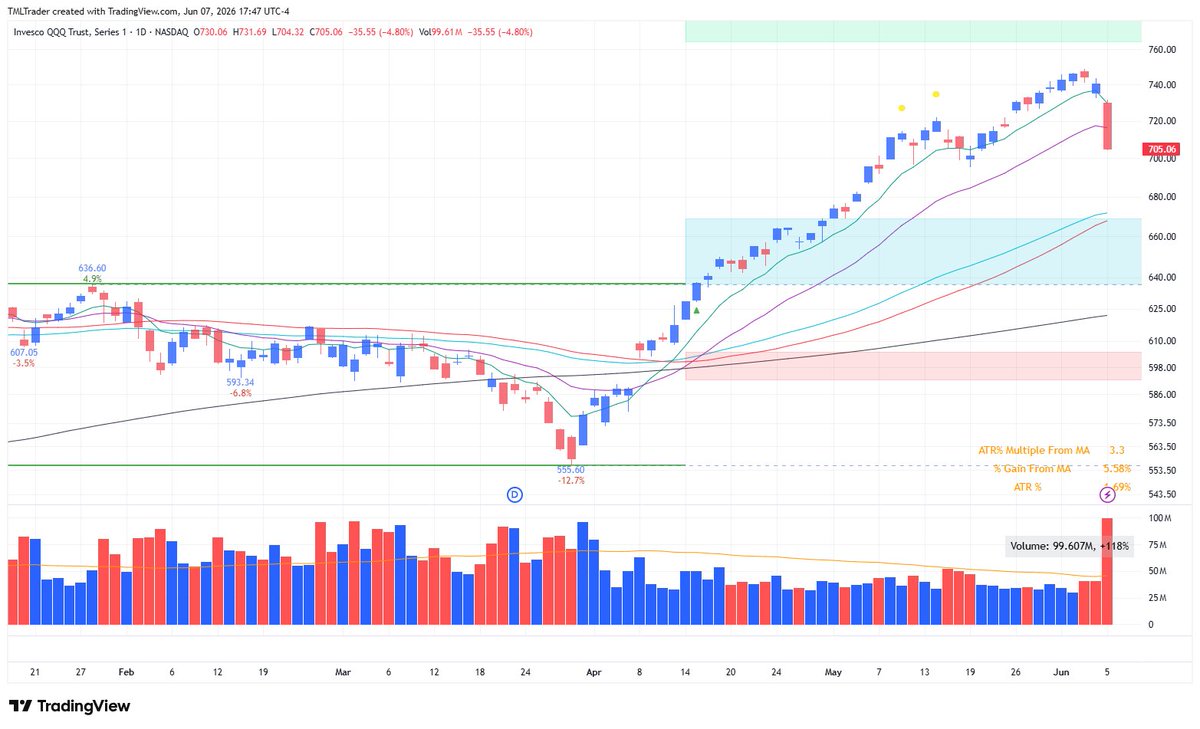
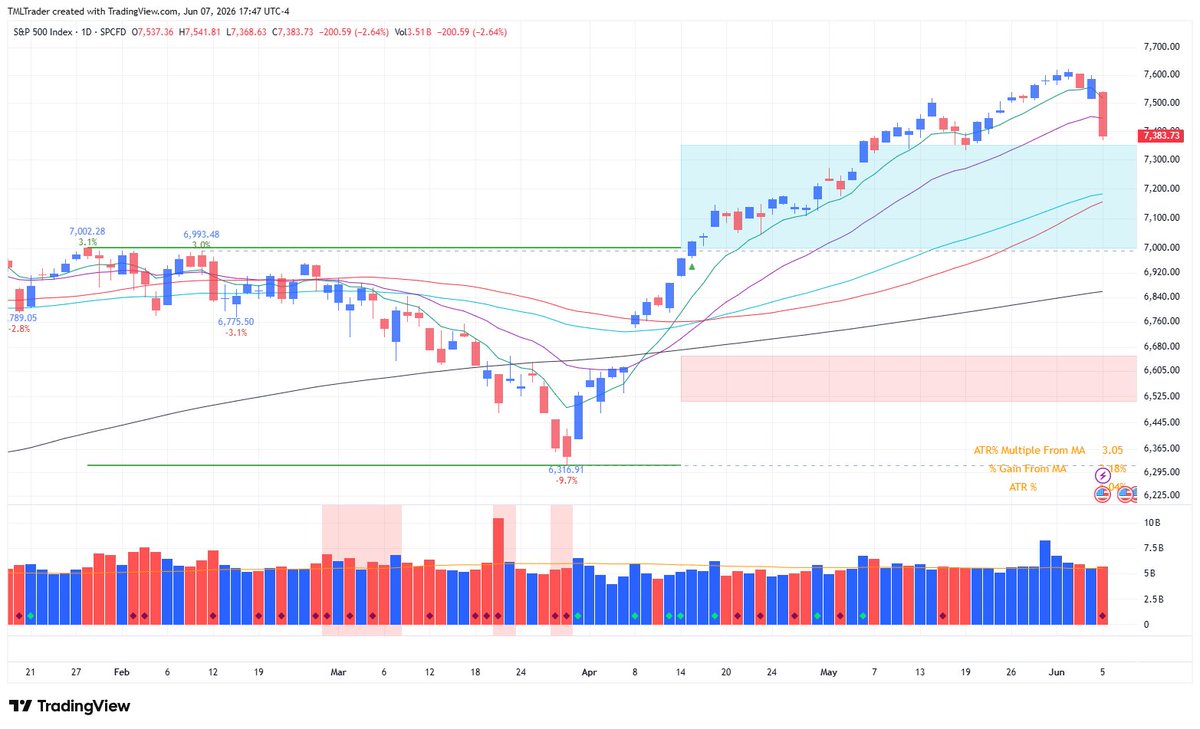
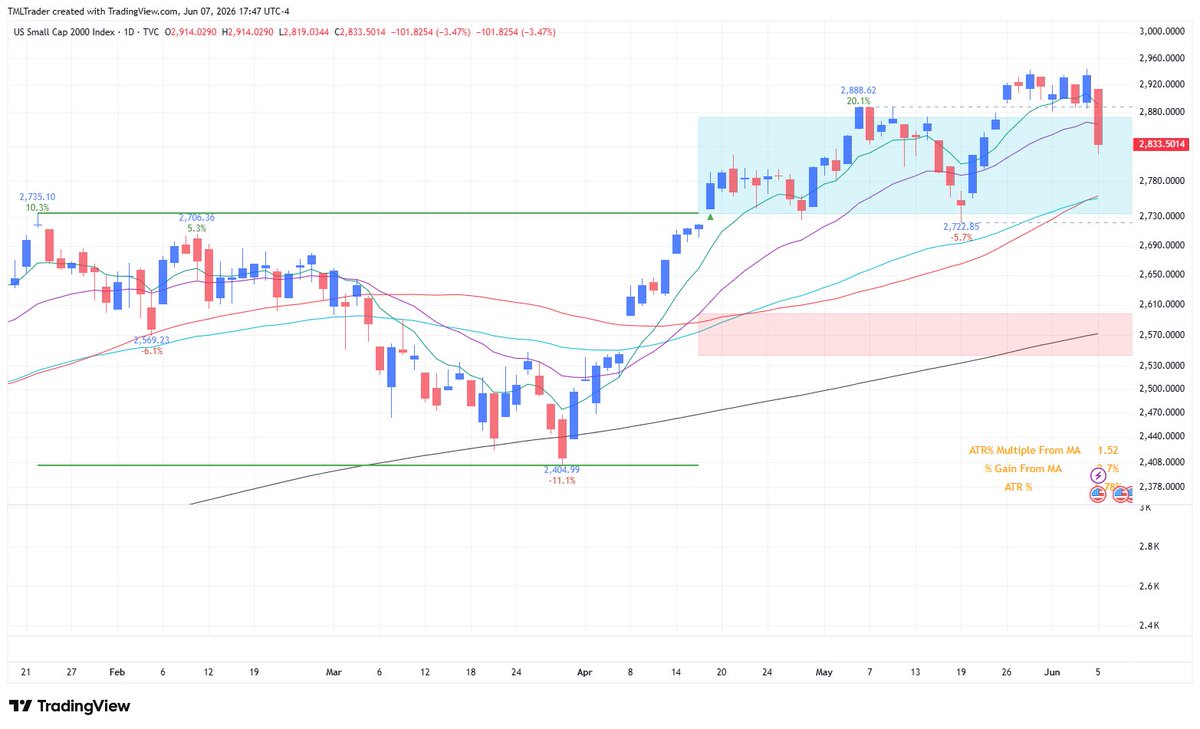
Weekend Review, 6/7: 60% to 80% Exposure
AI / technology stocks led the market sell-off on Friday.
Nasdaq, QQQ, QQQE, S&P 500 and Russell 2000 undercut their 21-day EMA.
Distribution Days: Nasdaq - 3, S&P 500 - 3
$QQQ $SPY $IWM $QQQE
Charts courtesy of @tradingview
1
2
28
4,226
May 31
$STRL rebounded off the 21-day EMA and the low of its Monster PEG. It finished at an all-time weekly closing high and ended near the pivot of a new high, tight flag (893.13 standard pivot, pole length: 146.3%, flag depth: -21.3%).
1
2
31
5,006
May 31
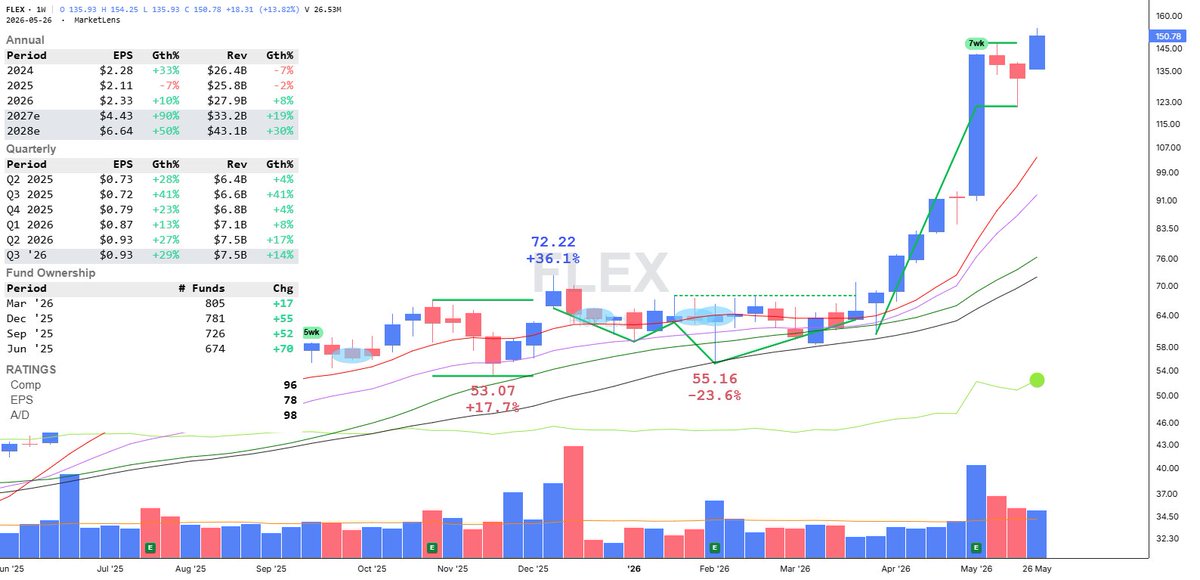
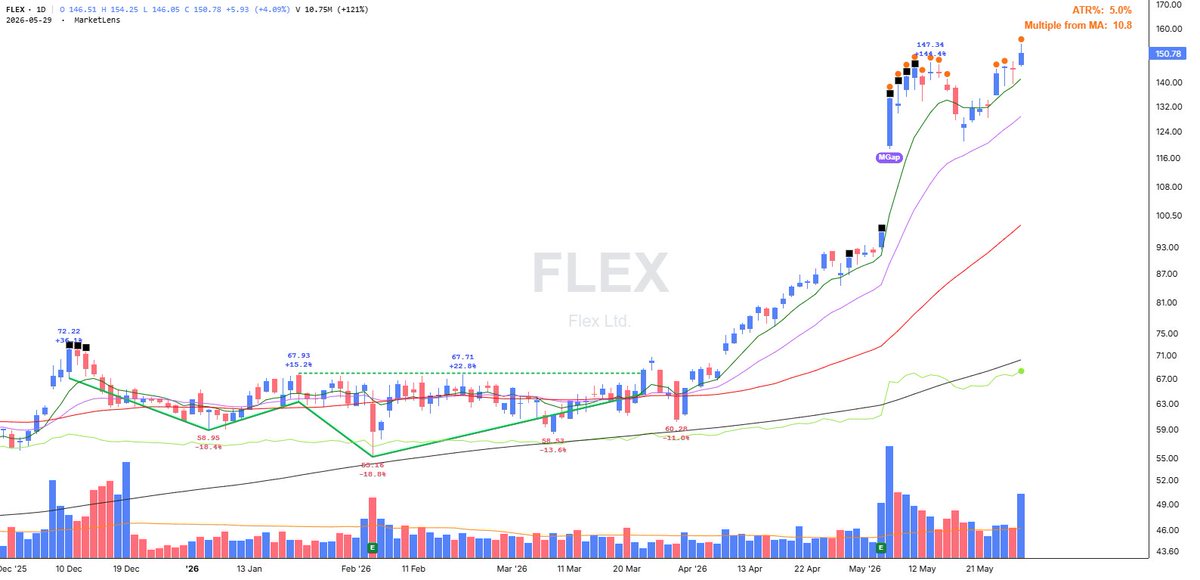
$FLEX cleared the pivot of a newly formed high, tight flag (147.34 standard pivot, pole length: 144.4%, flag depth: 17.7%) after reclaiming the high of its Monster Gap on Tuesday. It closed at an all-time high with the RS line at a new high.
1
24
4,722
May 31
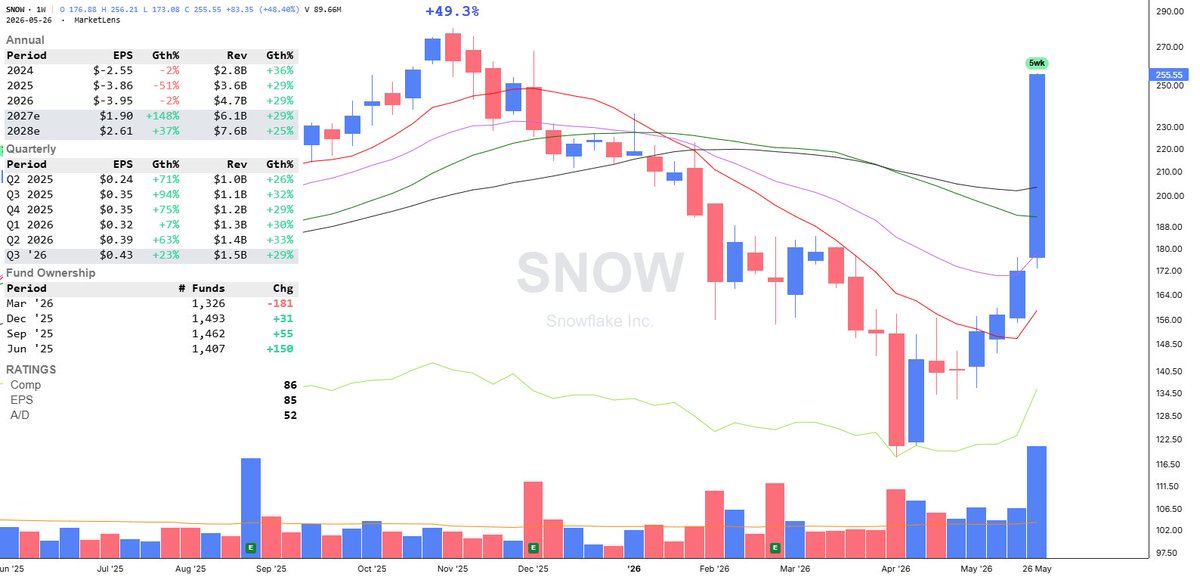
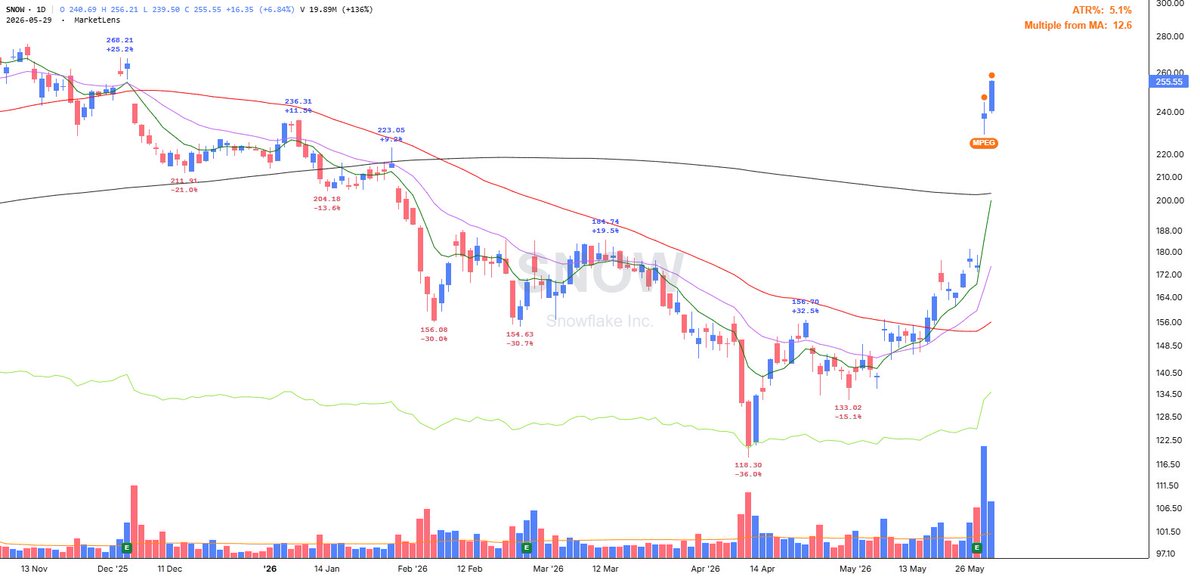
$SNOW had a Monster Power Earnings Gap (MPEG) on Thursday ( 36.48% on almost 5x average volume on 22.14% earnings surprise) as it gapped up above the 200-day SMA. It followed up with a Day 2 Higher High on Friday.
1
22
4,614
May 31
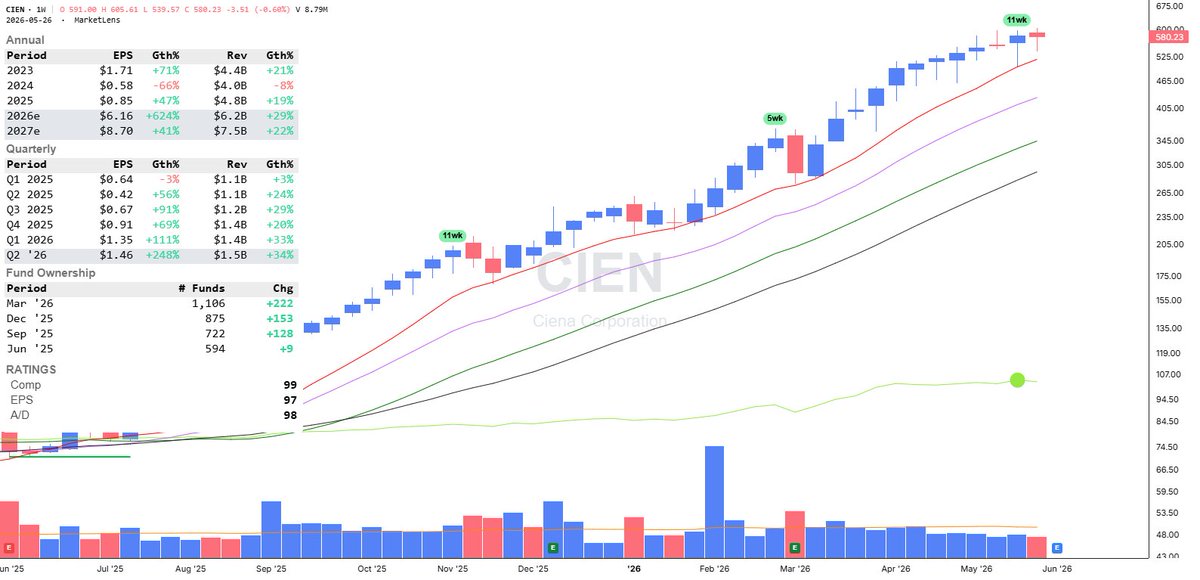
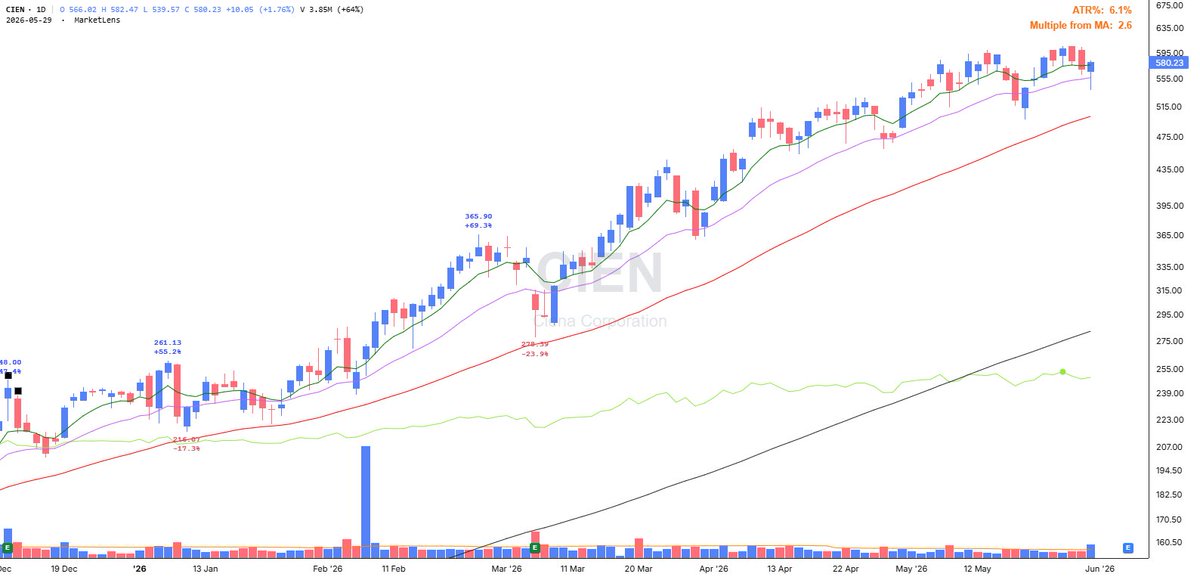
$CIEN undercut and rallied from the 21-day EMA to close with a 1.76% gain on Friday. It closed moderately lower for the week (-0.6%) as it broke the 11-week winning streak. Watch how it acts on earnings on Thursday, 6/4, BMO.
3
23
4,244