
Follower of Jesus | Trainee Tableau & Alteryx Consultant | @DataSchoolUK | #DS8 | Avid Photographer and Table Tennis Player
Joined June 2012
- Tweets 73
- Following 278
- Followers 470
- Likes 300
22 Photos and videos


Pinned Tweet

15 Oct 2018
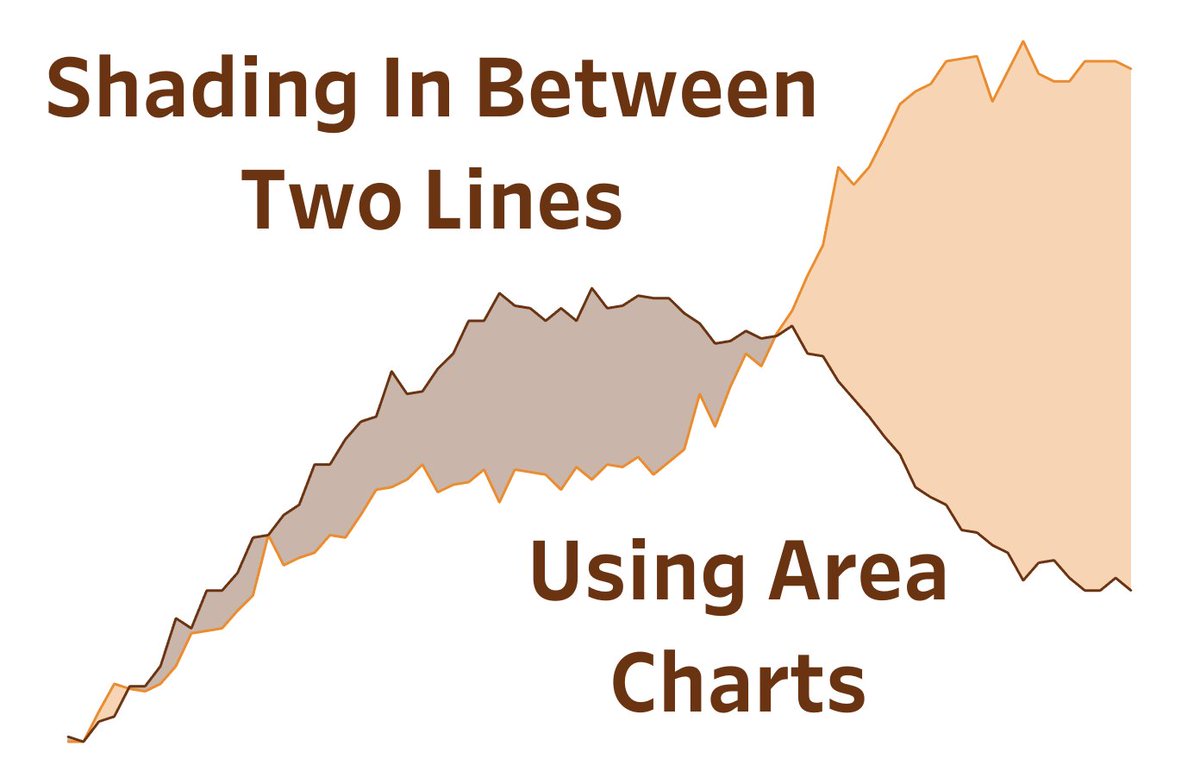
Here's my blog from June on how to shade between two lines in @tableau using area charts. I forgot to post this on twitter at the time, so I want to say a big thanks to @mikevizneros for working out how to do this! All I did was write about his technique. thedataschool.co.uk/timothy-…
3
4
25
Timothy Manning retweeted

20 Mar 2023
I don’t usually post personal news but Clinicians have told us to pull every lever.
Our daughter has with #dipg Brain cancer. There is no cure and typically 9m life expectancy.
If anyone knows of trials then please get in contact! #braincancer #childrenscancer @CR_UK

1,864
14,871
28,326
5,808,402
Timothy Manning retweeted

16 Aug 2022
Excited to share this blog post for my new #Tableau Extension!
Introducing TabCSS link.medium.com/FJ8u749txsb
20
30
137
8 Oct 2020
Really enjoyed watching #tableau Devs at Desks whilst getting commentary by @TableauTim and @Scribblr_42, check it out!
7 Oct 2020

What a blast! From myself and @Scribblr_42 we’ve throughly enjoyed the #data20 live streams and huge thanks to everyone who dropped in can’t tag you all but much love ❤️ if you missed it you can catch the replay here >> youtu.be/I_f4AoVWJ7o?t=768 #tableau

1
1
Timothy Manning retweeted

17 Aug 2020
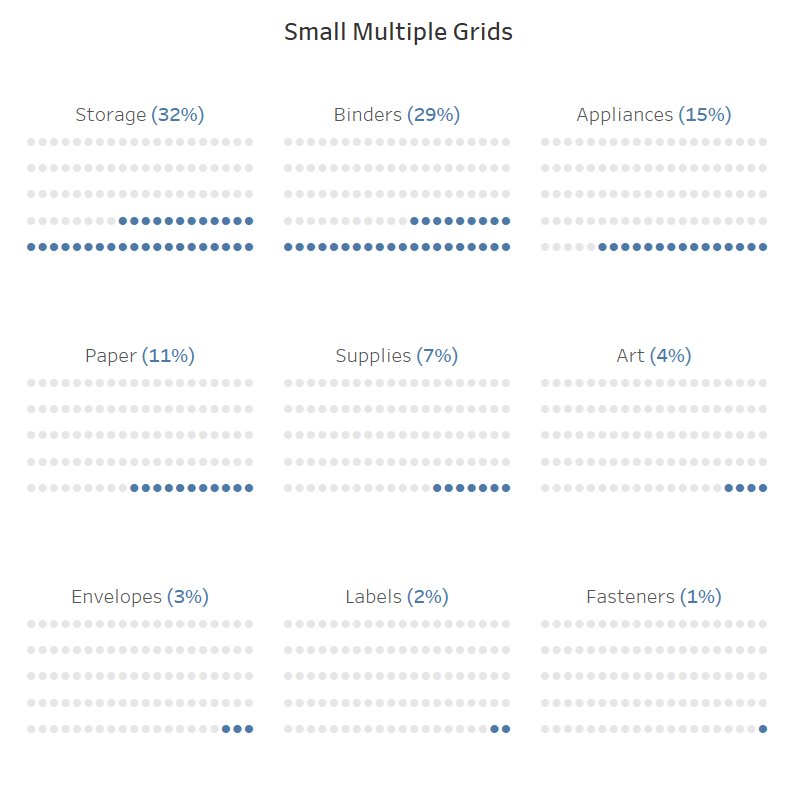
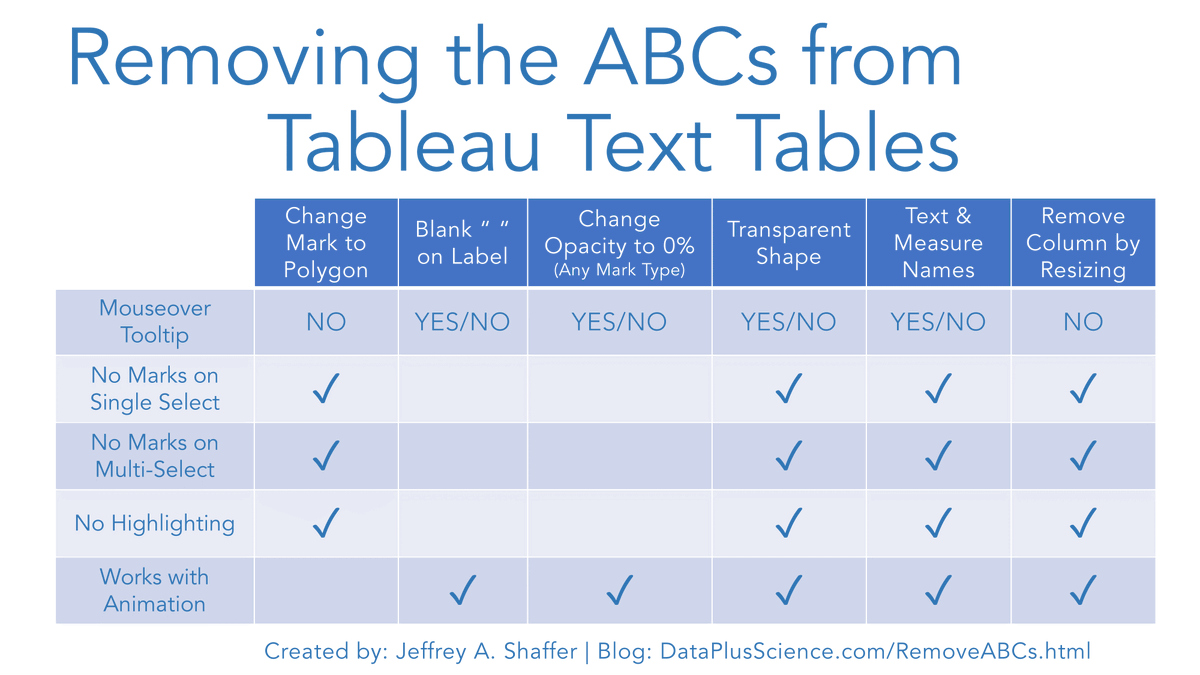
A final round up on Removing the ABCs from a text table. Here's a grid showing the various solutions. Transparent Shape, Text & Measure Names or Removing the Column by Resizing are 3 good solutions. I prefer just removing the column. More info here: dataplusscience.com/RemoveAB…
2
9
68
4 Feb 2020
This is excellently written Collin and well said!
2 Feb 2020

While it was still fresh in my mind, I decided to write a blog with advice for current and incoming cohorts @dataschooluk. I hope it provides some help adjusting to the intense and wonderful world of the DS. bit.ly/37S48dc
4

After reading @jonathandrummey's blog post on 'Using a parameter as a data source' (bit.ly/37HVjDf), I've been exploring the idea of drawing on dashboards with the same technique. More details in this blog post: bit.ly/2OsNGIW. A few examples below...
10
25
146
Timothy Manning retweeted

27 Nov 2019
Check out all of my @tableau TC19 Devs On Stage new feature videos including
- Dynamic parameters
- Data model
- Spatial buffer
- Animations
- Set membership control
& finally LoDs in Tableau Prep theinformationlab.co.uk/2019… on @infolabuk
1
6
27
Timothy Manning retweeted

24 Oct 2019
Took me a while but finally reached the pinnacle of the #Tableau Community Forums!
4
3
51
22 Oct 2019
I'm working on a few template business dashboards using the @tableau superstore data; here's the first one! Thanks @sanusi_hafeez for what I'm calling the 'Sanusi' info button and thanks to @infolabUK for feedback on the colours used @tableaupublic tabsoft.co/2p3BKUf
4
5
66
Timothy Manning retweeted

1 Sep 2019
My fav film composer is @HansZimmer!
Here's a viz that I made on @tableaupublic.
Data prep done using @alteryx and @rstudio.
I used Brian's blog to learn how to make the face in R.
@scallybrian' blog: bit.ly/2EfjQTK
Viz: tabsoft.co/30Qz7Ts
16
12
90
20 Jun 2019
Did you miss #data19 or #inspire19? Want the lowdown on what you missed?
Join us on the 24 June for the next-best-thing-to-actually-being-there: an evening recapping the key highlights from both Inspire and Tableau Conference Europe.
Sign up here: eventbrite.com/e/post-confer…
2
Been having a play with the the @tableaupublic API along with some #Tableau 2019.2 #beta features. Thanks to @HighVizAbility and @josh_tapley for the great blog posts on using this API. Really like the idea of popups for filters, search, help etc. in the right use case.
4
14
78
10 Sep 2018
Some sunrise shots I took of Tower Bridge, only a short walk from the new @dataschooluk building!

2
1
26
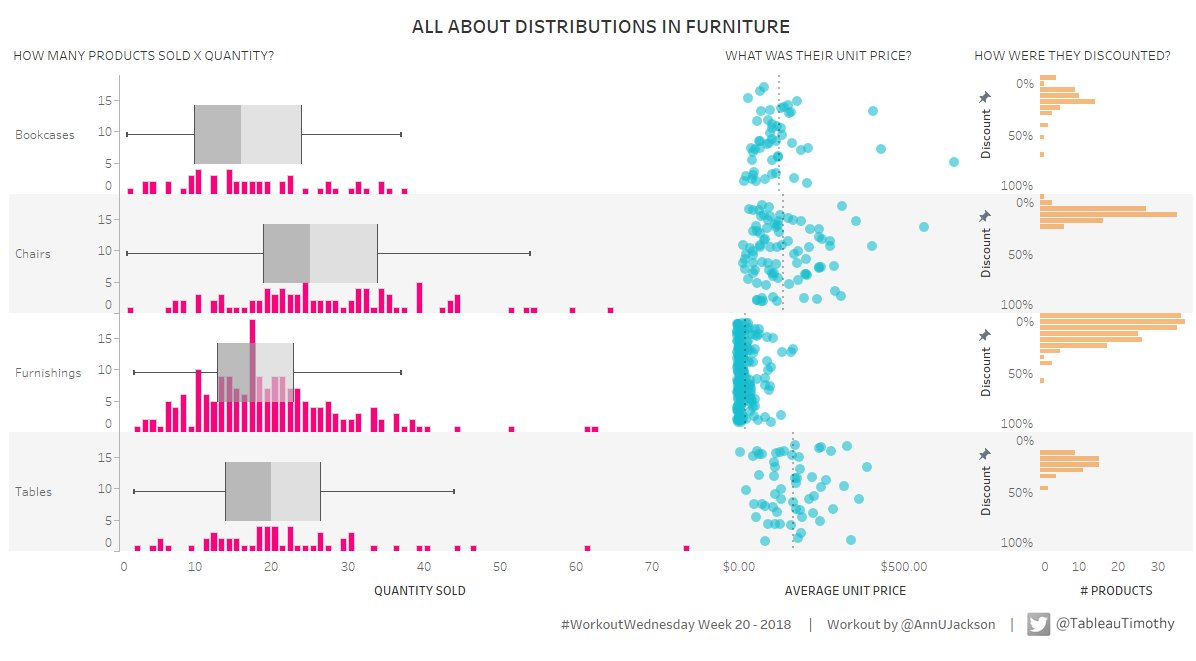
17 May 2018
Workout Wednesday Week 20 done! @olliehclarke and I worked together on it; we couldn't figure out the data densification for the discount chart, but got everything else! @AnnUJackson @lukestanke @RodyZakovich Viz: public.tableau.com/profile/t…
1
4
Timothy Manning retweeted

10 May 2018
Time is running out to get your initial application in for July's DSDU intake. Be sure to check out these successful applications for The Data School UK DS8 intake bit.ly/2Iu1kJL Notice how much improvement they made in such a short amount of time.
14
16
Timothy Manning retweeted

8 May 2018
NEW BLOG!
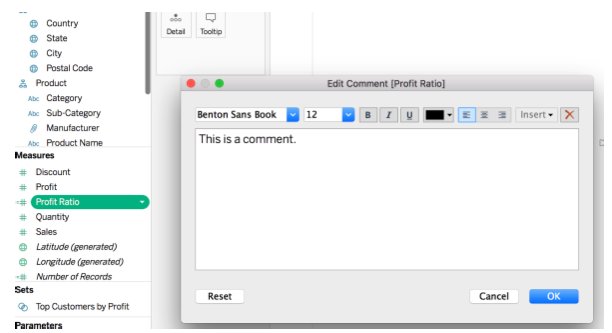
Extending a @dataschooluk blog I wrote, in this latest edition of the Consultant Diary, I share my favourite pro-tips when using calculated fields in @Tableau.
What’re yours? | theinformationlab.co.uk/2018…
2
12
26
26 Apr 2018
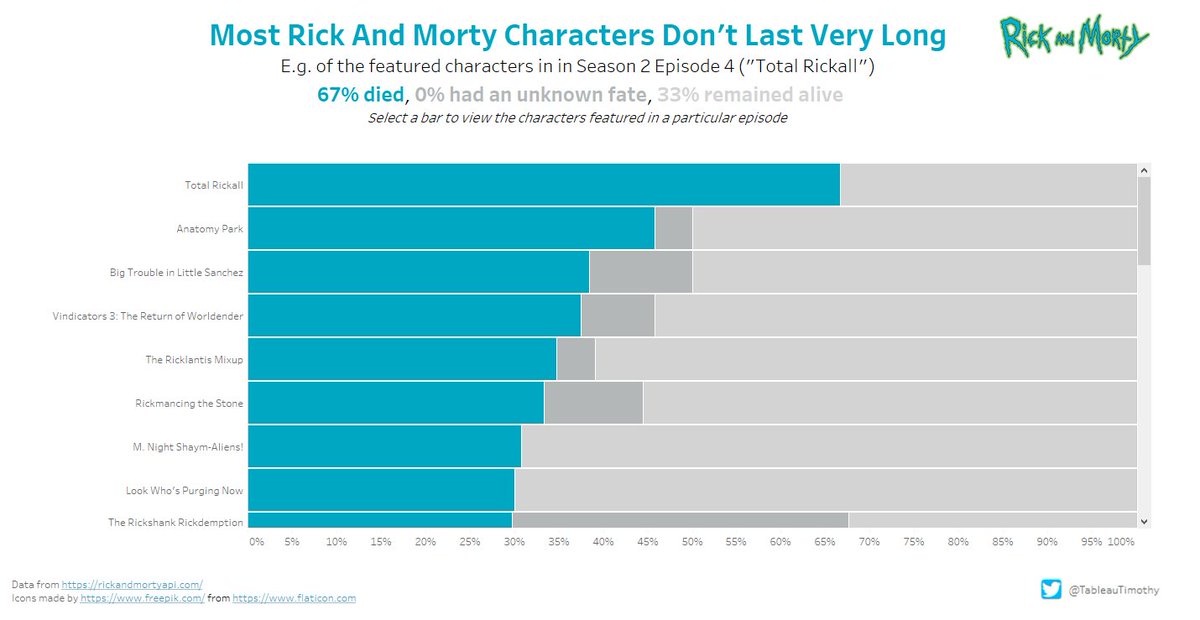
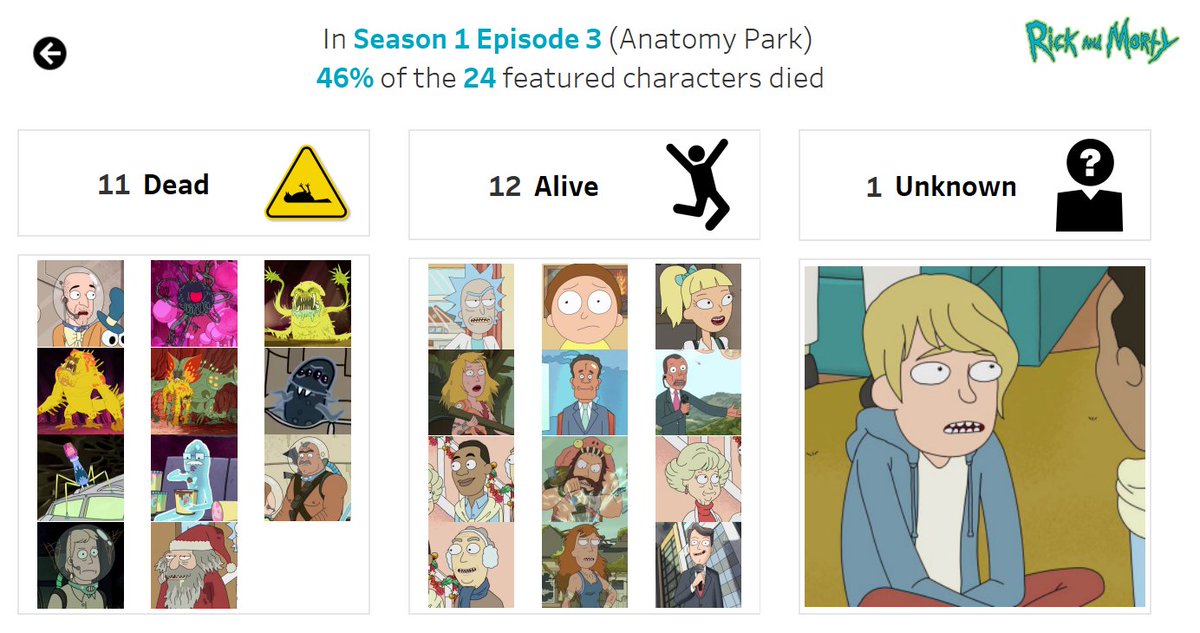
Here is my viz for Day 3 of the @dataschooluk's Dashboard Week! Exploring the proportion of characters in Rick and Morty who are alive or dead in any given episode. Viz here: public.tableau.com/profile/t…
Accompanying blog here: thedataschool.co.uk/timothy-…
1
4
24 Apr 2018
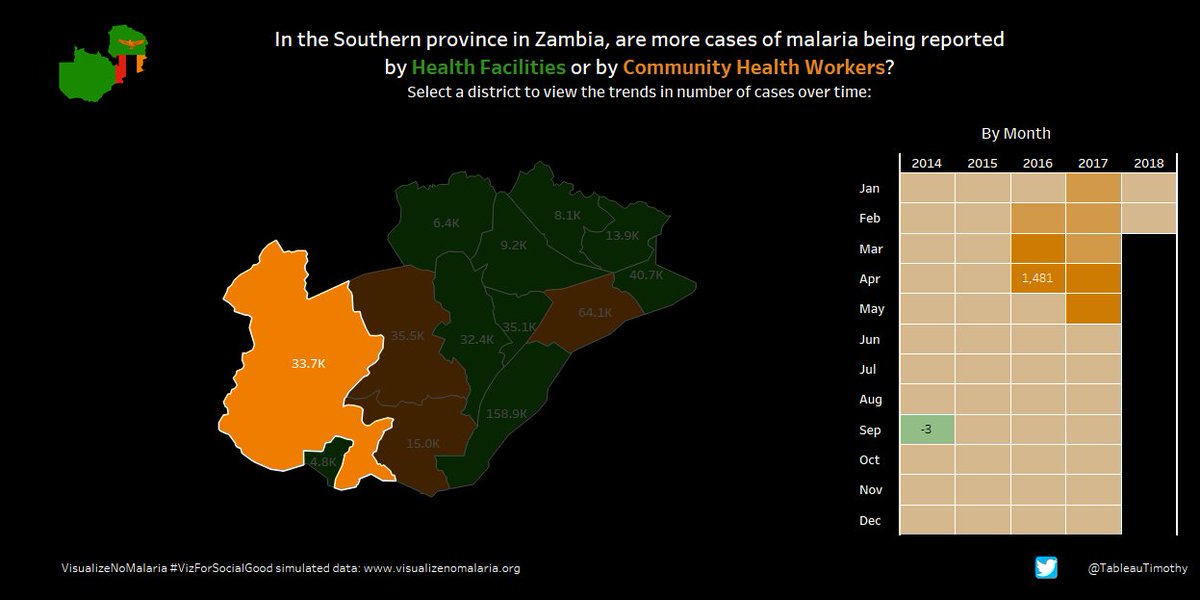
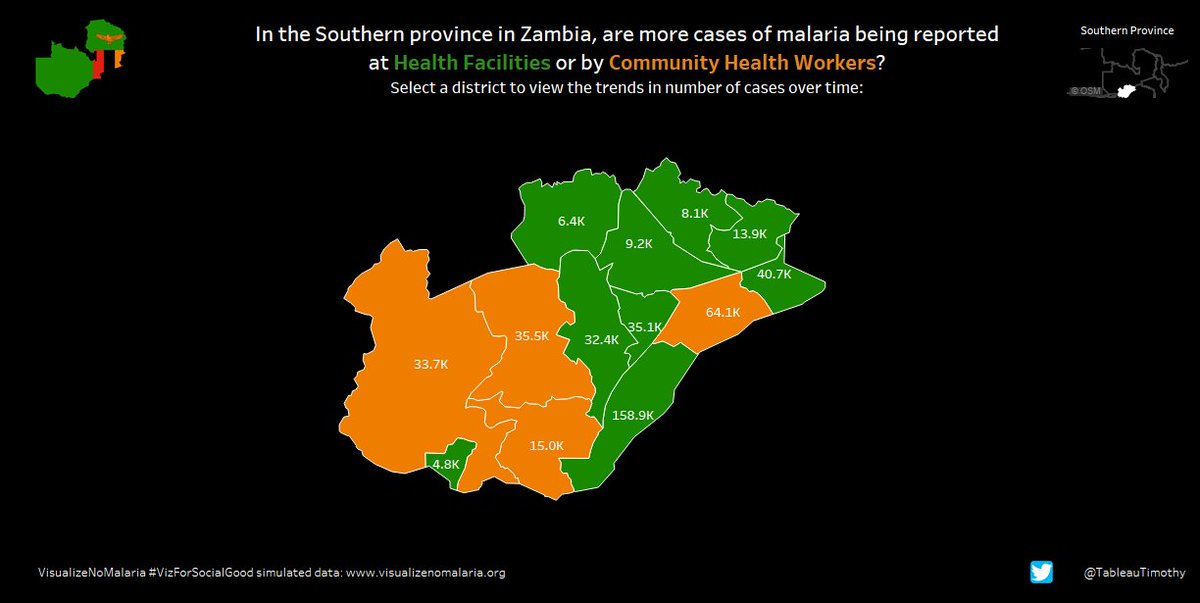
Really late, but here's the revision of Makeover Monday Week 15: VisualizeNoMalaria! I've changed the bar charts to a heat map showing the difference between reports by community health workers and health facilities in each district @VizWizBI @TriMyData public.tableau.com/profile/t…
1
8
24 Apr 2018
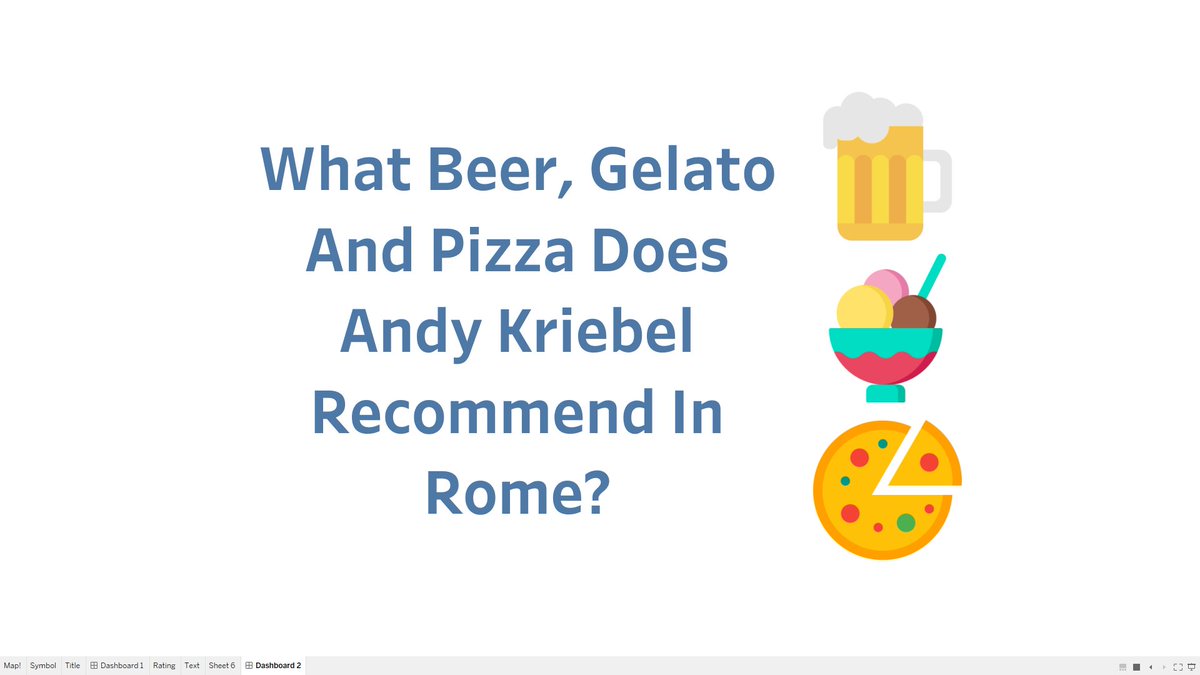
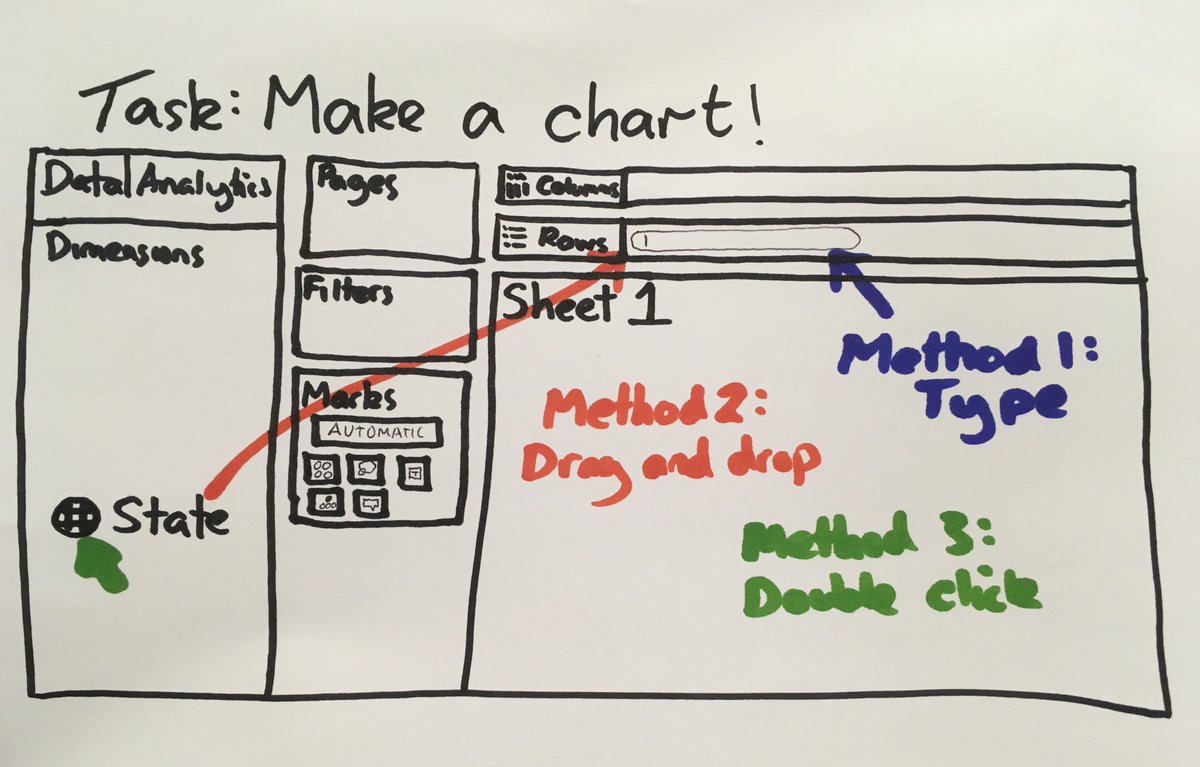
Dashboard Week - Day 1 - Andy's Antics In Rome! Here's a blog I wrote on how to split up your #tableau dashboard using lines, borders and padding. Enjoy! Thanks @VizWizBI for the data also. #DS8 #DashboardWeek thedataschool.co.uk/timothy-…
4
7