
460 Photos and videos

Taylor Marr retweeted

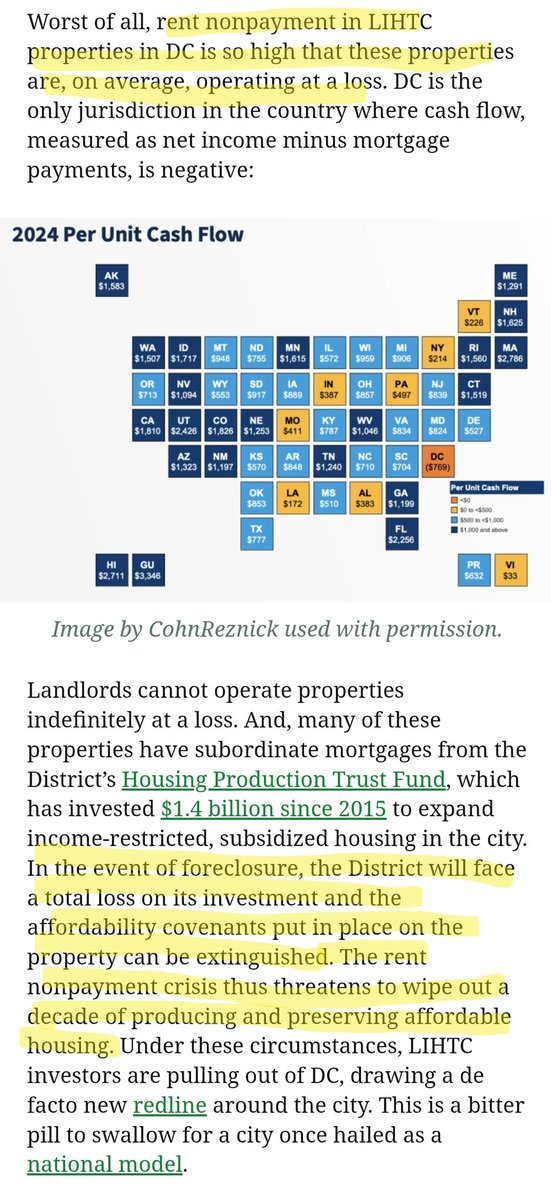
A man-made crisis in DC's "affordable housing" market, in 3 steps:
"the system that was put in place also...created enormous incentives for tenants to not pay rent"
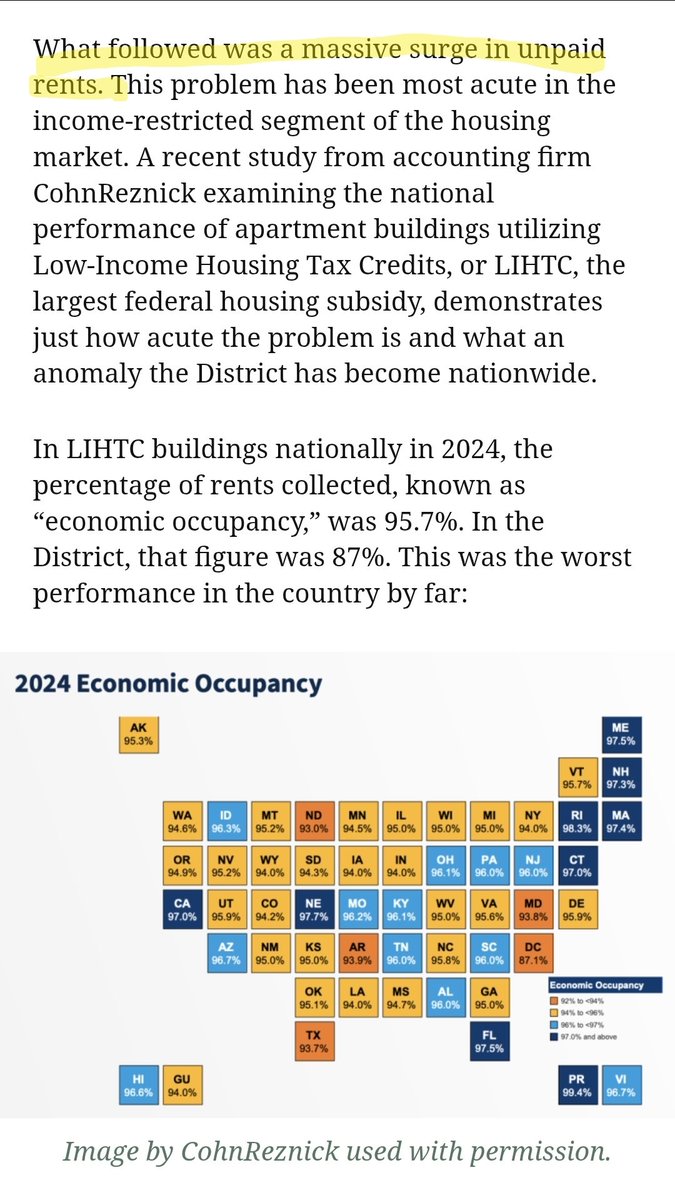
"What followed was a massive surge in unpaid rents"
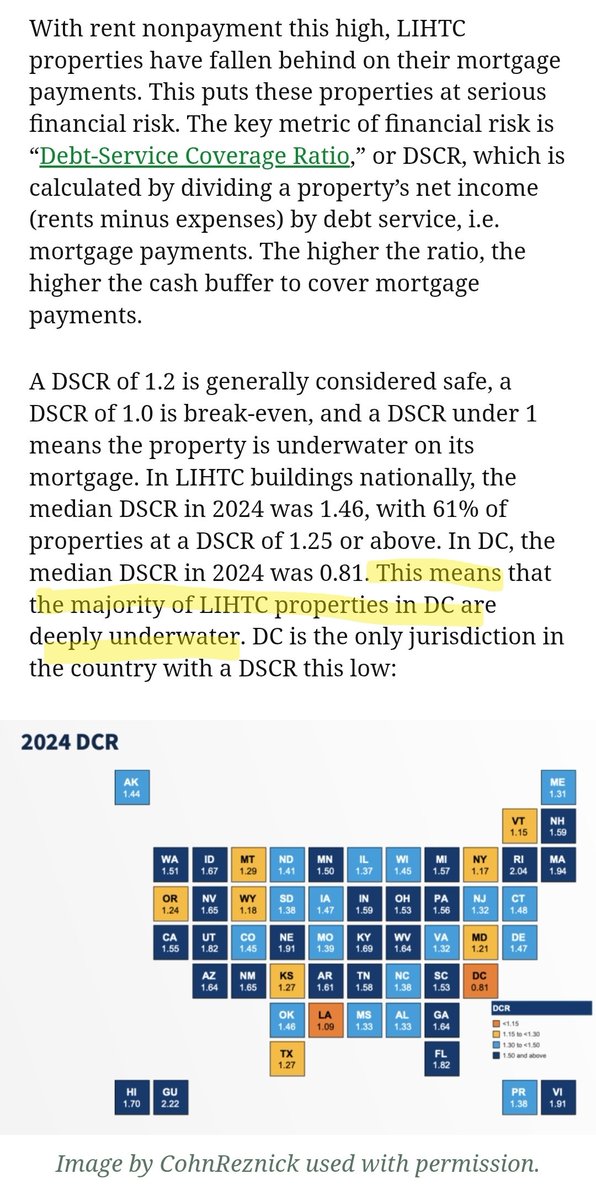
"rent nonpayment in LIHTC properties in DC is so high that these properties are, on average, operating at a loss"

5
23
122
8,703

Jun 5
Washington has hit on a promising idea for lowering housing costs: manufactured homes. The challenge is convincing Americans to accept them. bloomberg.com/news/articles/…
1
1,565
Taylor Marr retweeted

Jun 1
Housing units completed YTD 2026:
San Francisco: 377
Austin: 7,274
Guess which city has seen a rent *decrease* over the past 2 years...

May 31

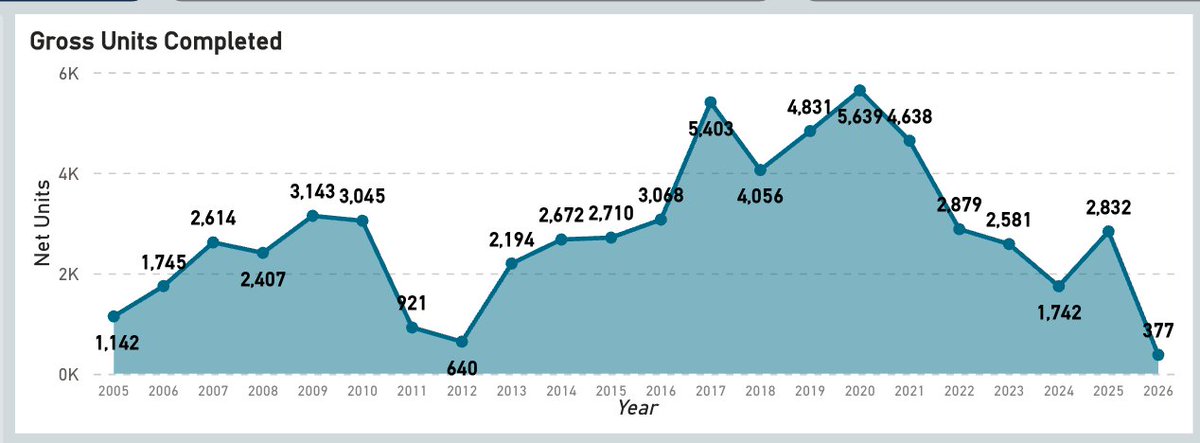
Housing units completed in San Francisco per year over the last 20 years
San Francisco has only completed 377 housing units so far this year
16
61
682
35,712
May 28
Airbnb.org expands its Medical Stays Program in Mexico with $20M MXN pesos news.airbnb.com/airbnb-org-e…
1
176
May 27
Higher prices for construction materials are worsening housing-affordability problems for more Americans wsj.com/finance/commodities-… via @WSJ
1
238
Taylor Marr retweeted

May 20
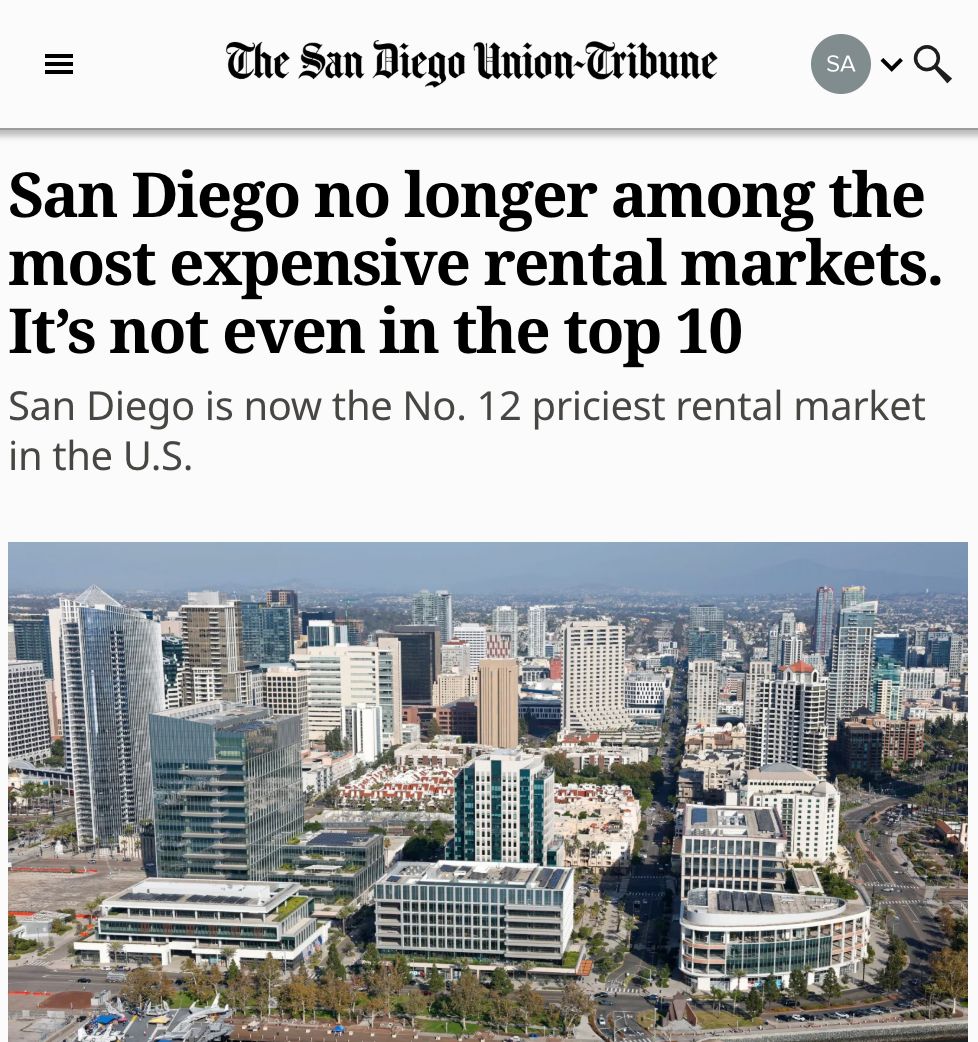
San Diego fell from 5th to 12th most expensive rental market by building more multifamily housing per capita than any other California city.
This is what happens when you actually build. The lesson isn't complicated.
130
756
5,890
257,337
Taylor Marr retweeted

The Economist: “We found that graduates in fields more exposed to AI have suffered markedly worse outcomes.”

134
1,023
4,143
816,191
May 15
New 2025 Census Bureau population estimates for cities and towns show population growth farther from city centers, but not for every city. census.gov/library/stories/2…
2
6,039
May 14
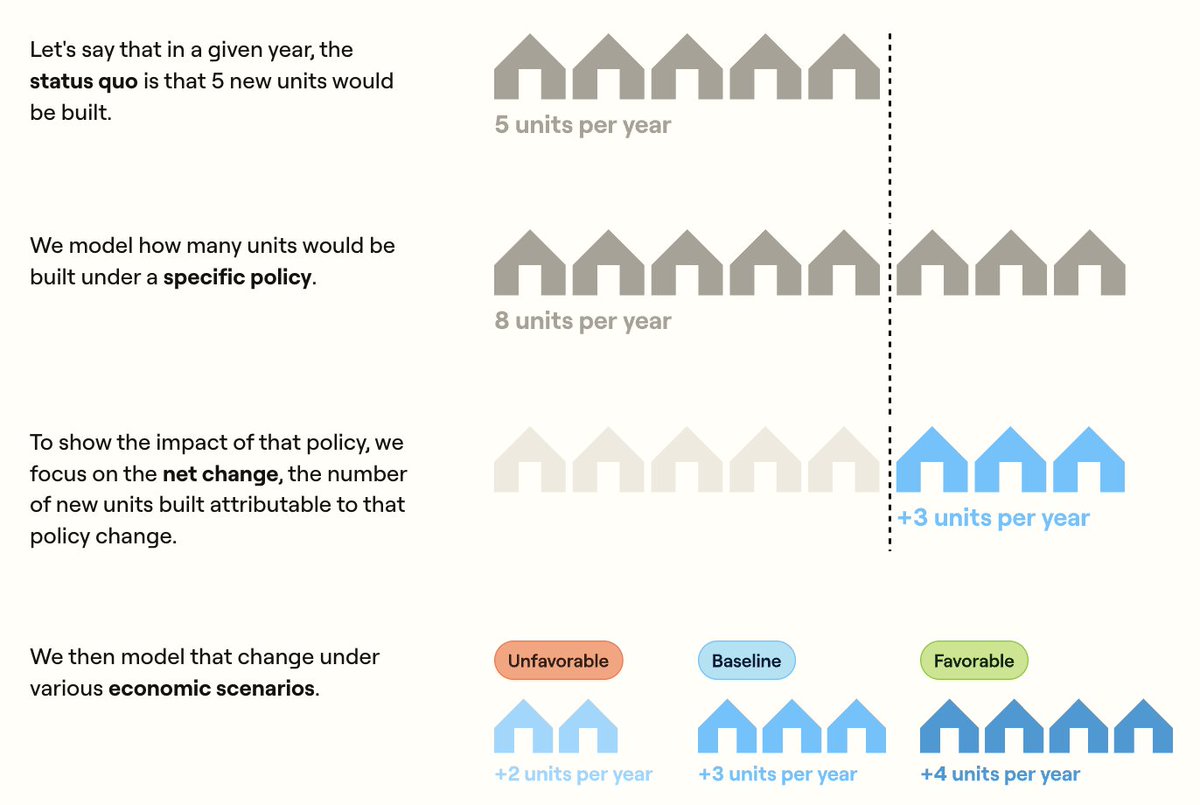
Excited to share this new tool from Terner Labs: the Housing Policy Simulator Visualization translates complex "development math" into accessible maps, allowing users to test how policy changes actually affect the financial feasibility of new housing. In a recent study, the University of Denver used the Simulator's models to show that eliminating parking minimums in Denver could increase the city's expected housing production by 13% annually.
Now you can explore the tool for yourself with an interactive which features data for Denver, San Diego, and Tucson: housing-policy-simulator-viz…
1
3
15
2,051
Taylor Marr retweeted

May 13
A new geospatial foundation model can now estimate how poor your neighbourhood is, track how fast that's changing, and do it without anyone filling out a single survey form.
A team of Stanford researchers just published Tempov, a foundation model trained on three million pairs of Landsat images spanning two decades. It takes raw satellite imagery and predicts asset wealth at the village level, across entire continents, updated in near real-time.
The benchmark numbers are worth sitting with. In Malawi and Mozambique, the model explains 87% and 74% of the variation in household wealth from satellite imagery alone. That's from six spectral bands. No census forms. No field enumerators. No mobile phone metadata.
The harder problem is tracking change, not just level. Most existing models are trained to predict a static snapshot. When you ask them to predict how wealth shifted between 2008 and 2018 in the same locations, performance collapses to near-random. Tempov holds at R² = 0.69 for Malawi and 0.46 for Mozambique on that same change-tracking task.
What makes the difference is how the model was pretrained. The researchers constructed bitemporal image pairs that maximise seasonal variance, then forced the model to learn representations that are stable across seasons but sensitive to genuine long-run economic shifts. The learned embeddings spontaneously delineate road networks, urban structure, and agricultural patterns from natural background, without ever being told to.
The scarcity problem is where it gets interesting for development economics. The standard tools for measuring poverty rely on the Demographic and Health Surveys. DHS data is spatially sparse and resurveyed infrequently. The correlation between asset wealth in Malawi's earlier and later censuses is only 0.42. In Mozambique it's actually negative: -0.71.
Tempov gets around this with a two-stage adaptation. Train on historical census data, then fine-tune to the target year using only 5% of contemporary survey points. With that 5% adjustment, it outperforms geospatial foundation models that were given 100% of available survey data. Combining a strong historical prior with minimal contemporary calibration can substitute for the full survey investment.
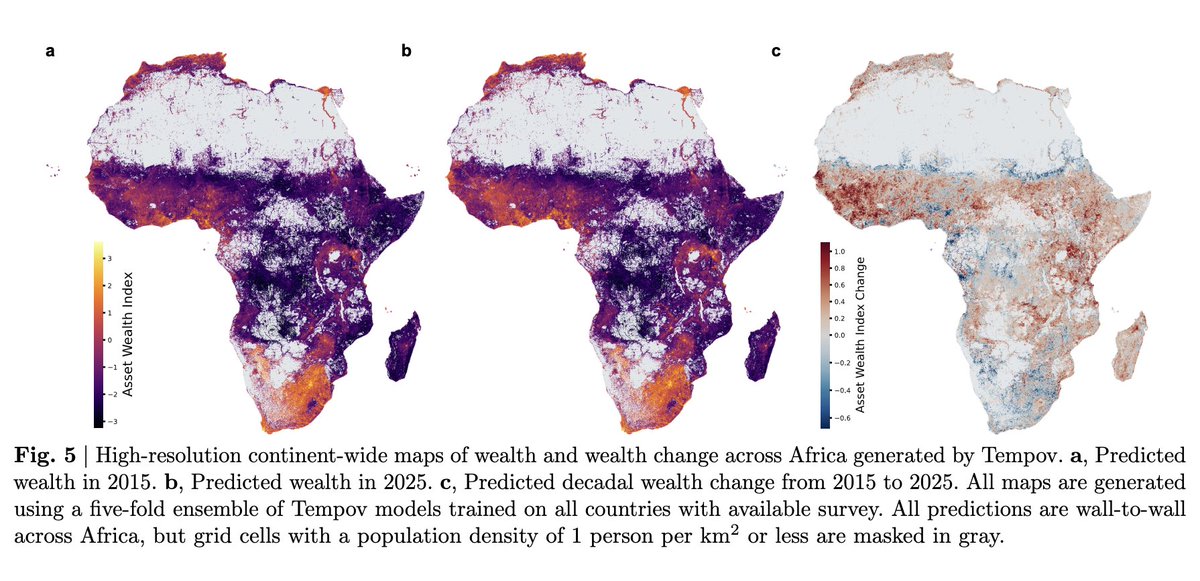
The researchers then deployed it continent-wide. Five models trained under cross-validation on all 34 African countries with recent DHS surveys, averaged into a single ensemble, producing 6 km × 6 km wealth maps for the entire African continent in 2015 and 2025. Roughly 80% of measured wealth inequality across the continent is within countries, not between them.
The decadal change map shows wealth gains concentrated in West and East Africa and substantial declines across parts of Southern and Central Africa. Country-level factors explain only about a third of the variation in wealth change. Local temperature trends and nearby conflict events predict the changes better than institutional-quality proxies do.
For the applied economics side: the model achieves competitive performance with 10% of available survey samples where baseline foundation models need 100%. That's not a modest efficiency gain. That's a different cost structure for poverty measurement entirely.
DHS survey rounds are already under funding pressure. The World Bank's Living Standards Measurement Surveys have become increasingly irregular. The status quo is a slow degradation in the quality and frequency of ground-truth data on living standards in the places that most need monitoring.
What Tempov suggests is that the role of household surveys may be shifting from the primary measurement instrument to the calibration anchor. You don't stop running surveys. You run fewer, target them better, and use them to tune a model that fills in the rest from orbit.
The code and weights are open-source. The continent-wide wealth maps are public. The methodology is reproducible by a national statistics office with a laptop and a moderate AWS bill.
The hard part was always getting data out of places that couldn't afford to collect it. That constraint just got significantly looser.
Link to paper: arxiv.org/pdf/2604.23166
2
44
170
8,991
Taylor Marr retweeted

Apr 15
New Freemark paper on big upzonings!
YIMBYs everywhere got mad when anti-transit NIMBYs abused Freemark's past work--he found that small upzonings have small effects--to fight housing near trains
Today Yonah asks: What do big upzonings in strong markets do? The answer is a lot

Apr 15

Just released paper from @urbaninstitute examining upzonings in New York and Philadelphia argues that upzonings can lead to a major increase in housing production, particularly in areas with strong demand urban.org/research/publicati…
6
19
117
13,399
Taylor Marr retweeted

The Redfin Data Center just got a makeover. If you are looking for free, downloadable data on national and local markets, this is for you! All we ask is that you cite Redfin. Enjoy!

3
16
115
111,379
Taylor Marr retweeted

Let's upzone NYC!
Now live:
potential.nyc/
See the zoning potential (air rights=blue) for every residential lot in NYC. And then ... change it.
13
37
413
90,303
Taylor Marr retweeted

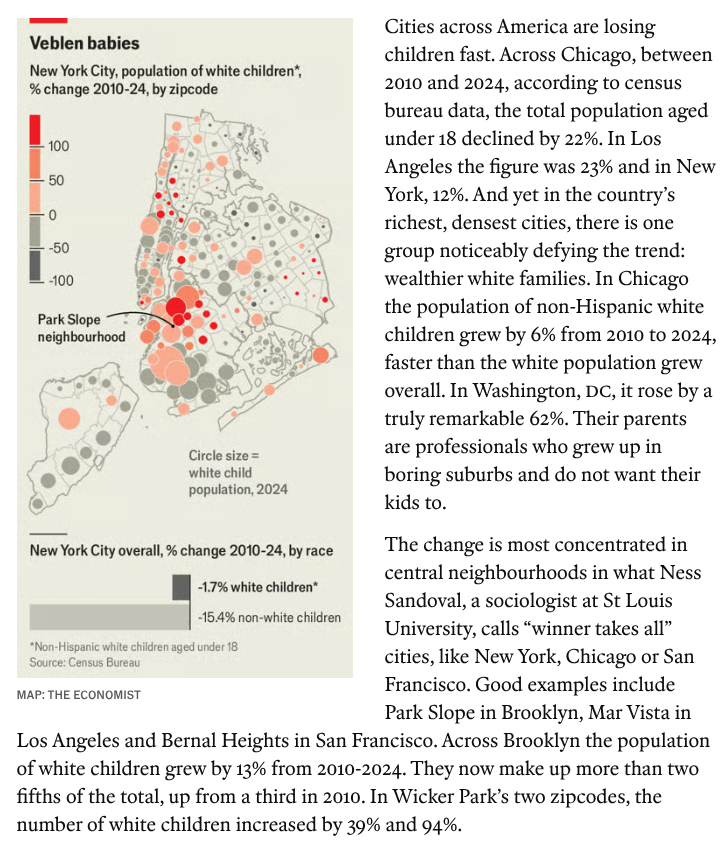
Veblen babies: "In Chicago the population of non-Hispanic white children grew by 6% from 2010 to 2024, faster than the white population grew overall. In Washington, DC, it rose by a truly remarkable 62%" economist.com/united-states/…
17
34
365
55,132
Apr 8
Airbnb launches Host Earnings Calculator for FIFA World Cup 2026™ news.airbnb.com/airbnb-launc…
2
694
Taylor Marr retweeted

Apr 3
A Terner Center study modeled duplexes, fourplexes, and tenplexes across four California markets.
Cutting fees from $40,000 to $10,000 and switching to residential building codes brought several more project types close to being built. But more reforms are also needed.
Link ⬇️

1
6
39
2,702
Taylor Marr retweeted
Apr 2
A 2020 Terner Center study found new owner-occupied homes are 50% larger than in the 1980s — despite shrinking household sizes.
The result: fewer entry-level homes, and first-time buyers who are increasingly older, wealthier, and whiter.
cayimby.org/blog/housing-is-…
5
17
1,032
Mar 30
Industrial Policy for Housing Construction | National Affairs nationalaffairs.com/publicat…
1
231