
Joined January 2023
- Tweets 1,006
- Following 5
- Followers 35,663
- Likes 383
552 Photos and videos


A new way to look at markets
Jun 10

"My rent might go up next year"
"I am worried about oil prices"
You have views about where the world is going, and worries about what's coming. By utilizing prediction markets, Thalamus turns them into real positions, in plain language. No tickers, spreads, or expiries.
We're doing a limited release today for 1,000 users. Each user gets $10 to spend, so you can try Thalamus immediately.
thalamus.xyz
1
7
1,842
Thanefield Research retweeted

May 14
If you build on TradingView, you're shipping what everyone else ships.
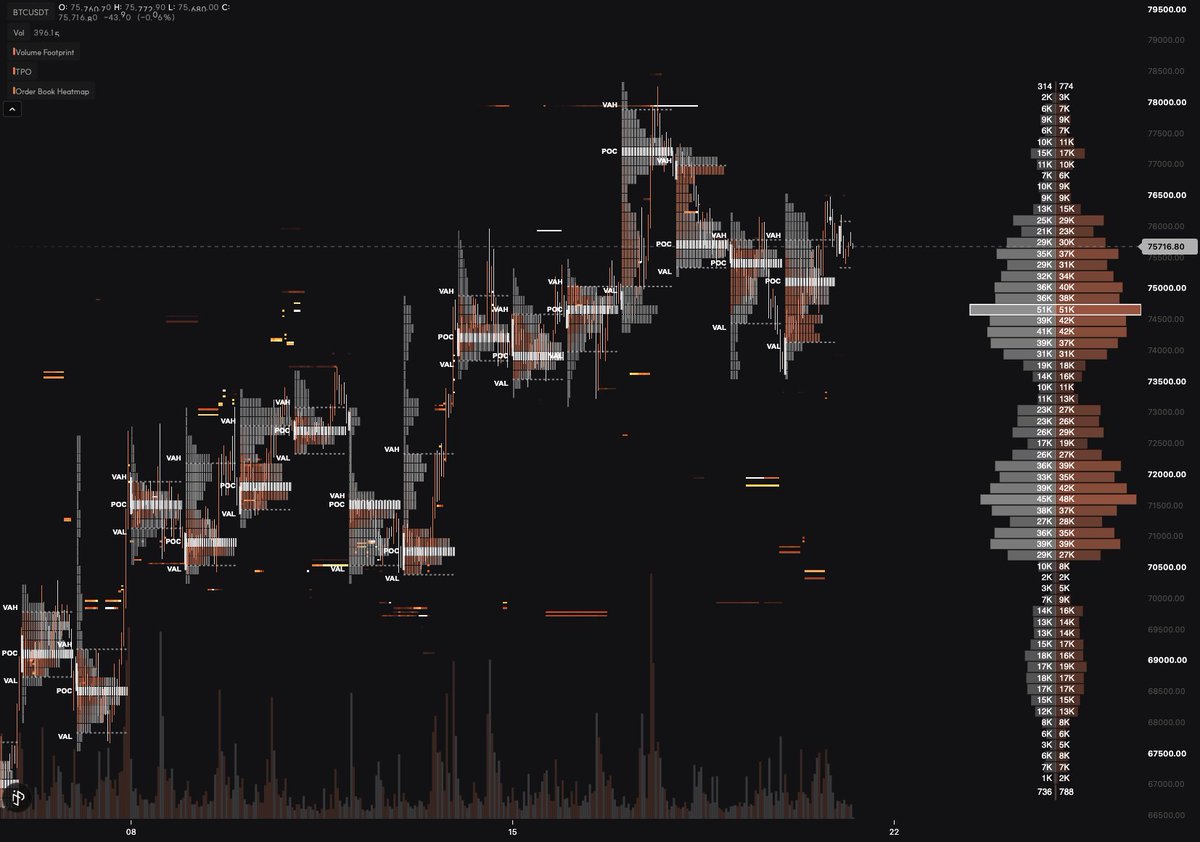
Percept gives you the chart plus the all the order flow primitives nobody else has. Tick-aggregated footprints, TPO, heatmaps.
Save hundreds of hours and build something nobody else can.

3
10
103
951,399
Thanefield Research retweeted

May 12
1
3
34
3,473
Reach out to @percept_labs if you're interested in an incredible frontend experience
May 12

>be crypto app
>plug in TradingView
>ship same OHLC candles as everyone else
>users still trade blind
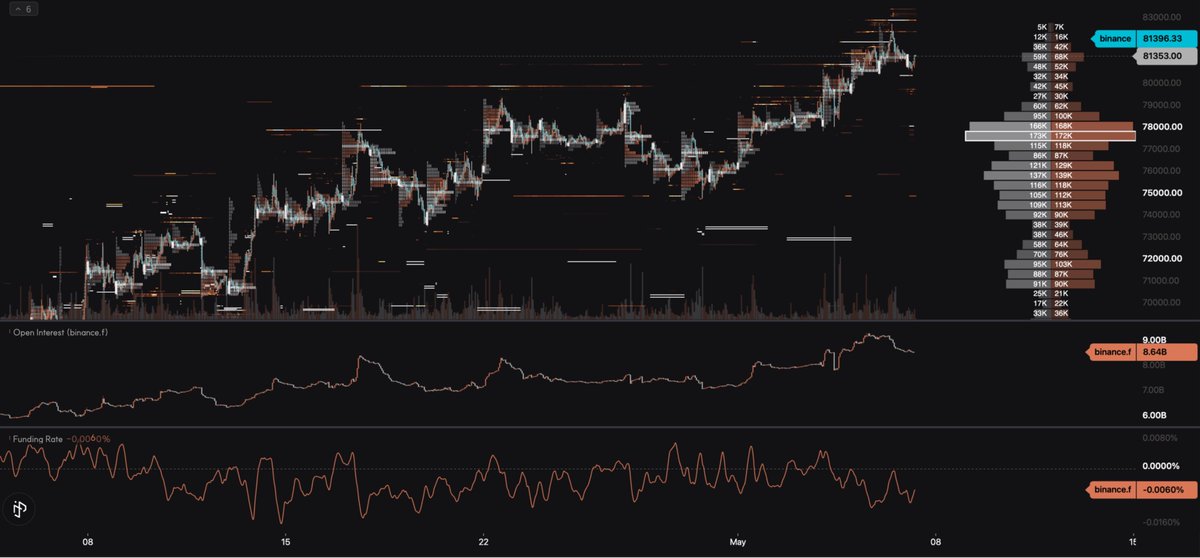
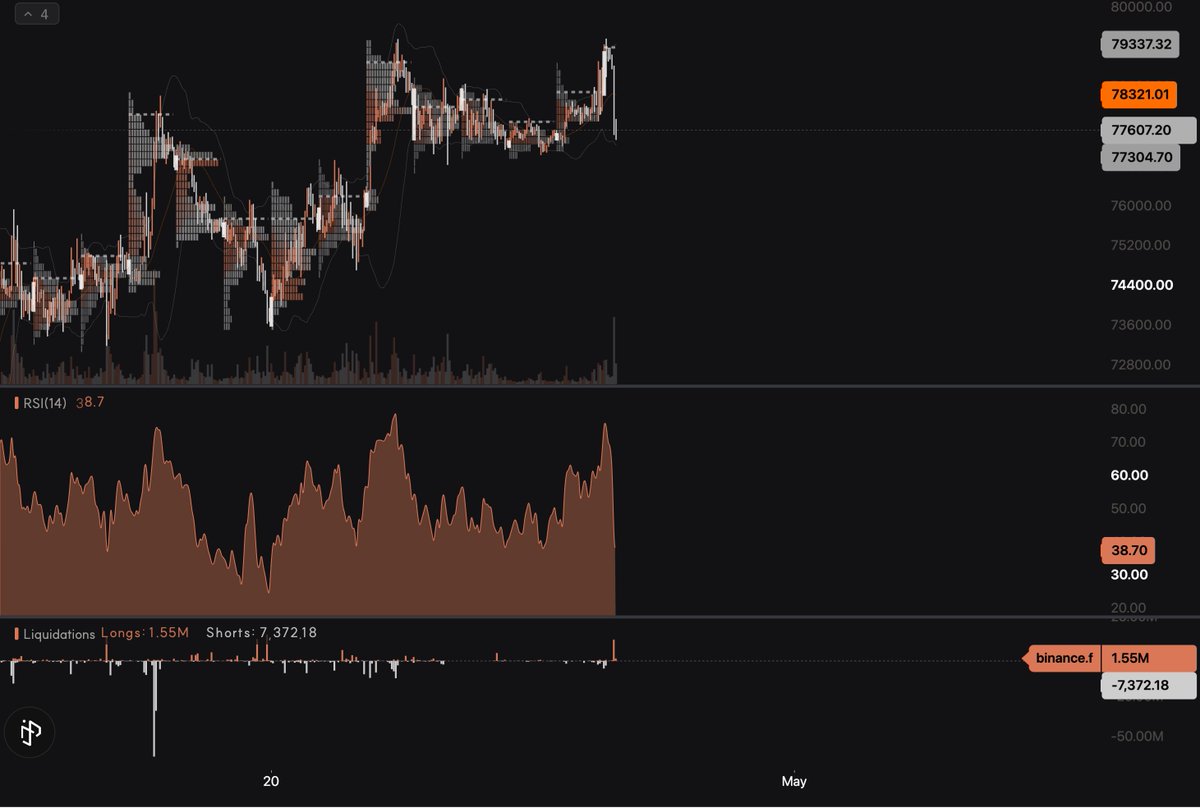
Percept charts ships the full context out of the box.
Funding, OI, liquidity heatmaps, liquidations all in real-time.
One integration. Every perp venue.
11
1,537
Thanefield Research retweeted
May 7
If your app needs financial charts, stop embedding TradingView.
TitanCharts gives you live data, history, symbol search, indicators, drawing tools, chart controls, and trading overlays out of the box.
Plug in and ship. DM us if you’re building.
3
6
80
8,134
Thanefield Research retweeted
May 5
3
9
99
8,326
Thanefield Research retweeted
Apr 27
POV: you’re building a trading interface and just need great charts.
The real cost of defaulting to TradingView:
• Your frontend looks like every other exchange
• Your competitors already have the same charts
• Every serious feature takes forever to ship because of TV's idiosyncratic quirks
• You still need to build and maintain the data layer
• WebSockets, gaps, backfills, historical data, live streams
• Order flow, footprints, TPO, heatmaps, OI, funding, liquidations all become separate projects
Or use TitanCharts and skip most of that work.
You get the charts, the customization layer, and the data streams already wired together: historical, live, order flow, footprints, TPO, heatmaps, OI, funding, liquidations, and more.
It still takes work to build a great trading product, but your team should be spending that time on the experience, not rebuilding charting infra.
If you're building a trading frontend, DM us.
8
3
64
8,797
Thanefield Research retweeted

Apr 23
I’ve been using this daily since we built it, and it has meaningfully cut down the time I spend scrolling while improving how informed I am. here's my setup: I track agentic AI pretty obsessively since it’s highly relevant to my workflow; new model drops, agent frameworks, inference tooling, anything that I might want to use. So I have the Attention feed pointed at that. in the last day alone it sent me stuff about chatgpt images 2.0, naval’s usvc, qwen’s new dense model, claude changes, all hit my Telegram before i even opened X.
I also browse a couple of VC’s sights. Andreessen’s sight is especially rich because he follows 30k accounts, so a huge range of themes and ideas flows through his attention every day. It gives me a quick understanding of what’s happening in their space. The sights are replicated as closely as possible to what they see e.g. we know Andreessen spends equal time on his X feed, Substack, podcasts and old books, so Attention tries to emulate that.
That’s been the sweet spot for me: less doomscrolling, still very early on the things I care about. the goal isn't more consumption, but the same context window with way less garbage in it. if you're building and trying to stay sharp without being online all day, worth 5 minutes to set up. The more specific you are, the better the signal. Then link your Telegram and let it run
Apr 23

Today we’re launching personalized feeds for everyone: a live, personal view into what the smartest builders are paying attention to right now, tuned to your interests.
Track emerging ideas before they hit the mainstream. Read it on your dedicated feed page or get it delivered straight to Telegram.
Log in, tell us what you care about, and our system handles the rest.

1
2
20
2,419
Thanefield Research retweeted

Apr 23
Today we’re launching personalized feeds for everyone: a live, personal view into what the smartest builders are paying attention to right now, tuned to your interests.
Track emerging ideas before they hit the mainstream. Read it on your dedicated feed page or get it delivered straight to Telegram.
Log in, tell us what you care about, and our system handles the rest.
5
3
17
4,260
Thanefield Research retweeted
Apr 21
Vibe code your own insider-detection dashboard, whale tracker, copy-trading system, or market forensics engine on top of Polymarket. Or build something nobody's thought of yet.
We just shipped the most powerful Polymarket analytics API in existence.
Per-wallet PnL, unrealized positions, win rates, hold durations, category breakdowns, and filterable leaderboards.
Every combination of filters is a different product. Here's what you can build with one API call: 👇
2
12
242
16,228
Reach out to the @percept_labs team if you're a builder!
Apr 21
TradingView makes you spend hundreds of hours fighting legacy integration debt.
Percept is a charting library for trading frontends that works out of the box, with 13 chart types, advanced tooling, and native data access included.
If you are building on charts, reach out to us.
9
1,795
Thanefield Research retweeted
Apr 16
One API across crypto, prediction markets, and order flow.
Now open and free.
Monitor odds, funding, toxic flow, and order book pressure from one place.

5
17
176
9,835
Thanefield Research retweeted
Apr 13
Kiyotaka API is live.
It is the most complete data API for crypto and prediction markets, with first-class support for Hyperliquid and Polymarket builders.
It is designed for builders working on trading infrastructure, analytics, research, monitoring, and execution systems that need a deeper view of the market than standard price feeds can offer.
You can pull candles, funding rates, open interest, liquidations, volume profiles, order book heatmaps, liquidation heatmaps, market profiles, and cross-exchange aggregation through a single API.
The goal is simple: less time stitching together fragmented data sources, and more time building.
17
22
207
17,650
Attention: see what the best minds see
2
4
2,215
Thanefield Research retweeted
Mar 12
Whether you are a builder, exchange or solo dev, if you want to try out world-class charting that beats TradingView and takes 30 seconds to set up, reach out to the guys at @percept_labs
4
3
64
8,279
Thanefield Research retweeted
Mar 5
Proud to power the charting and market data infrastructure behind @tread_fi.
Too many teams building trading products spend months reinventing charting libraries, indicators, and data pipelines. That’s time that should be spent building what actually differentiates your platform.
Percept exists so teams can skip that entire layer.
Enterprise-grade charts, indicators, and market data integrated in minutes so you can focus entirely on your core product.
If you're building a trading product and want to get set up in minutes, reach out.

Percept (@percept_labs) x tread.fi (@tread_fi)
We are excited to announce our partnership with Percept! As we move towards improving the overall terminal experience on app.tread.fi, we will be migrating all charts to Percept.
Users can expect unparalleled advanced indicators and a smooth, native integration that comes from a close partnership with the Percept team.
Highlights of some features 🧵

23
2
38
3,436
Thanefield Research retweeted

When we invested in @davidyjeong and @tread_fi, the thesis was simple: a founder with rare technical depth, relentless execution, and a genuine insight into where algorithmic trading was heading.
That thesis is playing out. They're now consistently one of the top builders on Hyperliquid, generating volume and fees that most platforms in this space never reach.
We believe they're still in the earliest innings of what they're building.
If you're on Hyperliquid, you should be using TreadFi.
Mar 2

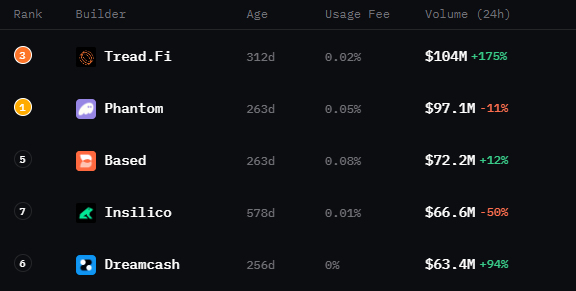
it happened
@tread_fi is #1 in 24h volume on Hyperliquid builders
leaving behind @phantom, @BasedOneX, @InsilicoTrading, and @Dreamcash
would love to see it holding #1 every time I open the rankings
best way to automate your trading with MM and DN bots, not just on Hyperliquid, but on a huge list of integrated DEXes
Season 1 ends in May
7
9
56
16,023
Thanefield Research retweeted
Jan 21
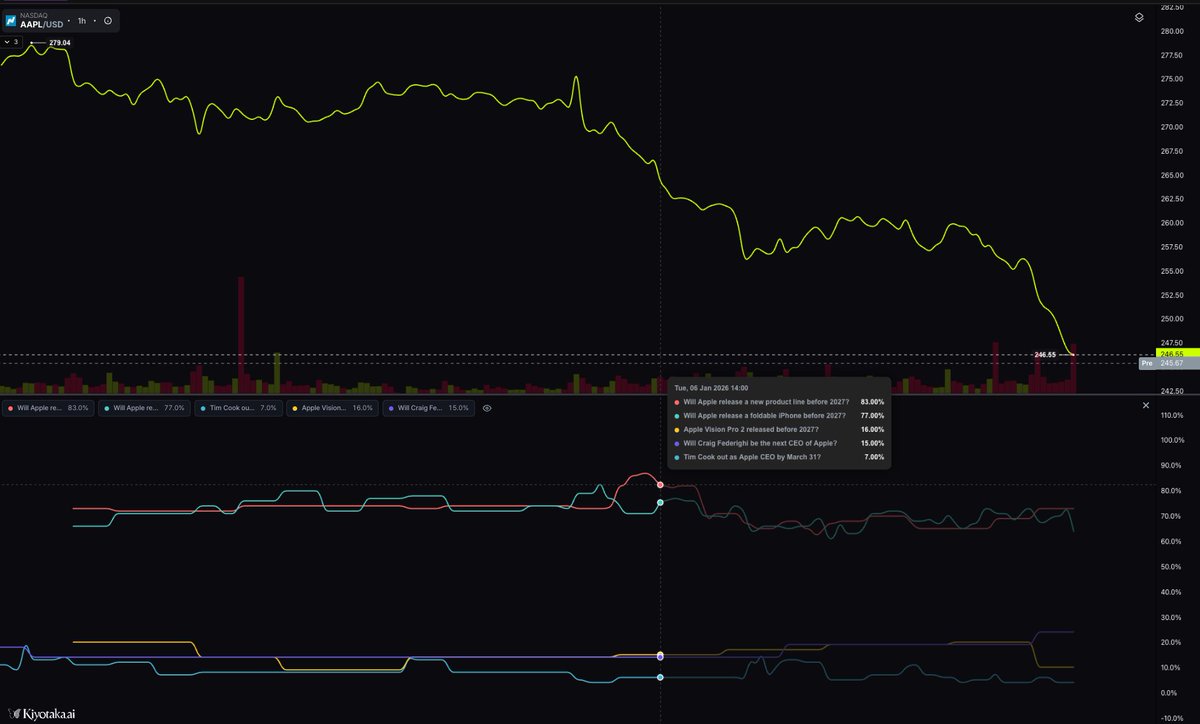
Price charts show what moved. They rarely show why.
Today we’re launching Impact Events, a new way to view prices through the events that actually drive them, each tracked with live probability odds.
• Apple → foldable iPhone launches, Vision Pro follow-ups, CEO succession risk
• Bitcoin → nation-state adoption, corporate treasury adoption, protocol-level changes
This is powerful because markets don’t move on candles. They move on changing expectations. We map the most important event probabilities directly onto assets, giving price action real context.
6
10
124
13,014
Thanefield Research retweeted
Jan 9
Introducing Timeline, a new way to see the why behind price movements, not just the how.
Timeline overlays the most relevant market-moving headlines directly on your charts, so price action always comes with context.
Below, you’re looking at Trump’s Fed Chair pick odds, with each reprice mapped to the specific headlines that drove it.
This helps you clearly see when narratives shift and how the market responds.

195
57
355
73,256