
Senior lawyer at the Foundation for International Law for the Environment (FILE). Tweets largely my own opinions. Retweets probably somebody else’s.
Joined November 2010
- Tweets 1,146
- Following 718
- Followers 410
- Likes 2,224
33 Photos and videos


Sam Bright retweeted

2 Oct 2023
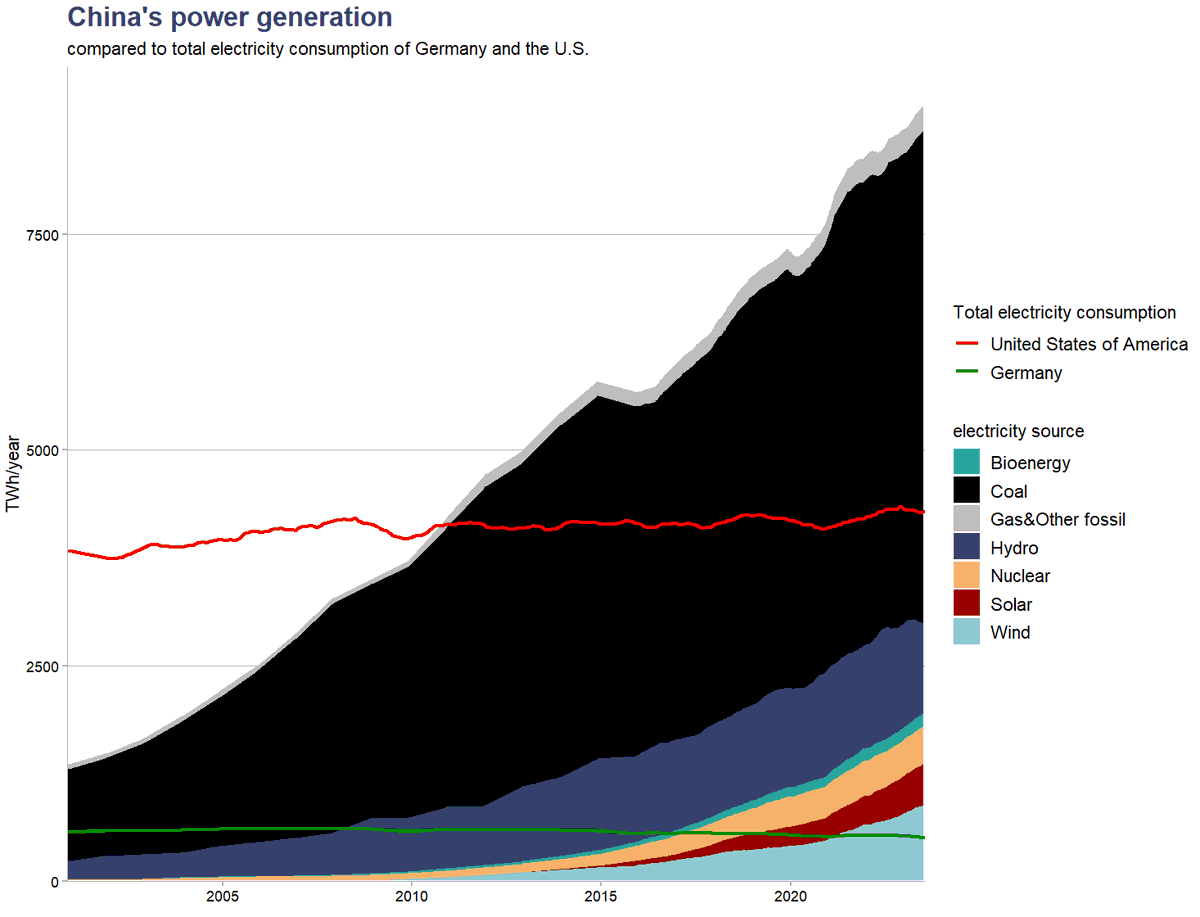
It's become a bit of a cliche to call it a paradox or a contradiction that China is building staggering amounts of both new clean power generation and new coal power plants.
It only is one if you fail to grasp the scale of China's electricity consumption growth, as most people inevitably do.
China today generates enough power from clean sources to power Germany SIX times over, up from two times a decade ago. In a few years, China's clean power generation will be equal to U.S.' total electricity consumption. China's power generation from wind&solar alone is about to hit three times Germany's total electricity consumption next year.
If China's power demand had stayed on 2009 level, the massive increase in CO2-free power generation would have made the grid 80% clean, instead of the current 33%. CO2 emissions from the power sector would have fallen by 75%.
What happened instead is that electricity demand doubled and clean power generation didn't keep up, while it did manage to increase its share from 20% to 33%. Predictably, the difference was delivered from coal, and CO2 emissions went up by 90%.
China now uses twice as much power as the U.S., after overtaking the country only in 2010. Put another way, China's additional power demand since 2010 is equal to the total consumption of the U.S.
60% of that electricity demand growth went to industry, mainly basic manufacturing like steel and other metals, cement, glass and chemicals, so it's really a function of China's extremely investment- and construction intensive growth model.
And no, it's not just about the size of China's population: per capita electricity consumption in China overtook Germany in 2022.
The good news is that China's clean energy growth is finally reaching the scale where it can cover all of the growth in power demand. This is happening even as power demand growth likely slows down with the economic slowdown.
These trends have been masked in the past year by the collapse in hydropower generation which is readily visible in the graph, but will likely become apparent in the year or two.
Most of the data for the post and the graph is from the amazing datasets of @EmberClimate.
106
926
3,459
829,981
Sam Bright retweeted

5 Feb 2023
The entire industry is built on colonialism and injustice.
For a safe and fair world, we need climate justice and to fast-track a just transition to clean, renewable energy that will create jobs across Africa.
Add your voice 👉 act.gp/3Y6xFKf
201
443
1,421
61,875
Sam Bright retweeted

CCSI and @SabinCenter are hiring for the position of Senior Legal Researcher, Climate Law & Finance... come join our team! #Hiring
➡️Apply here: tinyurl.com/yckbf67n

9
18
2,718
Sam Bright retweeted

25 Nov 2022
🎉#BREAKING: @YouthVerdict and @BimbleboxNR just won their historic legal challenge to Clive Palmer's proposed Galilee Coal Project on environmental, climate and human rights grounds!

14
130
284
Sam Bright retweeted

29 Sep 2022
The world's coal mines knowingly release the same amount of #methane EVERY 2.5 DAYS
#CoalMineMethane
bloomberg.com/news/articles/…
2
44
82
Sam Bright retweeted

31 Aug 2022
Interesting these are ALL supply-side.
What about the demand-side?
4
4
23
Sam Bright retweeted

15 Aug 2022
This is unbelievable! New study claims it has found a 23-66% methane loss rate over shallow water gas wells!
With 3-6% gas becomes worse than coal. So imagine how bad 23-66% is!
Reason we find this now is apparently that we finally have remote sensing that works over water.
11 Aug 2022

New study suggests offshore #oilandgas production in the Gulf of Mexico has ⬆️#methane loss rates than typical onshore production.
New remote sensing method that can detect methane over water makes the #climate impact of these platforms visible. bit.ly/3zQCufI
12
197
522
Sam Bright retweeted

18 Jul 2022
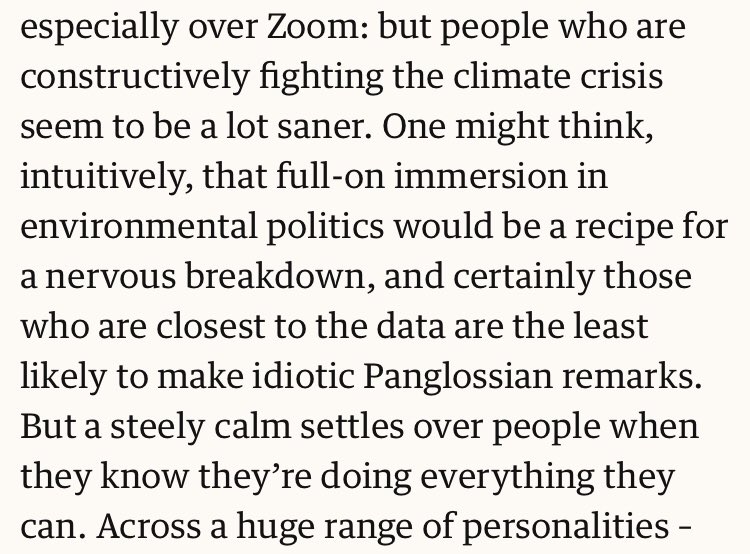
This is a lovely sentiment from @zoesqwilliams that I suspect contains more than a grain of truth. theguardian.com/commentisfre…
1
4
32
Sam Bright retweeted

18 Jul 2022
BREAKING: We won our case against the UK gov's inadequate net zero strategy!
On the hottest day on record in the UK, the High Court has ruled that the government’s Net Zero Strategy breaches the Climate Change Act.
This is a landmark victory.
171
2,634
11,021
Sam Bright retweeted

18 Jul 2022
Here's the half-page cartoon on the comment pages of today's Times...

38
1,788
5,409
Sam Bright retweeted

BREAKING: Our new research tracked the flows of EUR63 billion worth of fossil fuels from Russia in the first two months of the brutal invasion of Ukraine, revealing the largest importers. It’s time to stop supporting Putin’s war crimes. 🧵
44
610
1,154
Sam Bright retweeted

27 Apr 2022
Damming graph from @JenWilliamsMEN article on what's happened to Britain's buses
ft.com/content/cce1749f-c50f…

5
42
96
Sam Bright retweeted

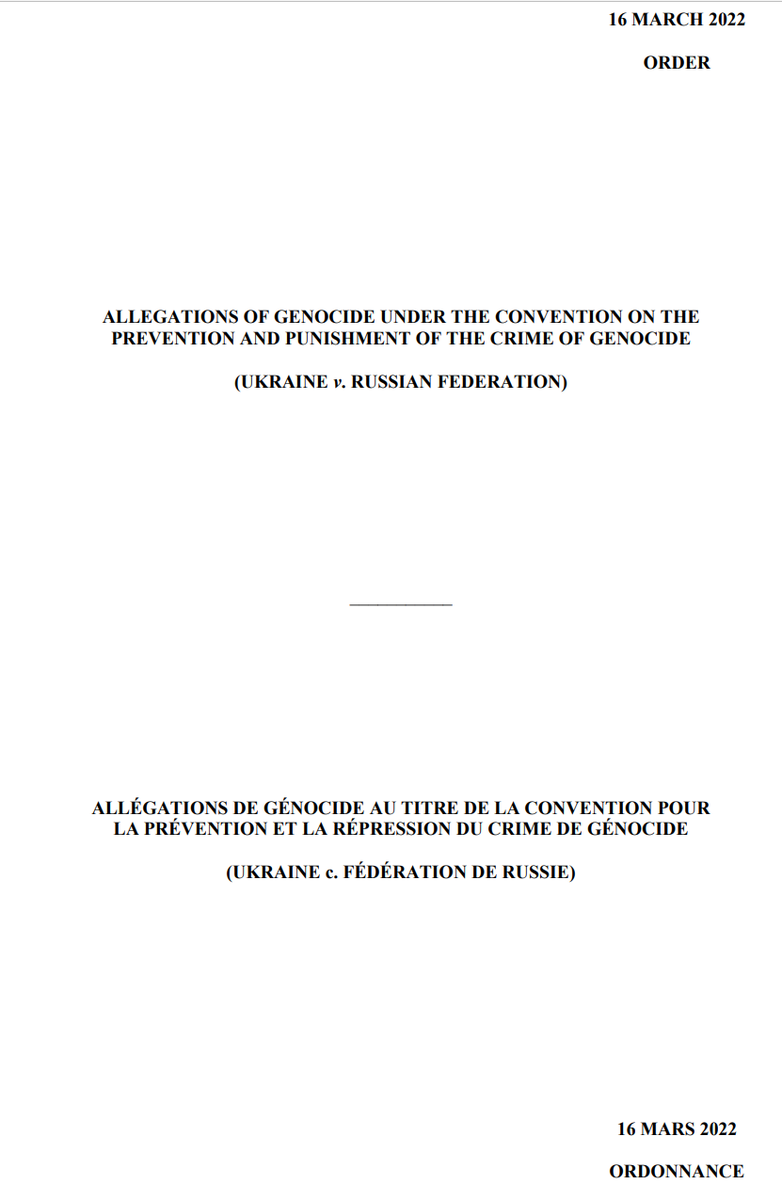
Ukraine gained a complete victory in its case against Russia at the International Court of Justice. The ICJ ordered to immediately stop the invasion. The order is binding under international law. Russia must comply immediately. Ignoring the order will isolate Russia even further
3,760
28,689
157,724

Sam Bright retweeted
15 Mar 2022
We've started legal action against Shell’s Board, seeking to hold it liable for mismanaging the climate risk facing the company. Find out how this ground-breaking case works:. bit.ly/3L2129R
7
65
181
Sam Bright retweeted

11 Mar 2022
Sobering real-time ticker showing the huge sums EU countries have spent on Russian fossil fuels, since Russia invaded Ukraine on 24 February
So far it's €9.1bn (and counting)
Analysis by @CREACleanAir
beyond-coal.eu/russian-fossi…
110
1,352
1,988
Sam Bright retweeted

8 Mar 2022
Shell issues an apology. It says its decision to purchase a cargo of Urals crude 5 days ago "was not the right one and we are sorry."
Shell also announces it stops buying spot Russian oil and over weeks will cut long-term contracts, which could lead to refinery runs cuts | #OOTT

Shell announces intent to withdraw from all Russian oil & gas, aligned with new government guidance.
As an immediate first step, we will stop all spot purchases of Russian crude oil, shut service stations, aviation fuels & lubricants operations in Russia.
16
86
275
Sam Bright retweeted
5 Mar 2022
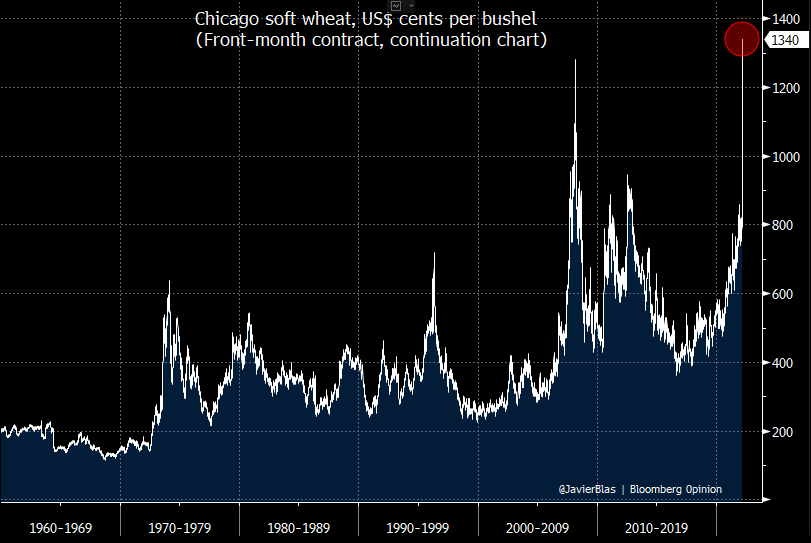
Wheat should be a **massive concern** to policymakers because its outsized impact on food security. EU/US spot wheat prices have now surged to a record high (measured on a front-month contract basis, continuation chart) #OATT #Ukraine #wheat🇺🇦 plus 🇷🇺 are ~30% of global🌾exports
24 Feb 2022

For now, the biggest physical disruption to Russian / Ukrainian commodities flow **appears** to be on grains (wheat would be most affected). Shipping restrictions imposed around grain export ports. For now, oil and gas pipelines are flowing normally. Emphasis on for now.
18
260
492
Sam Bright retweeted
3 Mar 2022
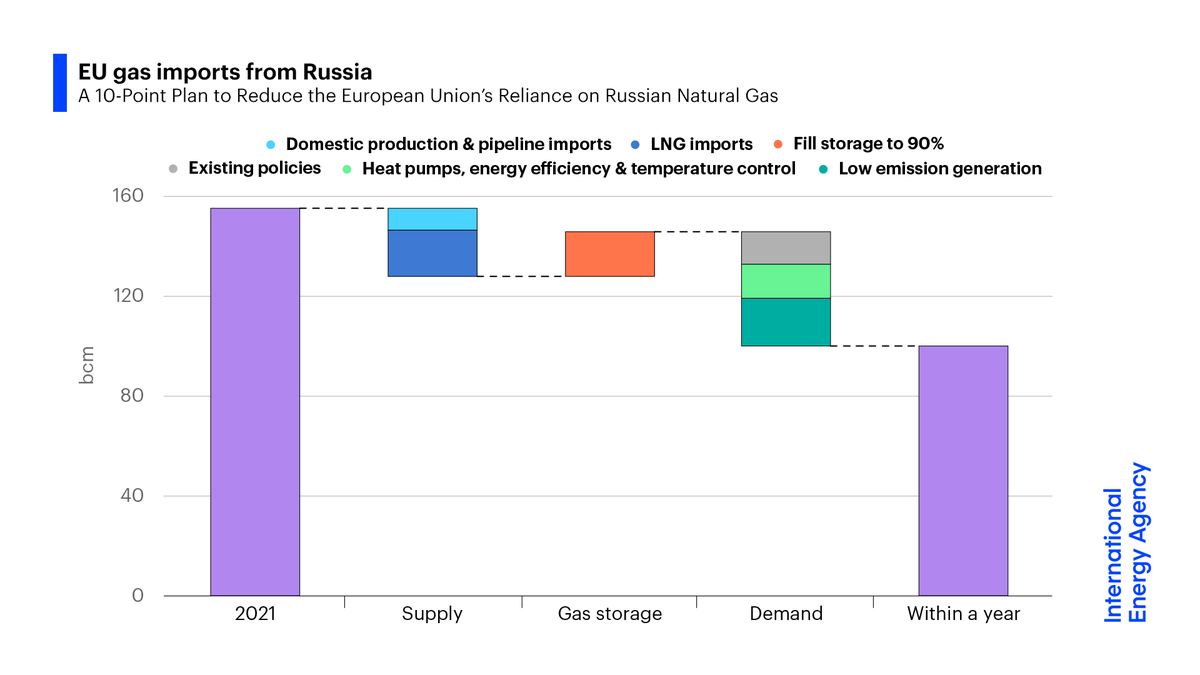
IEA top 10:
1. No new 🇷🇺gas contracts
2. Replace 🇷🇺gas w/other gas
3. Min gas storage
4. Accelerate wind solar
5. Max bioenergy nuclear
6. Shelter vulnerable consumers
7. Gas boilers > heat pumps
8. Efficiency in buildings industry
9. Thermostat adjustment
10. Decarbonise power
3 Mar 2022

The EU needs to act quickly to reduce its reliance on Russian natural gas
@IEA’s 10-Point Plan shows how the EU can cut gas imports from Russia by over a third in a year while supporting the transition to clean energy in a secure & affordable way
More ➡️ iea.li/3HDUHPu
3
29
49
Sam Bright retweeted

1 Mar 2022
“Britain has strong laws and weak enforcement. The US has laws which in many respects are less strong but much stronger enforcement.” - revealing column from @catrutterpooley on the limits of new UK efforts to clamp down on 'Londongrad': ft.com/content/79b8bcbe-95cd…
6
80
189