
You don’t have an information problem. You have a decision problem. t.me/TradeSentinelApp | AI: member.tradesentinel.app | Free Trial
Joined January 2026
- Tweets 337
- Following 99
- Followers 36
- Likes 102
131 Photos and videos

Pinned Tweet

May 25
🔗 Landing Page tradesentinel.app
🧠 TradeSentinel Platform member.tradesentinel.app
• Free 14-day trial
• Full AI analysis capabilities
• Access to proprietary chart framework
• @tradingview indicators unlocked with paid subscription (or request during trial)
📲 Telegram Community t.me/TradeSentinelApp
• Shared charts & market setups
• Framework discussions
• Feedback & feature input
📈 TradingView Profile
tradingview.com/u/TradeSenti…
136
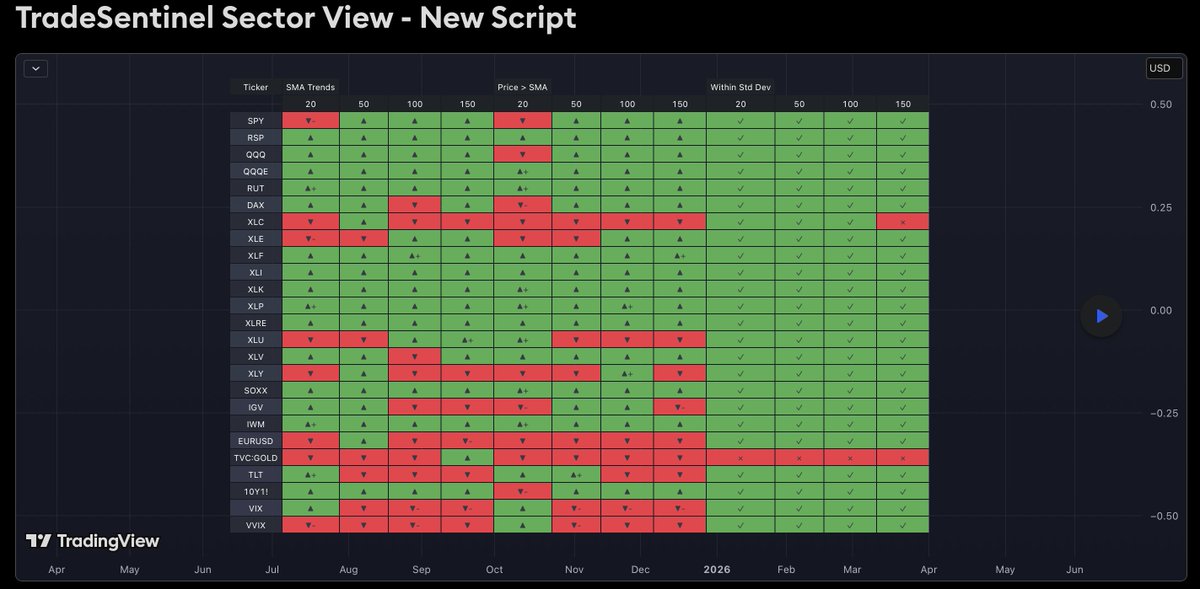
TradeSentinel Market Snapshot: Selective Bull with Broadening Signs
(~1 min read)
1️⃣ What is observed today?
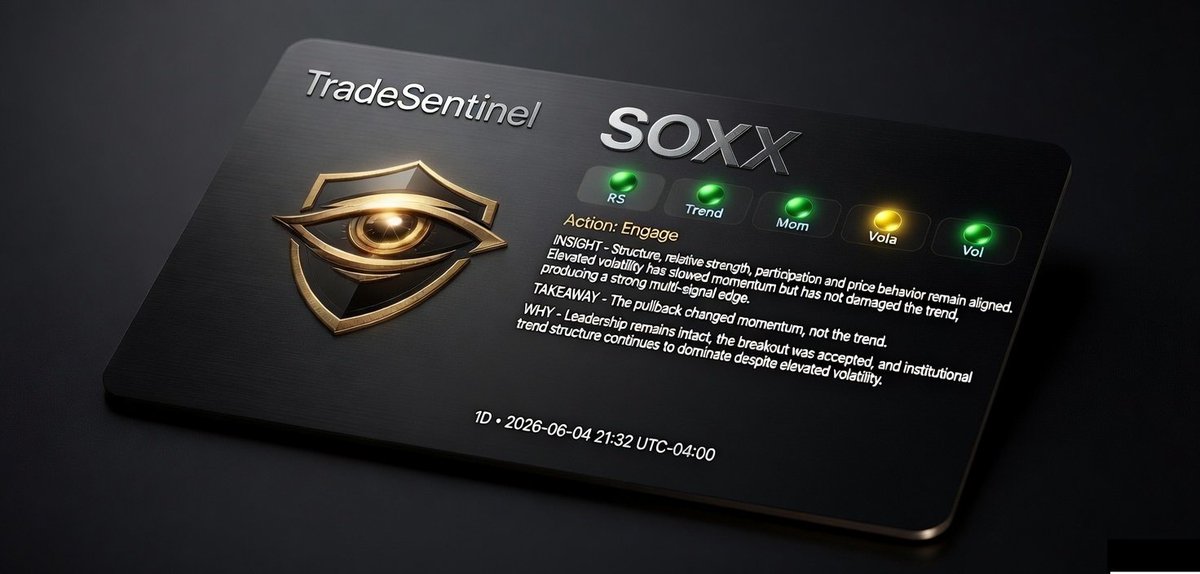
The latest KPI table shows a constructive but selective uptrend. Major indices (SPY, QQQ) hold key longer SMAs (50/100/150) in green, while small caps (RUT/IWM) display multiple ▲ weekly improvements. Tech/Semis (XLK, SOXX) remain strong but some assets like Gold are extremely stretched (multiple ✕). Defensives and certain sectors (XLC, XLU, XLY) continue lagging.
2️⃣ Thesis
We are in a broadening selective bull market. Leadership is shifting from narrow Tech dominance toward improved small-cap participation, while stretched assets signal caution and potential rotation.
3️⃣ What validates the thesis?
Small caps (RUT/IWM) showing consistent ▲ in both absolute and relative (/SPY) views → broadening breadth.
Tech leaders holding green on longer SMAs with some relative strength intact.
Many assets still trading within historical std dev bands (green ✓).
Weekly signals appearing in previously lagging areas.
4️⃣ What invalidates the thesis?
Sustained ▼- in SPY/QQQ short-term columns combined with more ✕ in key leaders.
Small caps failing to maintain relative outperformance vs SPY.
----------------
Why This Chart View Works So Well
1. Reduction of Uncertainty / Confusion
Instead of guessing market direction, this table gives a clear evidence-based picture across 25 assets in one glance. You don’t need to know the future; you simply assess whether the weight of evidence is improving or deteriorating.
2. Reduction of Effort
No more scanning dozens of individual charts. With one consistent framework you repeatedly check the same small set of conditions (SMA trends, price position, statistical bounds, and weekly changes). This makes decisions faster and more consistent.
3. Identity Reinforcement
This dashboard reinforces a disciplined, process-driven approach. Successful investors are not defined by being right on every trade — they are defined by following evidence over opinion and probabilities over prediction.
I am a process-driven investor, not a prediction-driven investor.
Save this view. Check it weekly. Let the weight of evidence guide your next moves.
83
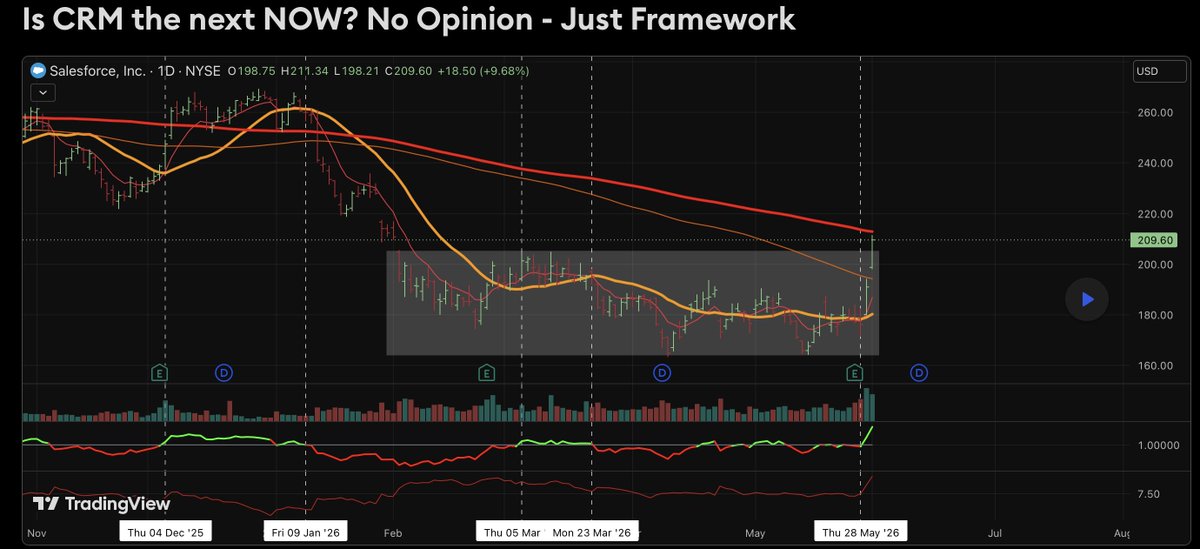
Is $CRM the next $NOW? No Opinion - Just Framework
@grok assess the validity and value of the content taken from the URL (2nd June; tradingview.com/chart/CRM/5y…). Add a specific note to the invalidation statement in the content and what this would have meant for risk exposure and capital protection.
--------------
A few days ago, I wrote about NOW when the framework shifted from “Monitor” to “Engage” for the first time since its downtrend.
CRM is now showing a similar structural improvement. This happens whilst Software and SaaS see a recovery. TradeSentinel does not predict and focuses at what can be observed.
TLDR
1️⃣ What is it today?
9.68% breakout day to 209.60, closing near the high and at/near 3M high. Price cleared SMA20/50/100 cluster at extreme percentile ranks on strong volume.
2️⃣ Thesis
Momentum expansion with a strong multi-signal cluster edge. Five independent signals (structure, momentum, RS, volume, price acceptance) aligned on the breakout. Volatility is expanding but acting as fuel on the up day.
3️⃣ What validates the thesis?
Clean acceptance above key SMAs prior range
RS bullish with zero divergence
Volume confirming the move
Five signals converged (not just one loud candle)
4️⃣ What invalidates the thesis?
Daily close below 198 (today’s low / breakout level). This breaks price behavior and short-term structure in one move.
🧩 FULL SIGNAL DECOMPOSITION
Trend Structure
Price decisively above SMA20/50/100
SMA150 (212.9) still slightly above price
Clean break above recent consolidation zone
SMAs not stacked but flattening and likely turning over.
👉 Alone / Isolated: Strong short-to-intermediate structure with one moderate friction point (SMA150)
👉 Combined: Supports expansion phase but not yet complete bullish realignment
Momentum
EMA8 at 187 with price 12.1% above — wide, healthy separation
9.68% high-conviction green candle closing near session high
Momentum impulse visible on the breakout day
👉 Alone / Isolated: Strong impulse signal on the day
👉 Combined: Reinforces trend resumption momentum
Relative Strength
RS bullish (green)
RS with new high
👉 Alone / Isolated: Clear leadership signal
👉 Combined: Confirms the move has relative (not isolated) strength
Volatility
Expanding / steepening volatility on the up day
Occurring with the strong price move
👉 Alone / Isolated: Weak standalone (high-stress amplifier, two-way risk)
👉 Combined: Currently permissive fuel because aligned with bullish cluster
Volume / Participation
Large green volume bar on the 9.68% breakout day
Earlier green volume dots marking prior accumulation phases
👉 Alone / Isolated: Confirming participation spike
👉 Combined: Supports institutional involvement in the expansion
Price Behavior
Decisive breakout candle with acceptance near highs
Price at 3M high
Today’s low at 198.21 as clear reference level
👉 Alone / Isolated: Strong acceptance, not rejection
👉 Combined: High-conviction price action validating the cluster
1
106
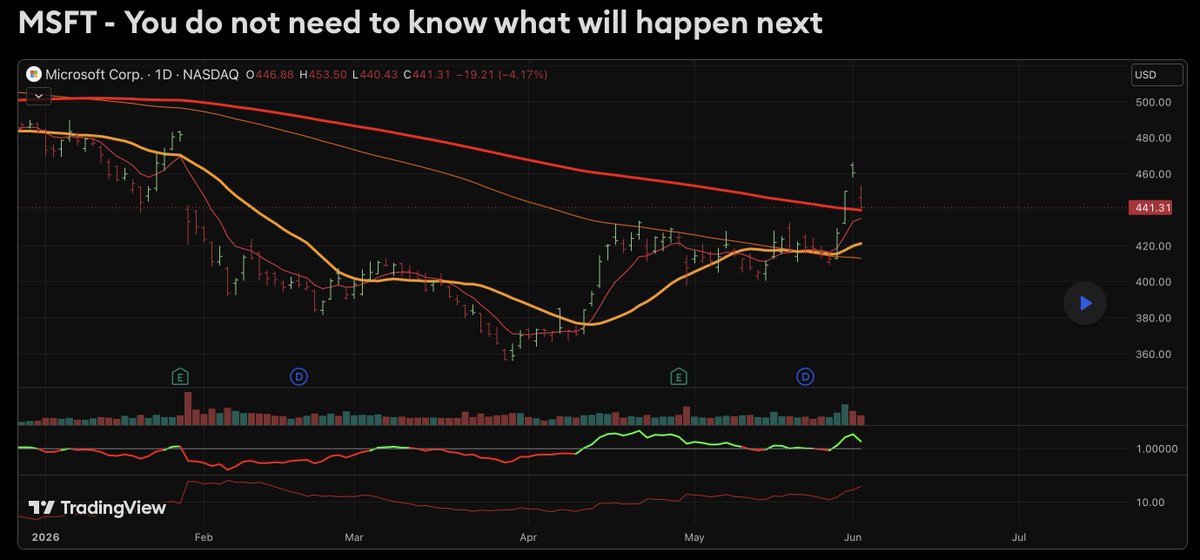
$MSFT - You do not need to know what will happen next.
@grok assess the validity and value of the content taken from the URL (3rd June; tradingview.com/chart/MSFT/1…)
In MSFT the TradeSentinel framework calls for restraint and patience. This message is not excitement and no dopamine kick.
The edge right now belongs to those who can sit on their hands and wait for the structure to either repair or fully break.
The next few sessions will likely decide if this is a healthy shakeout or the beginning of a real reversal. Don’t confuse a still-elevated price with a healthy trend.
👉 There is no need to rush. There is no need to forecast prices.
👉 The key is confidence and a positive expectancy of your trading system.. Look at linked posts about DELL (DELL:Worrying About Entering Late Would Have Cost Me a 115% Gain) and MTSI (How to add up on a position which is 50% up and on fire?). This is how I can act with calm and confidence.
1️⃣ Overall State
Distribution Risk at 3M high. Sharp -4.17% rejection on high relative volume (3x) in extreme expanding volatility.
2️⃣ Thesis
MSFT showing exhaustion signals after failing to hold 3M high. Caution is warranted.
3️⃣ What Validates the Thesis?
Heavy volume red candle at highs
Extreme expanding volatility regime
Rejection after 3M high attempt
Poor absorption on selloff
4️⃣ What Invalidates the Thesis?
Strong bullish reversal on declining volume
Price holds above SMA20 (~421.3) with volume support
Volatility begins easing
🧩 FULL SIGNAL DECOMPOSITION
Trend Structure
Price still above SMA20 ( 4.8%) and SMA50 but rejected sharply at 3M high with large red candle. SMAs mostly upward-sloping but losing acceleration.
👉 Alone / Isolated: Moderately supportive (structure intact but decelerating).
👉 Combined: Weakened — distribution candle near highs undermines the uptrend.
Relative Strength
Little to no relative strength
👉 Alone / Isolated: low conviction
👉 Combined: reduces conviction
Volatility
Regime: Extreme
Change: Expanding / Steepening (highly unfavorable).
👉 Alone / Isolated: Strongly Bearish (increases risk of larger moves).
👉 Combined: Very negative — extreme expanding vol on distribution day significantly raises reversal probability.
Volume / Participation
High Relative Volume (during recent days) including last two days — clear effort vs poor result.
👉 Alone / Isolated: Bearish (distribution signal at highs).
👉 Combined: Strongly negative — high volume rejection confirms supply entering.
Price Behavior
Sharp -4.17% reversal candle failing to hold 3M high after recent attempt. Poor close near lows of day.
👉 Alone / Isolated: Bearish (rejection and loss of momentum).
👉 Combined: Dominant negative signal — overrides SMA support in current context.
Overall Signal Composition Verdict: Bearish tilt due to high-conviction negative signals in Volatility Volume Price Behavior outweighing residual Trend/RS support.
1
79
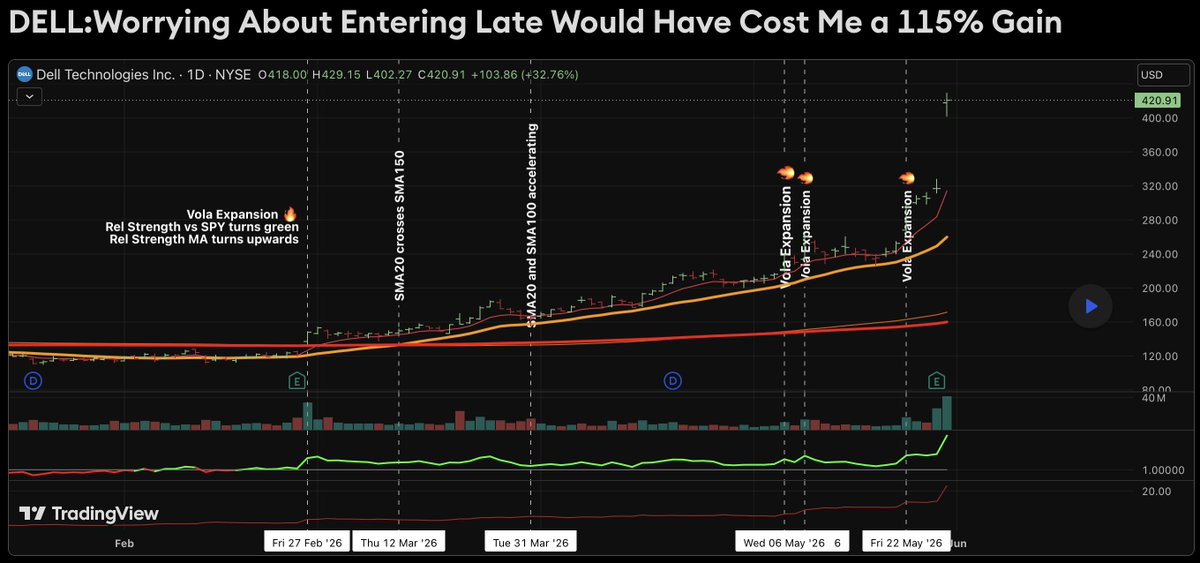
DELL:Worrying About Entering Late Would Have Cost Me a 115% Gain
@grok assess the validity and value of the content taken from the URL (30th May; tradingview.com/chart/DELL/B…)
Looking back at the chart, what stands out is not the eventual magnitude of the move, but how many signs were already pointing toward an improving structure long before the stock became a market leader. Relative strength turned positive, the relative strength moving average started rising, key moving averages crossed into bullish alignment, and longer-term trend momentum began accelerating. Volatility acted as fuel and was not hostile.
In hindsight, the evidence was plentiful. The reality, however, is that I was not watching Dell particularly closely at the time and therefore did not act on the earlier signals.
What ultimately gave me confidence to enter (late) was not a single indicator but the continued accumulation of evidence. As additional signals appeared and the trend kept confirming itself, the probability of a sustained move increased, even though the stock was trading significantly higher than where the first clues had emerged.
One of the most persistent mistakes investors make is assuming that a stock which has already risen significantly is no longer worth buying. We are conditioned to search for bargains, to believe that the best opportunities exist near the lows, and to feel uncomfortable paying prices that are noticeably higher than they were only a few weeks earlier. In practice, however, many of the market's biggest winners do not look attractive when they begin their most profitable advances. They look expensive, extended, and, above all, late.
When I bought Dell around $197 on 18th April, the stock had already moved well off its lows (> 70%). To many observers, the obvious conclusion would have been that the easy money had already been made. Yet the chart was telling a very different story. Several pieces of evidence suggested that institutional demand was strengthening rather than weakening:
* Relative Strength turned positive.
* Relative Strength started outperforming the market.
* The Relative Strength moving average turned upward.
* Price reclaimed and held above key trend references.
* The longer-term trend structure began accelerating.
None of these developments guaranteed future gains, but together they painted a picture of a stock moving from recovery into leadership. Since then, Dell has advanced to roughly $420, turning what many would have considered a "late" entry into a gain of around 115%.
The lesson is not that every stock purchased after an initial advance will double. The lesson is that investors often focus on how much a stock has already moved instead of asking whether the underlying trend is becoming stronger. Successful trend investing is not about buying at the lowest possible price; it is about recognizing when demand is becoming persistent and when a stock is transitioning from being overlooked to being widely accumulated. Ironically, the greatest opportunities rarely feel comfortable when they first emerge. They often feel:
* Extended.
* Uncomfortable.
* As if the move has already happened without you.
That discomfort is precisely why many investors miss them. What feels late at the beginning of a major trend often turns out to have been remarkably early. In many cases, the greatest opportunity cost is not buying too late—it is spending so much time worrying about being late that you never participate in the trend at all.
1
50
Jun 13
Weekly Review - TLDR
The most important message from the dashboard is that internals improved faster than price. Leadership expanded, participation recovered and volatility normalized while price remains below recent highs. That combination suggests the market’s internal condition is currently stronger than the recent price action alone would imply. The evidence therefore supports a regime of Acceptance with Renewed Participation, where market internals are once again confirming rather than questioning the message of price.
tradingview.com/chart/ES1!/V…
1
7
Jun 13
The recent weakness looks increasingly like a rotation event that punished concentrated momentum exposure rather than a genuine deterioration in overall market health.
The recovery in market internals is not being driven by a single leadership group. Technology remains the dominant long-term leader, but Financials, Industrials, Real Estate and Healthcare are now contributing to participation as well. This broadening of leadership helps explain why New Highs expanded dramatically and why breadth recovered faster than price. The current environment appears less like a narrow AI-driven advance and more like a market where participation is becoming increasingly diversified.
The Market Didn’t Break. It diversified.
That’s why the dashboard looked healthy while (AI/Chip) momentum portfolios struggled.
Technology: Established leadership still intact
Industrials: Strong secondary leadership, confirming economic participation
Financials: Emerging leadership, strongest recent improvement
Real Estate: Improving participation, risk appetite broadening
Healthcare: Early repair phase rather than true leadership
Technology remains:
* 3M: 27.13%
* 6M: 16.76%
* 1Y: 43.07%
* YTD: 20.61%
Financials improved:
* 3M: 11.46%
* 6M: 2.15%
* 1Y: 12.83%
* YTD: 0.61%
Industrials improved:
* 3M: 9.17%
* 6M: 15.36%
* 1Y: 26.82%
* YTD: 16.12%
Real Estate improved:
* 3M: 6.94%
* 6M: 9.85%
* 1Y: 8.36%
* YTD: 10.69%
Healthcare improved:
* 3M: 3.22%
* 6M: 0.80%
* 1Y: 13.33%
* YTD: -0.59%
1
14
Jun 2
A lot of new insights from the TradeSentinel AI
tradingview.com/u/TradeSenti…
tradesentinel-archive.stream…
18
May 30
Content which does not make its way on X faster interaction:/updates:
👉 Telegram: t.me/TradeSentinelApp
👉 TradingView Minds: tradingview.com/u/TradeSenti…
50
Apr 21
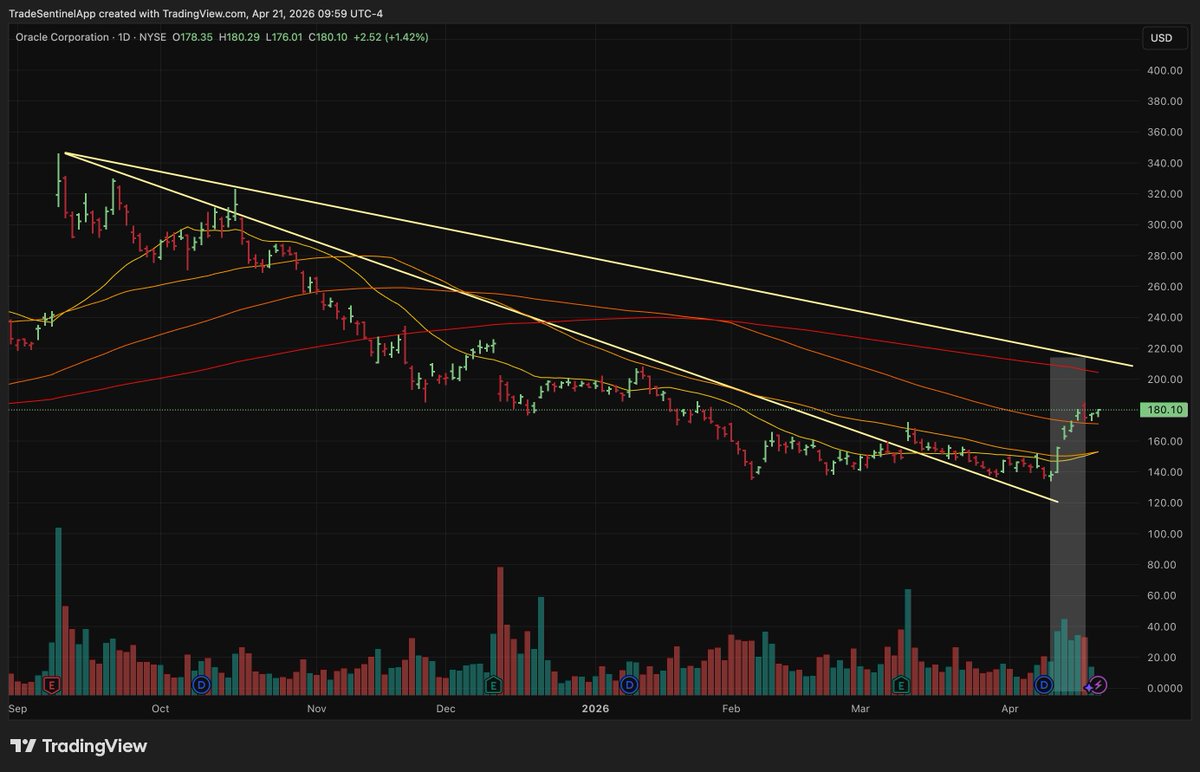
🧵1/4 You think this is a good setup. But can you actually tell the difference? TradeSentinel will tell you if you’re right. Let's use $ORCL as case and check for TradeSentinel's view 👇
2
177
May 30
Update: x.com/tradesentiapp/status/2…
May 29

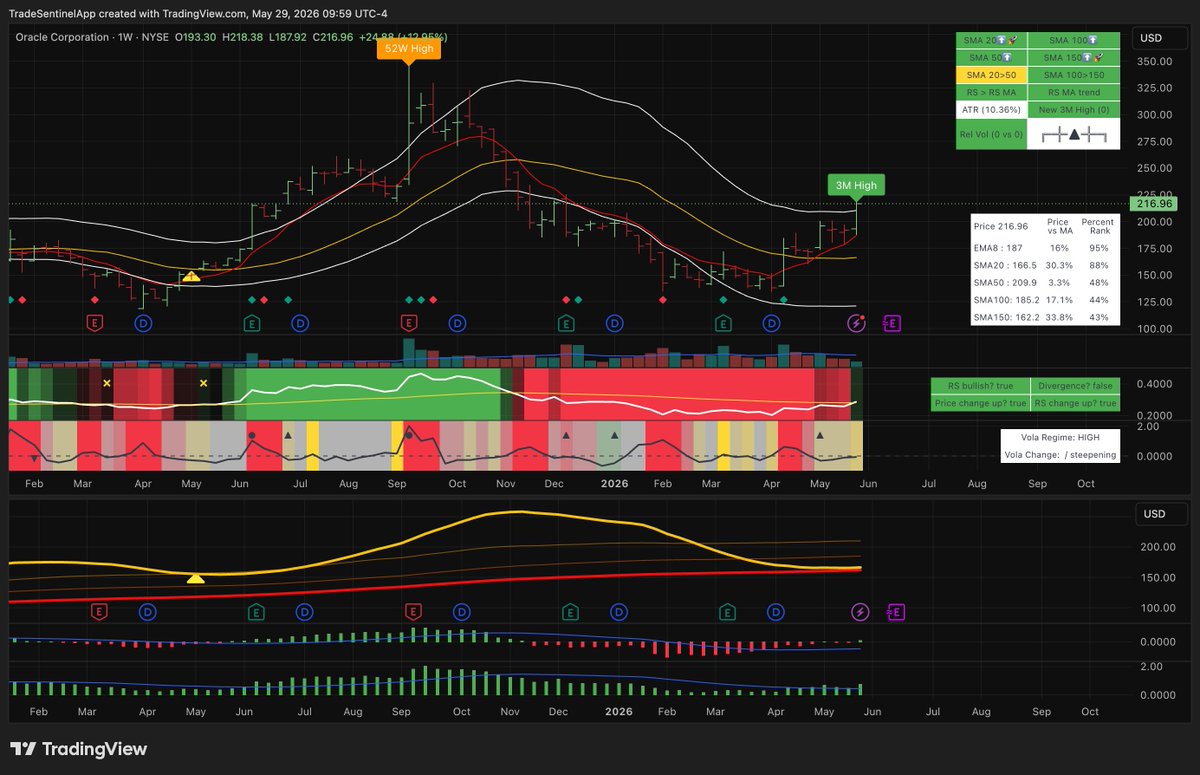
$ORCL - Entry logic at the bottom 👇
1️⃣ What is it today?
ORCL is a momentum expansion stock that has successfully repaired its prior correction and is now pushing into fresh 3-month highs with improving leadership.
2️⃣ Thesis
The stock has transitioned from repair back into expansion. Price, relative strength, structure, and participation are aligned, creating a continuation environment rather than a recovery environment.
3️⃣ What validates the thesis?
✅ New highs continue to be accepted
✅ RS remains above RS MA
✅ SMA structure stays fully ordered
✅ Momentum continues to accelerate
✅ Volatility expands with price, not against it
4️⃣ What invalidates the thesis?
❌ Loss of SMA50 support
❌ RS deterioration below RS MA
❌ Failed acceptance of the new 3-month high
❌ Volatility expansion while price weakens
💡 $ORCL no longer behaves like a stock trying to recover. It behaves like a stock that has already recovered and is re-entering a momentum expansion phase. As long as leadership and acceptance remain intact, continuation remains the default assumption.
Conservative Entry
Pullback toward EMA8/SMA20 zone.
Accept risk of missing continued expansion.
Aggressive Entry
Enter through continued acceptance above recent highs.
30
May 29
$ORCL - Entry logic at the bottom 👇
1️⃣ What is it today?
ORCL is a momentum expansion stock that has successfully repaired its prior correction and is now pushing into fresh 3-month highs with improving leadership.
2️⃣ Thesis
The stock has transitioned from repair back into expansion. Price, relative strength, structure, and participation are aligned, creating a continuation environment rather than a recovery environment.
3️⃣ What validates the thesis?
✅ New highs continue to be accepted
✅ RS remains above RS MA
✅ SMA structure stays fully ordered
✅ Momentum continues to accelerate
✅ Volatility expands with price, not against it
4️⃣ What invalidates the thesis?
❌ Loss of SMA50 support
❌ RS deterioration below RS MA
❌ Failed acceptance of the new 3-month high
❌ Volatility expansion while price weakens
💡 $ORCL no longer behaves like a stock trying to recover. It behaves like a stock that has already recovered and is re-entering a momentum expansion phase. As long as leadership and acceptance remain intact, continuation remains the default assumption.
Conservative Entry
Pullback toward EMA8/SMA20 zone.
Accept risk of missing continued expansion.
Aggressive Entry
Enter through continued acceptance above recent highs.
137
May 29
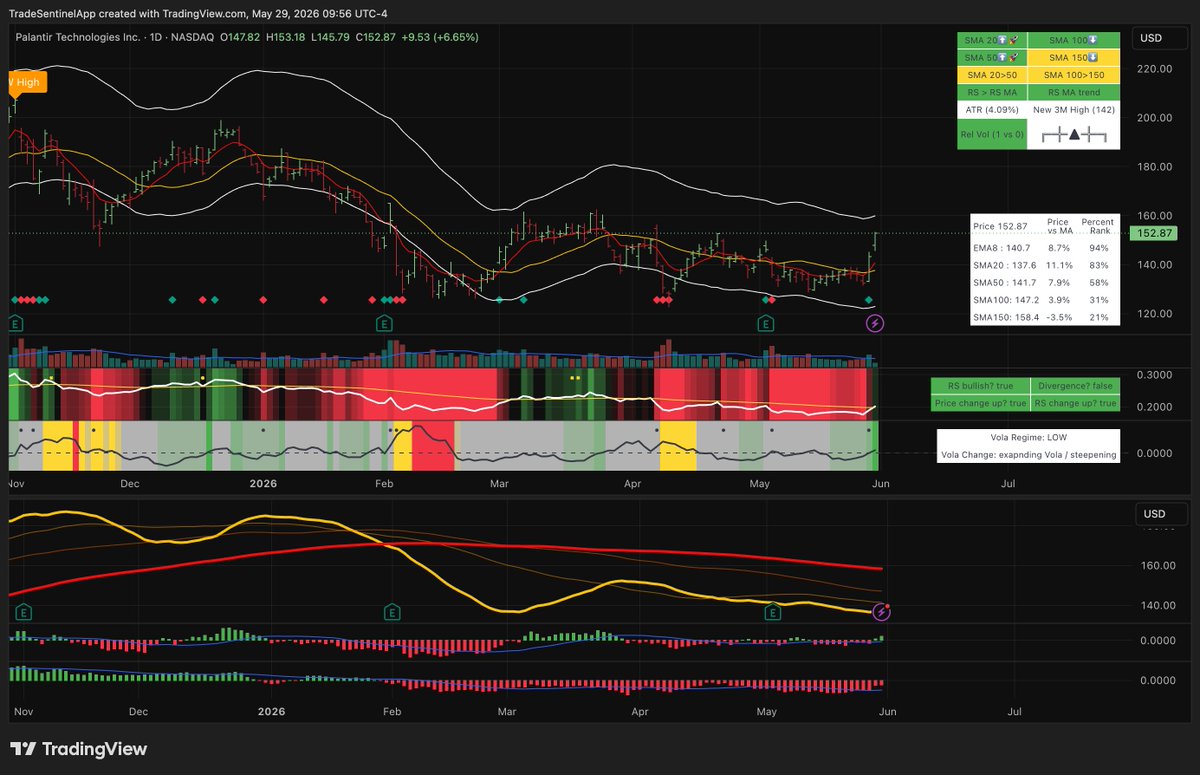
$PLTR - Entry logic at the bottom 👇
1️⃣ What is it today?
PLTR is a momentum expansion stock emerging from a multi-month consolidation. Price, relative strength, and participation are all improving simultaneously.
2️⃣ Thesis
The stock has transitioned from compression into expansion. The market is accepting higher prices, and leadership characteristics are strengthening. The opportunity comes from persistence of the trend rather than prediction of a breakout.
3️⃣ What validates the thesis?
✅ Price remains above SMA20
✅ Relative strength stays above its moving average
✅ Breakout acceptance continues
✅ Volatility expands with price
✅ Momentum remains positive
4️⃣ What invalidates the thesis?
❌ Loss of SMA20 support
❌ RS deterioration below RS MA
❌ Failed breakout acceptance
❌ Volatility expansion while price weakens
💡 $PLTR currently looks like a constructive transition from consolidation into momentum expansion. Structure, leadership, and volatility are aligned. As long as acceptance remains intact, continuation remains the default assumption.
Conservative Entry
Pullback into SMA20–EMA8 zone (~138–145)
Aggressive Entry
Acceptance above current breakout area (~150–153)
87
May 29
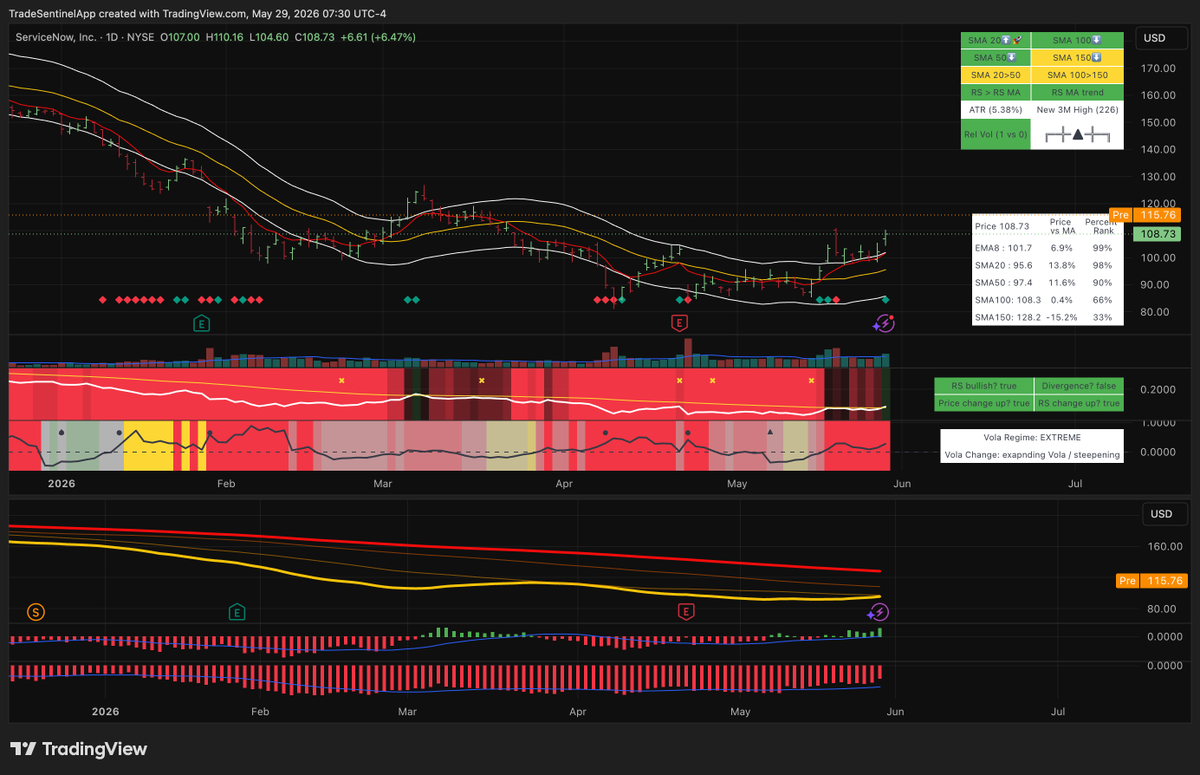
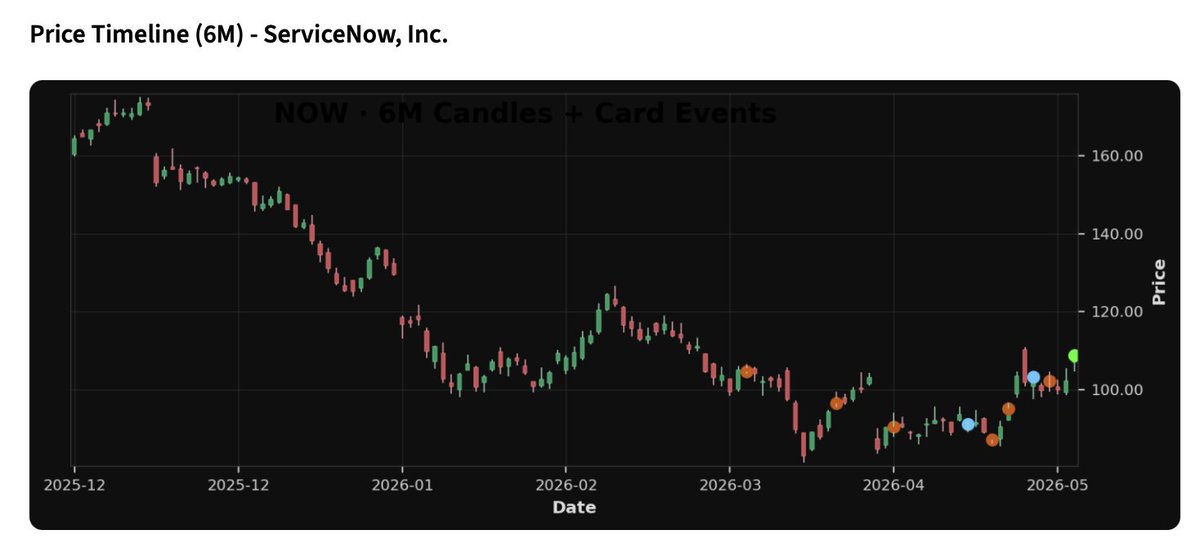
It is the first time since $NOW is being tracked that it switched to "engage" (green dot in the chart) read below why:
1️⃣ What is it today?
A momentum expansion stock emerging from a successful structural repair.
Price has reclaimed key moving averages, relative strength is improving, and momentum has re-accelerated after the April reset.
2️⃣ Thesis
The market is accepting higher prices again.
This is a Reset → Relaunch phase where trend structure, momentum, relative strength, and participation are aligning. The edge comes from persistence and continued institutional acceptance, not from predicting a breakout.
3️⃣ What validates the thesis?
✅ Price holds above SMA20
✅ Relative Strength remains above its moving average
✅ Momentum continues to improve
✅ Volatility expands with price, not against it
✅ Higher prices continue to be accepted rather than rejected
4️⃣ What invalidates the thesis?
❌ Loss of SMA20 support
❌ Relative Strength deterioration below its moving average
❌ Volatility expansion while price weakens
❌ Failed re-acceleration after the recent recovery
💡 This is not a turnaround story anymore. The repair phase appears complete, and the stock is transitioning into a momentum expansion regime. As long as structure and relative strength remain intact, continuation remains the default assumption.
2
1
1,389